
Definition
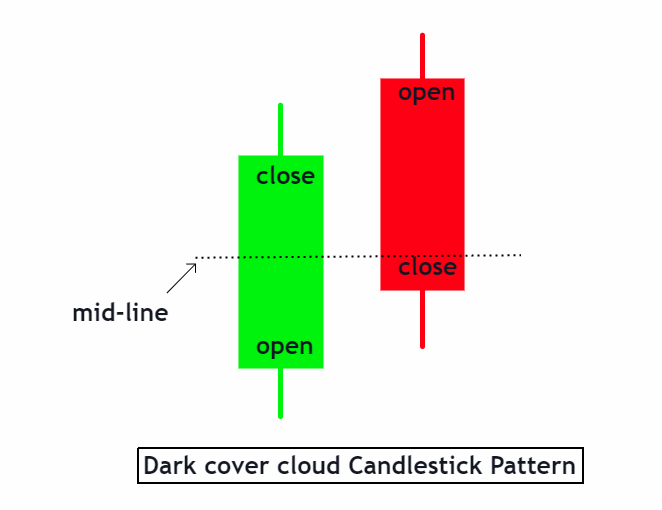
A dark cover cloud candlestick pattern is defined as a contrasting pair of candles that exhibits a bearish reversal pattern. In this pattern, a bearish candle follows a bullish candle.
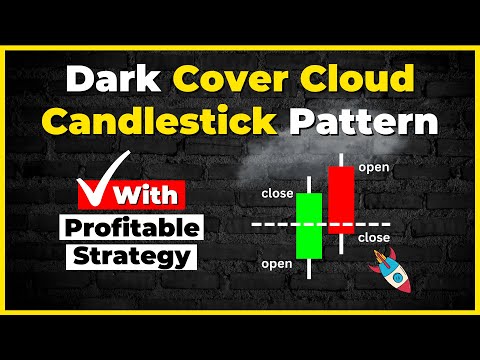
- The open of the bearish candle is always higher than the close of the prior bullish/ white candle.
- The close of the bearish candle is situated below the mid-point of the first candle.
- It is a unique combination of two opposite nature candles.
- The distance between the close of the bullish candle and the opening of the bearish candle forms a price gap in the market.
As the name suggests, it is easier to find this candlestick pattern, just like a dark cloud on a bright sunny day.
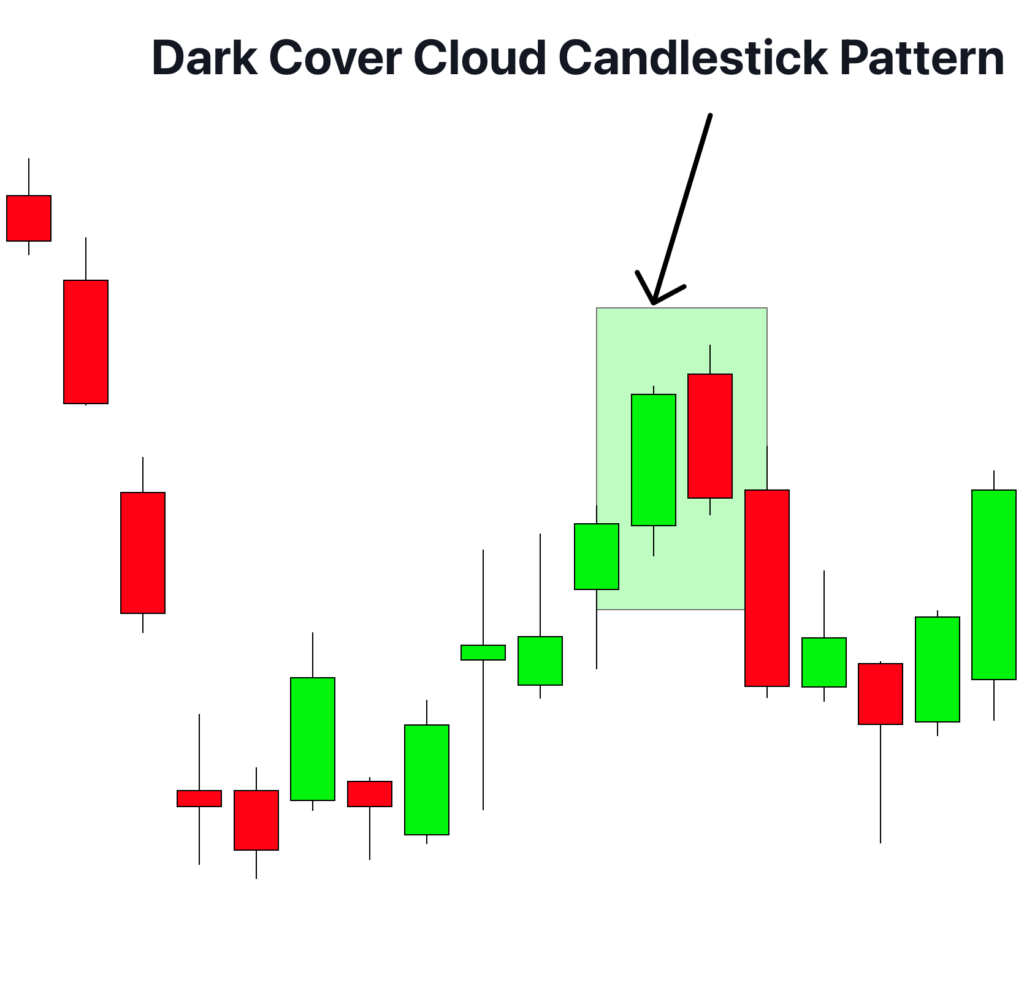
How to find the dark cover cloud candlestick pattern
The Dark cloud cover candlestick pattern is unique. It is easier to find this candlestick pattern because of its contrasting nature. We can find this candlestick pattern in two easy steps.
Step 1:
In an already bullish market, a routine bullish candlestick will appear on the chart. The candle is a regular one, having regular body and wick sizes.
Step 2:
A bearish candle follows the bullish candle in the chart. The open of the bearish/black candle is always higher than the close of the bullish/white candle. This indicates the price gap. Moreover, the close of the second/bearish candle is always below the mid-point of the first white candle.
| Number of candlesticks | Two candlesticks The first one is a white candle The second one is a black candle |
| Prior Trend | Bullish trend This candlestick pattern refers to the shift in the market in favor of bears. |
| Forecast | As a bearish reversal candlestick pattern, this pattern tells the traders that the market is going to shift its momentum. The bears will replace the bulls in the near future. The number of sellers will take over the number of buyers as the bullish sentiment begins to fade away. |
| Color | The first candlestick in a Dark cloud cover is green in color. The second bearish candle is black. |
Analysis of a Dark cover cloud candlestick pattern
Now you are well aware and capable of identifying this pattern. It is time to learn how to analyze it. Analyzing a pattern is a very crucial step because it can make a big difference in your trading strategy and experience.
Here are some key tips which will help you understand this pattern in more depth.
- If the price gap between the close of the white candle and the opening of the dark candle is bigger. The market reversal will be bigger too.
- If the length of the bullish and bearish candles is longer, the reversal in the prices will be more noticeable.
- The reversal is more solid if the bearish candle close further lower than the mid-point of the white candle.
- If the volume on a dark cover cloud candlestick is high, the reversal has more chances of success.
The psychology behind the dark cover cloud pattern
We can understand the dark cover cloud pattern in two steps. The first candlestick suggests the bulls still control the market. The bullish sentiments of the market tell us that the number of buyers is dominating the market. At this step, the traders tend to buy assets because of the prior and current bullish sentiment in the market.
In the second step, when the dark cloud (bearish candle) covers the bright sunny day (bullish candle). The seasoned traders begin to realize a rainy day (reversal in momentum) is about to happen. This shift in the momentum, where bears weigh up to take on the bulls. The traders tend to sell their assets to avoid further losses or margins in profits.
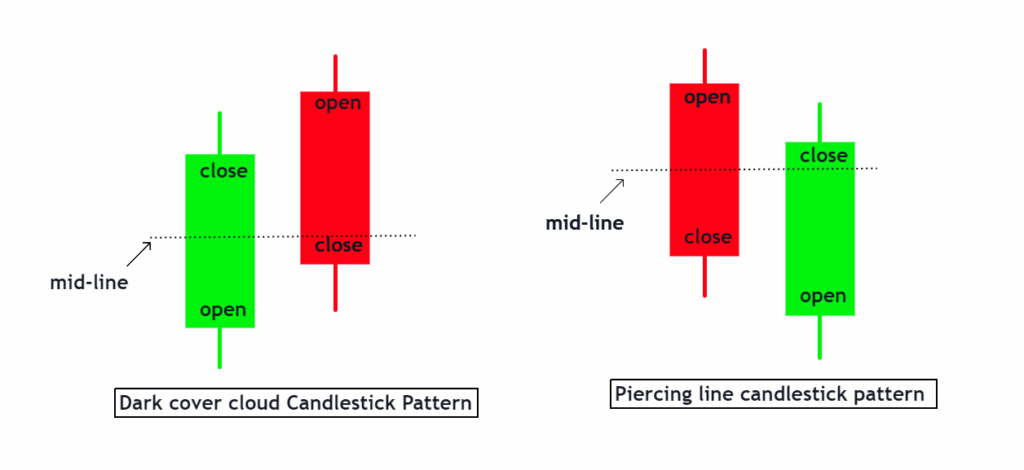
Dark cover cloud vs. piercing line pattern
The piercing line pattern is a contrasting candlestick pattern to a Dark cover cloud candlestick pattern.
The following table will explain the critical difference between these two candlestick patterns.
| Key points | Dark cover cloud candlestick pattern | Piercing line candlestick pattern |
| Nature | Bearish reversal | Bullish reversal |
| Arrangement of candlesticks | Bullish candle followed by a bearish candle | A bearish candlestick follows a bullish candlestick |
| Prior trend | bullish/uptrend | bearish/downtrend |
| Forecast | The number of sellers will potentially increase | The number of buyers will potentially increase |
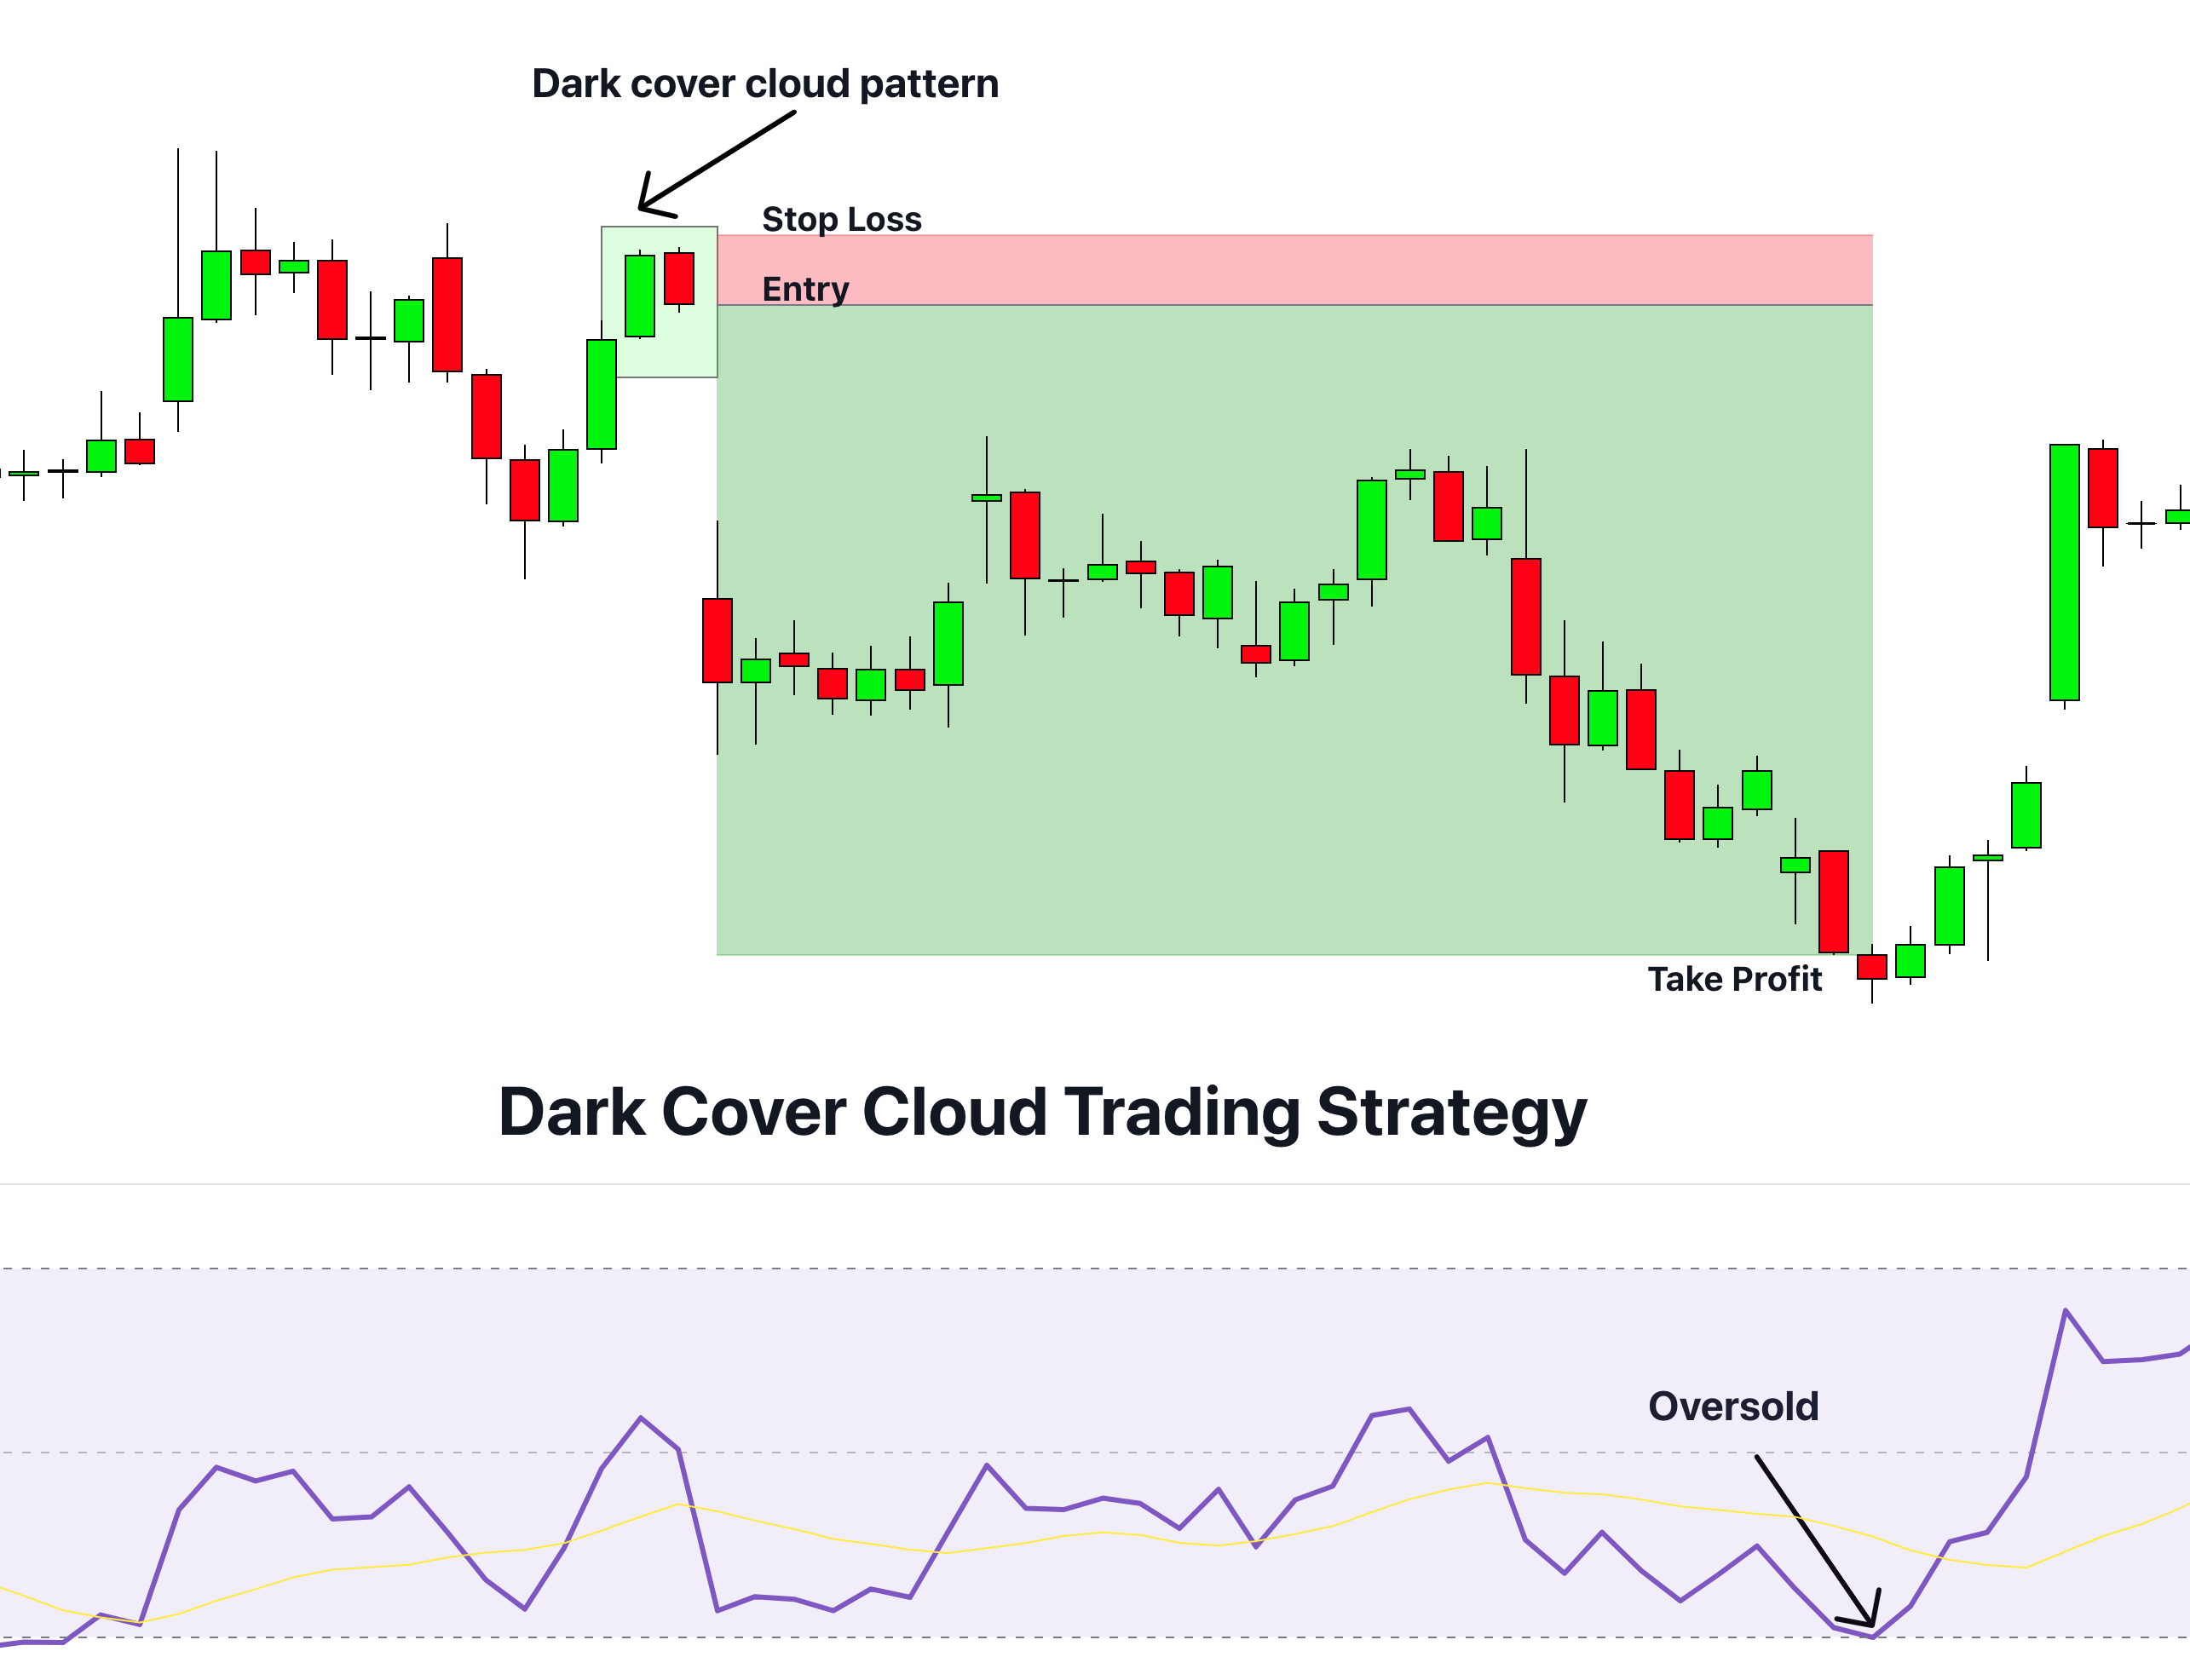
Dark cover cloud trading strategy
The trading strategy regarding a Dark cover cloud candlestick pattern is formed with the confluence of the support/ resistance zone.

Entry
The first candlestick in this pattern is a bullish candle which doesn’t provide necessary information about the future trend. A trader needs to wait for the appearance of the second black candle. The appearance of the second black candle gives an idea about taking a trading position. The bearish sentiment of the market will prevail in the future, which encourages the trader to take a position. Traders use the close of the black candlestick for exiting a long position.
Stop loss
The best position to place the stop loss while dealing with this pattern is above the high of the second dark candle. In this way, a trader can protect trade from stop loss.
Take profit
I emphasize you use the relative strength indicator (RSI) to take profit. The use of a dark cover pattern alone is not enough to secure a profit target. for example, when the indicator will show the oversold signal then close the sell trade.
The bottom line
A dark cloud cover candlestick pattern is a unique pattern. It is easy to locate on a candlestick chart. The pattern consists of two contrasting candles where a dark candle follows a white candlestick. The success ratio of this pattern is compromised. So it is not recommended to use this candlestick pattern alone to place your trades.