Definition
Supply and Demand represent the two most powerful forces of the forex market. Demand means the number of buyers buying a security in the market. Supply means the number of sellers selling a security in the market. Large supply takes the price to move down and large demand takes the price to move up. Balance in both forces will keep the price in sideways movement.
It is the most basic and essential element for technical analysis as well as fundamental analysis. It is the key to understanding the forex market.
The main benefit of S&D in technical analysis is to capture a Pinpoint entry exactly from where banks start buying and selling. Another Main benefit is that we can increase our risk-reward using a tight stop-loss or an open take profit with a breakeven.
How does supply & demand work?
There are two types of states of the price of a security in technical analysis
- Balanced state
- Unbalanced state
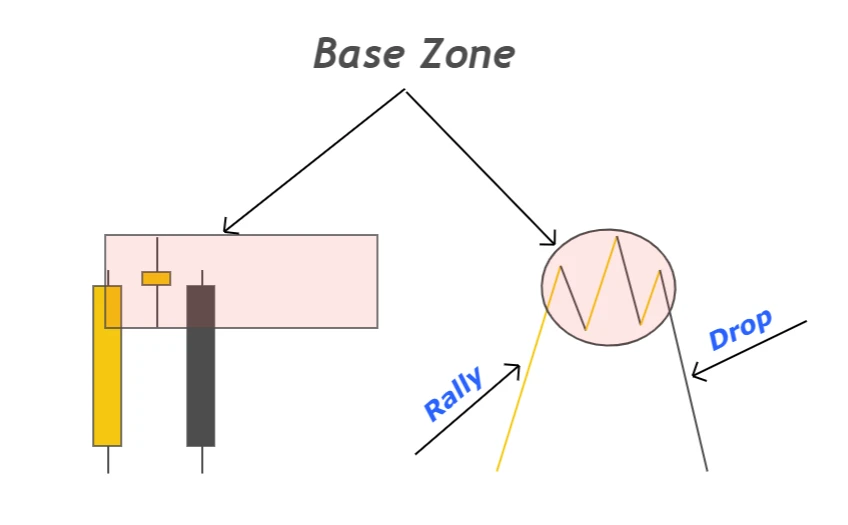
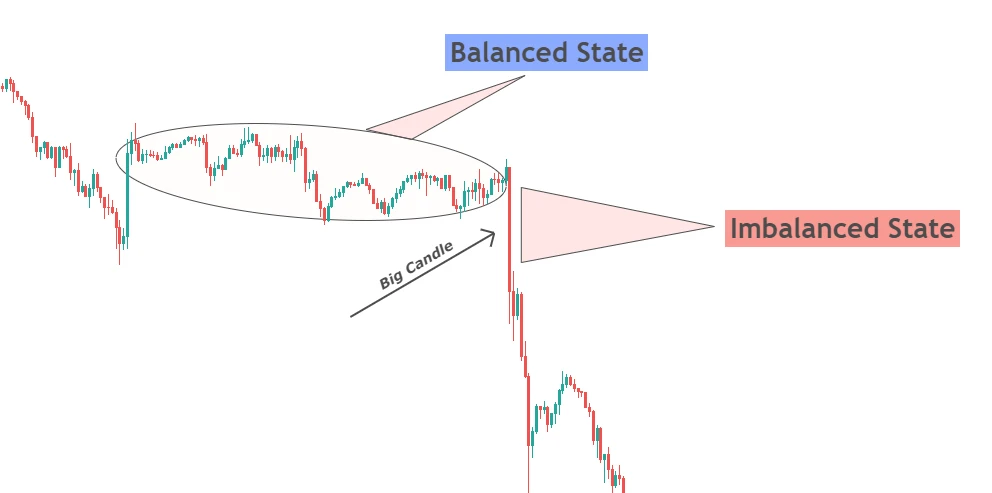
In a balanced state, the price is moving in a range like moving sideways. Simply means forces of buyers and sellers are balanced. Both of them don’t have the ability to create a trend either bearish or bullish trend. After breakout (usually happens in London session) of this sideways (range) movement of price, imbalance in price occur. And after the breakout, the recent range will be called a base zone and the price will again come to this base zone to pick unfilled orders.
How to identify supply and demand zones?
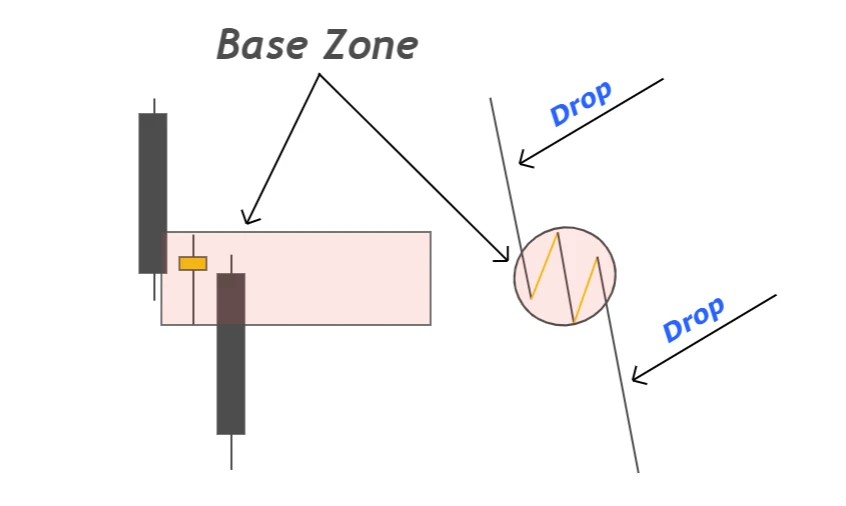
Supply and Demand zones are formed on the base region of price on the chart. There are basically two types of movement of price in technical analysis.
- Impulsive move
- Retracement move
The impulsive move represents the price movement of market makers. Retracement move indicates base regions where market makers decide their next direction either to go up or down. Price moves from one base region to another base region in technical analysis.
S&D Trading is to just figure out zones to open and close orders.
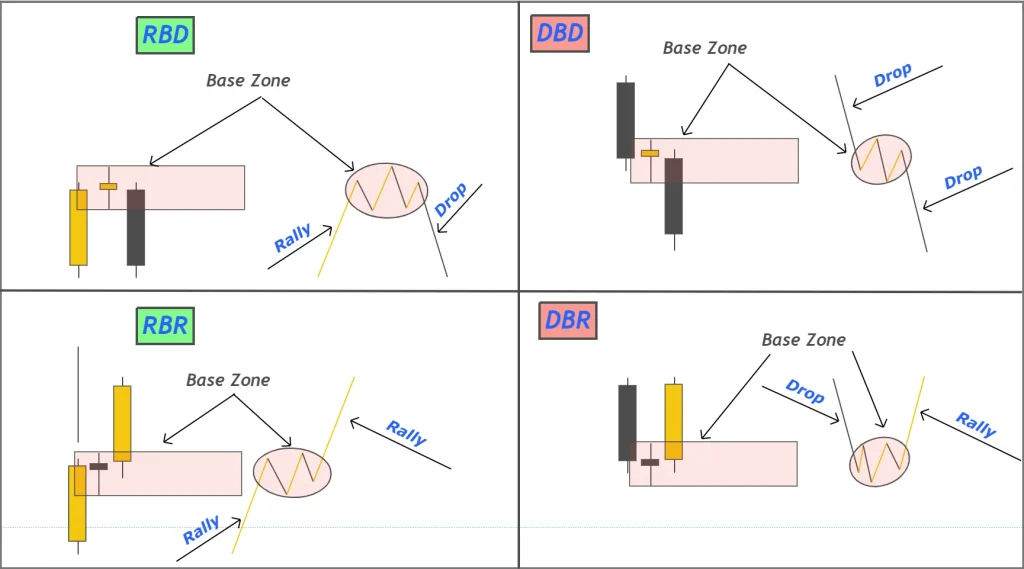
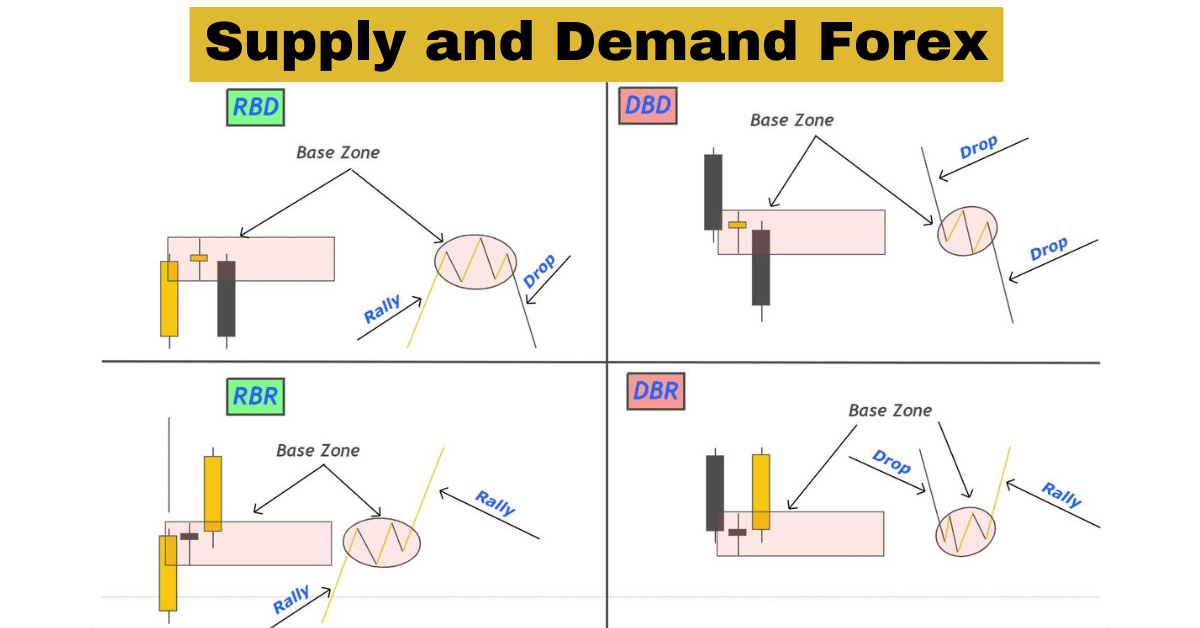
There are four basic concepts of demand and supply in forex.
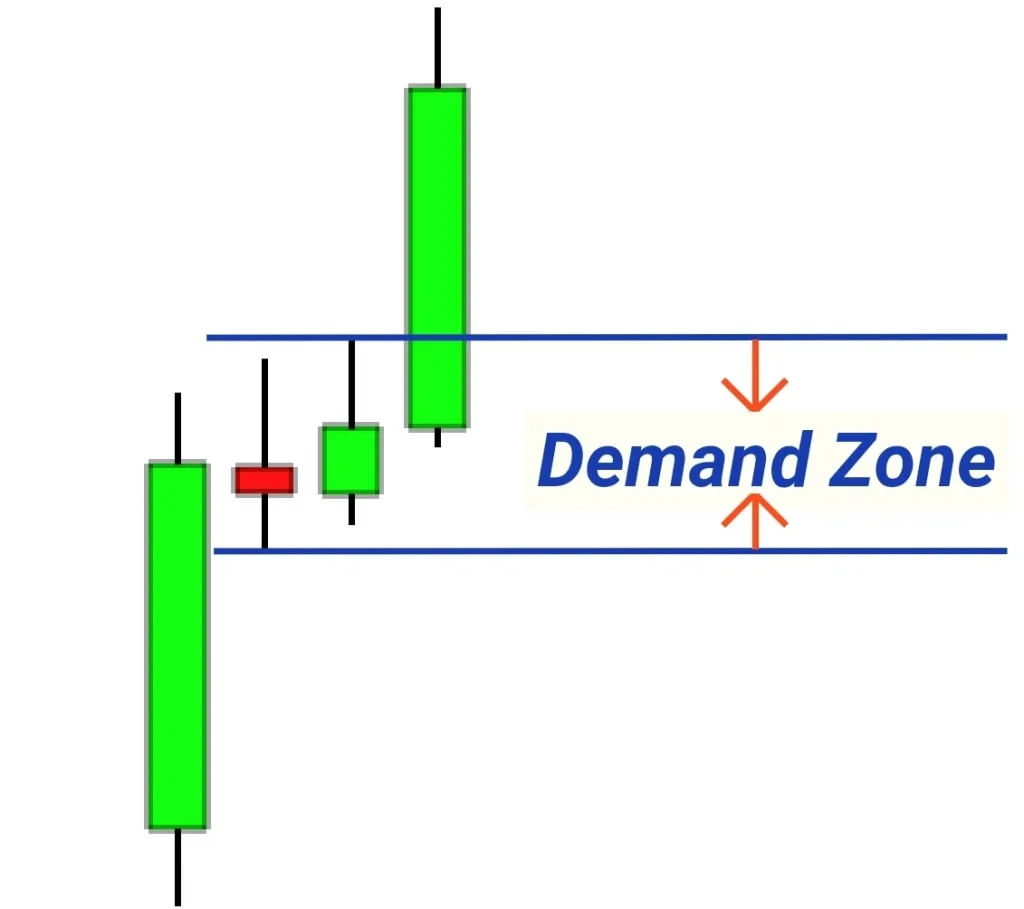

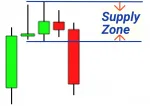
Key Points
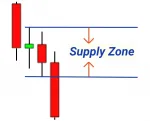
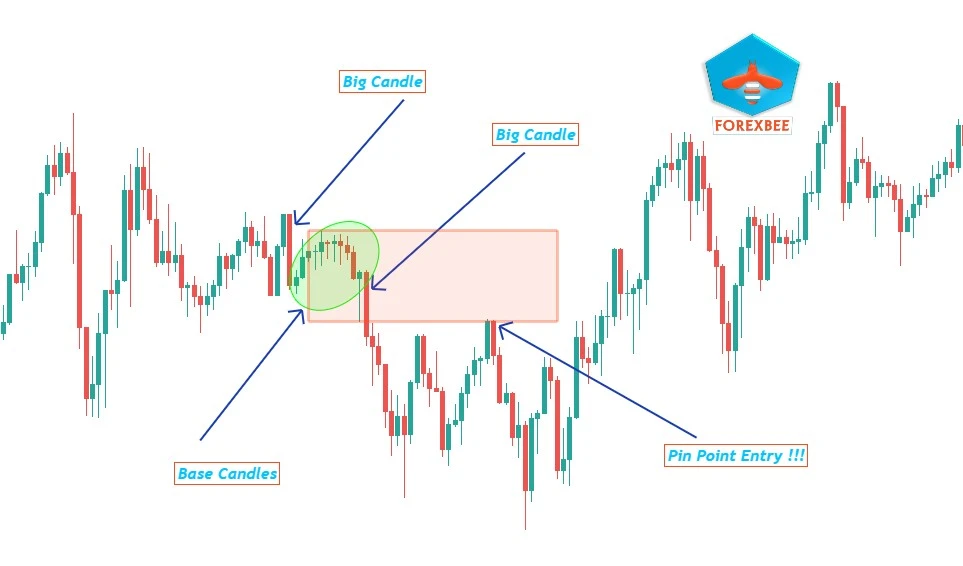
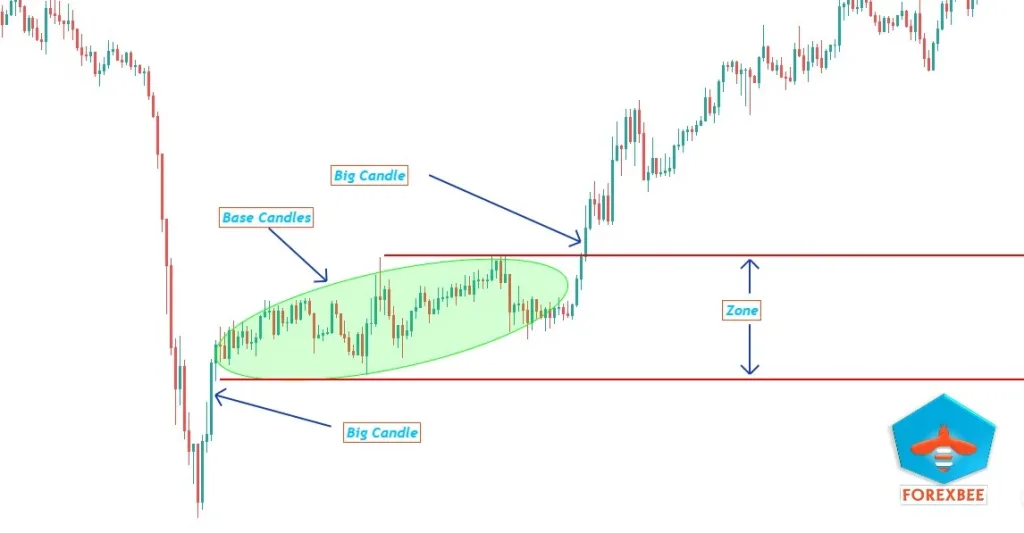
Simple Formula = Big candle + base candle + Big Candle
- Body to wick ratio of the big candle should be more than 75%
- Body to wick ratio of the base candle should be less than 50%
Have a look at the picture below
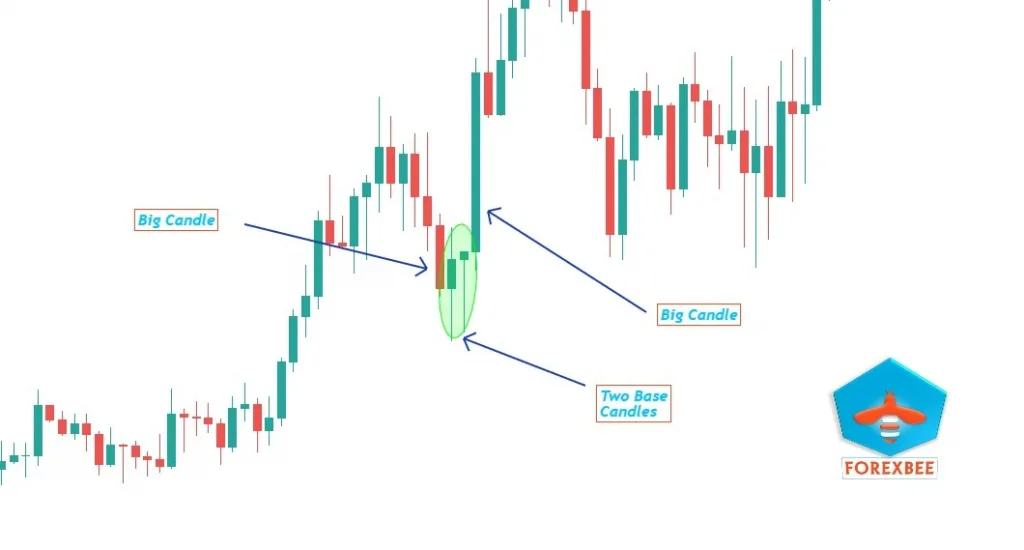
These zones are everywhere on the chart I will show you at the end of this Article. The Above image is of Drop Base Rally type of S&D. See in the chart above Market comes down to this level and just picked orders from the demand zone and went away. Supply and Demand is the Ever-Green Technique of forex technical analysis.
How to draw supply and demand zones in forex?
To draw a Supply or Demand zone, follow the following steps
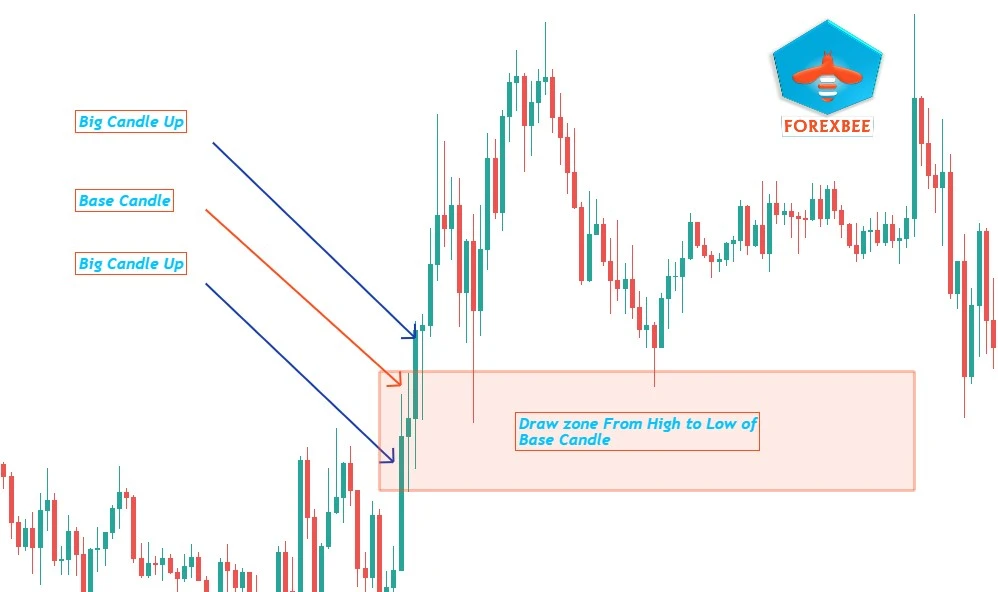
- Measure the range of the base region of price on the chart
- Mark the highest and lowest point of the base region on the chart
- Draw a zone by meeting the highest & lowest points of the region, then extend it appropriately to right on the chart of a currency pair
Time matters a lot to identify strong forex supply and demand zones. Because less time spent by the price at a certain base zone indicates a more powerful zone and more unfilled orders at the recent base zone. On the other hand, more time spent by the price at a certain base zone indicates a less powerful zone and less unfilled orders by institutions.
Another method to identify strong supply and demand zones is by using the Fibonacci tool. Most of the Supply and demand zones between Fibonacci 61.8 and 78 levels are stronger.
During drawing a base zone in forex supply and demand trading, remember to not go far back in history for finding a base zone because it’s common sense that institutions will not be going to hold their trades for years or months during intraday trading. I’m not talking about swing or long-term trading here.
How to trade supply and demand in forex?
Supply and demand trading is not tough. Just simple is to look for the best and fresh base zones and that base zone will act as the entry zone. Stop loss will be a few pips above or below the base zone depending on the timeframe.
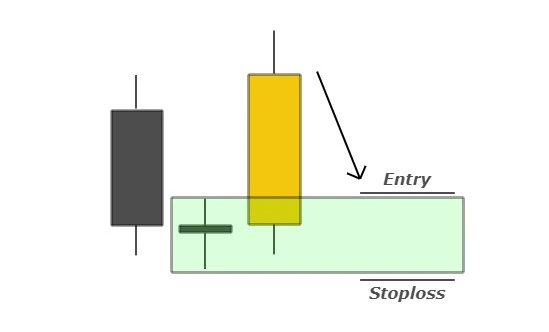
For example in the case of Rally base Rally, we will draw a zone at the low and high of the base candle. like in the below image.
In the case of RBR, a Pending buy order will be placed one to two pips above the base zone (remember to include spread) and stop loss will be a few pips below the zone (remember to include spread).
The disadvantage of supply & demand zone
The disadvantage of supply and demand zone trading is that this technique will never tell you about the take profit level. Its obvious price is moving from one zone to another zone but there is an unlimited number of zones on the chart that’s why Supply and demand zone trading doesn’t tell us about the take profit level.
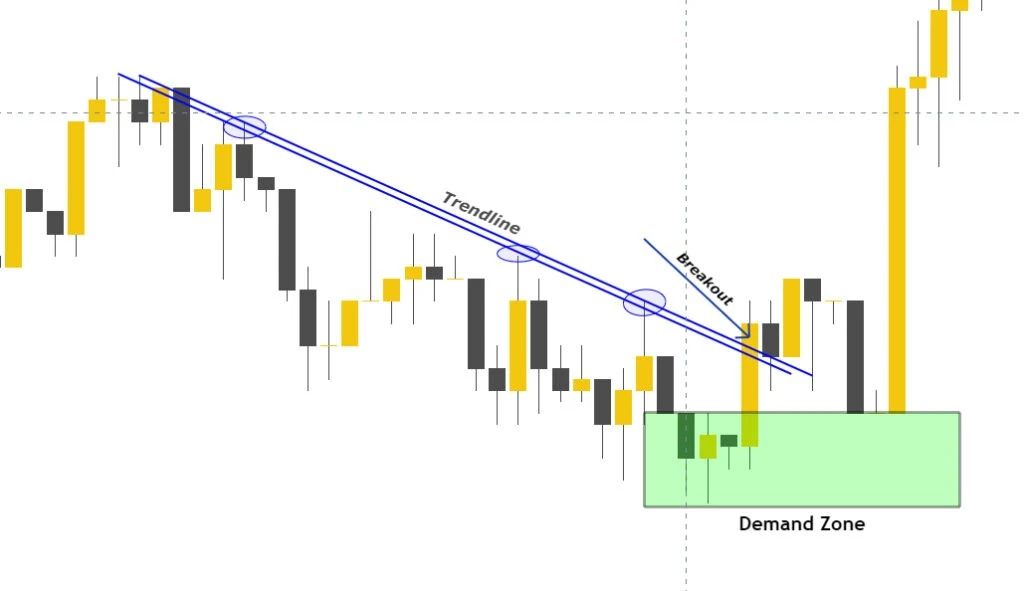
There are many strategies to tackle with this like if you are trading a simple trend line breakout then after trend line breakout and pull back in the price we will confirm precise entry from a demand or supply zone with a tight stop loss and high risk-reward ratio.
Key Point to Remember:
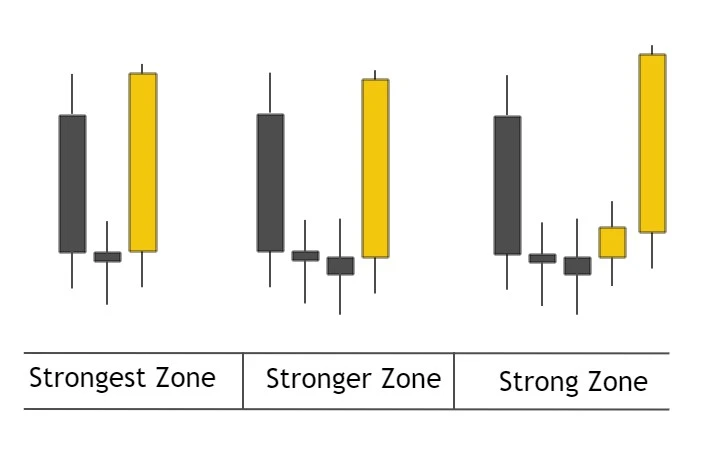
The number of Base candles indicates the strength of the zone. More base candles more weak a zone will be. On the other hand, the fewer number of base candles more strong the zone will be. I will show you in chat how to draw zone and some other examples in a single chart.
Unlimited zones
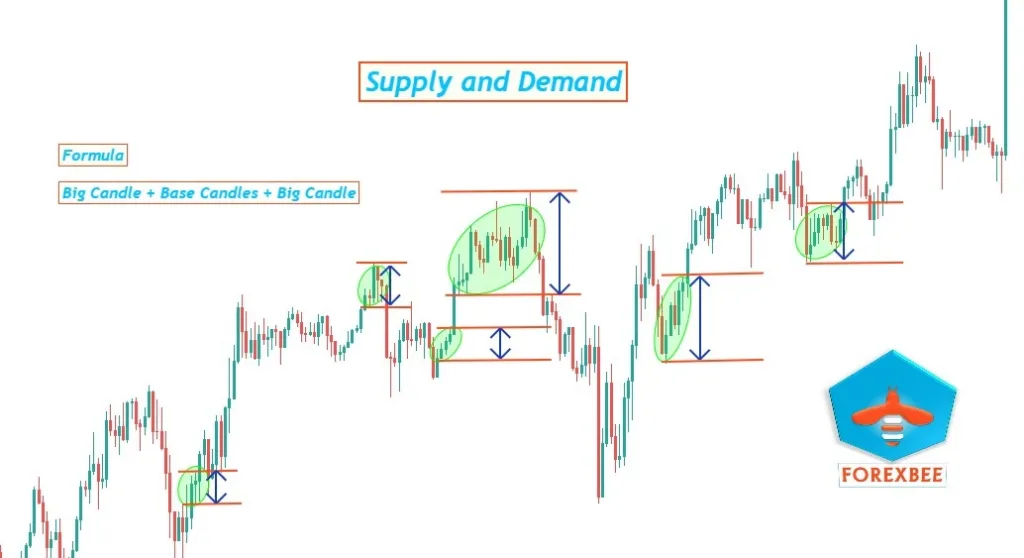
Now I will explain How the supply and demand zone is everywhere in the chart just you need the right angle to see the chart like a pro. A pro trader never changes timeframes again and again. A pro trader can analyze all the timeframes just from a single timeframe. Now Let me show you a chart.
All in one image
Watch the video below about supply and demand forex
Supply and Demand Cheat Sheet
The cheat sheet includes a comprehensive guide to identify and draw supply and demand zones. Everything has been explained about RBR, DBD, DBR, and RBD.
SnD Trading Strategy with Price Action
The supply and demand zones in forex are used for the exact entry point with a tight stop loss. Price moves from one zone to another zone. I don’t use supply and demand to find take profit level. Here I will explain a simple trend line breakout system with supply and demand zone. This is just to show you how it will work. Any strategy with the supply and demand zone technique will improve your method a lot.
The supply and Demand trading method is purely based on price action.
Trend line method with S&D
There is a good trendline drawn in the image below. After the breakout of the trend line, the price gave a pullback to the demand zone to fill the unfilled orders and start a new impulsive move. Big moves show the direction of market makers and big banks.
The Stop-loss level is just below the demand zone and entry in on the high of demand zone. It is a high-risk-reward setup shown to you for clarification of supply and demand zone trading.
Key Points of Supply Demand Trading
Four things to remember while looking for a supply or demand zone
- Time spent by price in the base zone
- Number of base candles
- Time price took to pull back towards a base zone
- Location of Supply or Demand zone
In Summary
If you want to ask me about the most basic concept of technical analysis, then I will say “supply and demand”. There is always a tug of war between supply and demand in the market. Base zones are the footprints of market makers, When you will try to read the price on the chart, you will see price picking orders from one base zone and then staying for a while on another zone.
I will recommend you to backtest this supply and demand trading method by taking at least 100 samples. This will improve your trading a lot. Without backtesting, you will not be able to learn it properly.
Teach a Parrot the terms ‘Supply and Demand’ and you’ve got an Economist.
Use this Supply and Demand indicator to automate your strategy and save screen time to improve mental psychology.


Good analysis
i thnk you so must sir …..but on the last chart where you draw so much .i did not see where exacty the entry points otherwise its my 1st time you make me understand the s.n.d zones …i thank you so ,much and now i will practise it on chats
Thanks
thankyou
My pleasure
I have been browsing online more than 2 hours today, yet I never found
any interesting article like yours. It’s pretty worth enough for me.
In my opinion, if all site owners and bloggers made good content as you did, the internet will be much more useful than ever before.
Thanks a lot
Many thanks much to the article author for your very utile write-up!
It is type of the truly practical profitable method to improve
the standard of each day investing. I actually have a comparable submit about «night» strategy with binary
signals. I observe that it may also be helpful for beginner investors mainly because they just might make better without stress at nighttime with this
successful strategy.
Glad you found it helpful!
Are you also teaching this?
My spouse and I absolutely love your blog and find nearly all of your post’s to be
what precisely I’m looking for. Do you offer guest writers to write
content for yourself? I wouldn’t mind publishing a post or elaborating on some of the
subjects you write with regards to here. Again, awesome web log!
Thanks a million and i will appreciate. Contact us at info@forexbee.co
Hello There. I found your blog using msn. This is an extremely
well written article. I’ll make sure to bookmark it and come back to read
more of your useful info. Thanks for the post. I
will definitely return.
Greetings! Very helpful advice within this
post! It is the little changes that produce the most important
changes. Many thanks for sharing!
Howdy! Someone in my Myspace group shared this website with us so
I came to take a look. I’m definitely loving the information. I’m
bookmarking and will be tweeting this to my followers!
Wonderful blog and outstanding style and design.
It’s very simple to find out any topic on net as compared to
textbooks, as I found this article at this website.
Thanks
Thanks a million
Thank you
Thanks in favor of sharing such a good idea, post is nice, thats why i have read
it entirely
Do you mind if I quote a few of your posts as long as I provide credit and sources back to your webpage?
My blog is in the exact same niche as yours and my users would genuinely benefit from some of
the information you provide here. Please let me know if this ok with
you. Thank you!
Yes dear, you can use by providing credit to our website.
Thanks
Hi everyone, it’s my first pay a visit at this web page, and piece of writing is truly fruitful designed for me, keep up posting these types of content.
Thanks for every one of your work on this blog. Kate takes pleasure in setting aside time for investigations and it is easy to understand why. My partner and i hear all relating to the powerful means you render priceless things on the web site and as well cause response from the others on that issue while our simple princess is truly starting to learn so much. Take advantage of the remaining portion of the new year. You are always carrying out a glorious job.
Thank you
Hi there, of course this piece of writing is in fact fastidious and I have learned lot
of things from it on the topic of blogging. thanks.
The content is very easy to understand, I like your blog. I was convinced about all your strategy when I saw your trading results, good work!
Amazing. Good analysis..!
Hi What do you mean here sir especially the last statement where you said i am not talking about swing or long term trading?
During drawing a base zone in forex supply and demand trading, remember to not go far back in history for finding a base zone because it’s common sense that institutions will not be going to hold their trades for years or months during intraday trading. I’m not talking about swing or long-term trading here.
Hi . i find it difficult to download your supply and demand ebook.
Excited
hello. great website and content. can you please post a few complete examples with entry and exit of trade.
thank you
hello. great website and content. thank you for explaining snd. please post several complete examples with entry and exits: 2-3 supply and 2-3 demand…
————–
for which platform are your indicators: mt4 , mt5?
thank you
i lack words to appreciate your educative message. thank you good mentor.