
The XABCD pattern is a simple yet powerful way to spot where the market might head next. It’s made up of five waves, and the last wave is where we aim to make a profit. I’ve found this pattern really helpful and profitable in my trading.
In this article, I’ll take you through the XABCD pattern step by step. We’ll look at what each part means and how it can help you make better trading decisions. If you’re looking for a straightforward way to understand market trends, you’re in the right place. So, keep reading to get all the details on how to use the XABCD pattern to spot good trading opportunities.
What is the XABCD Pattern?
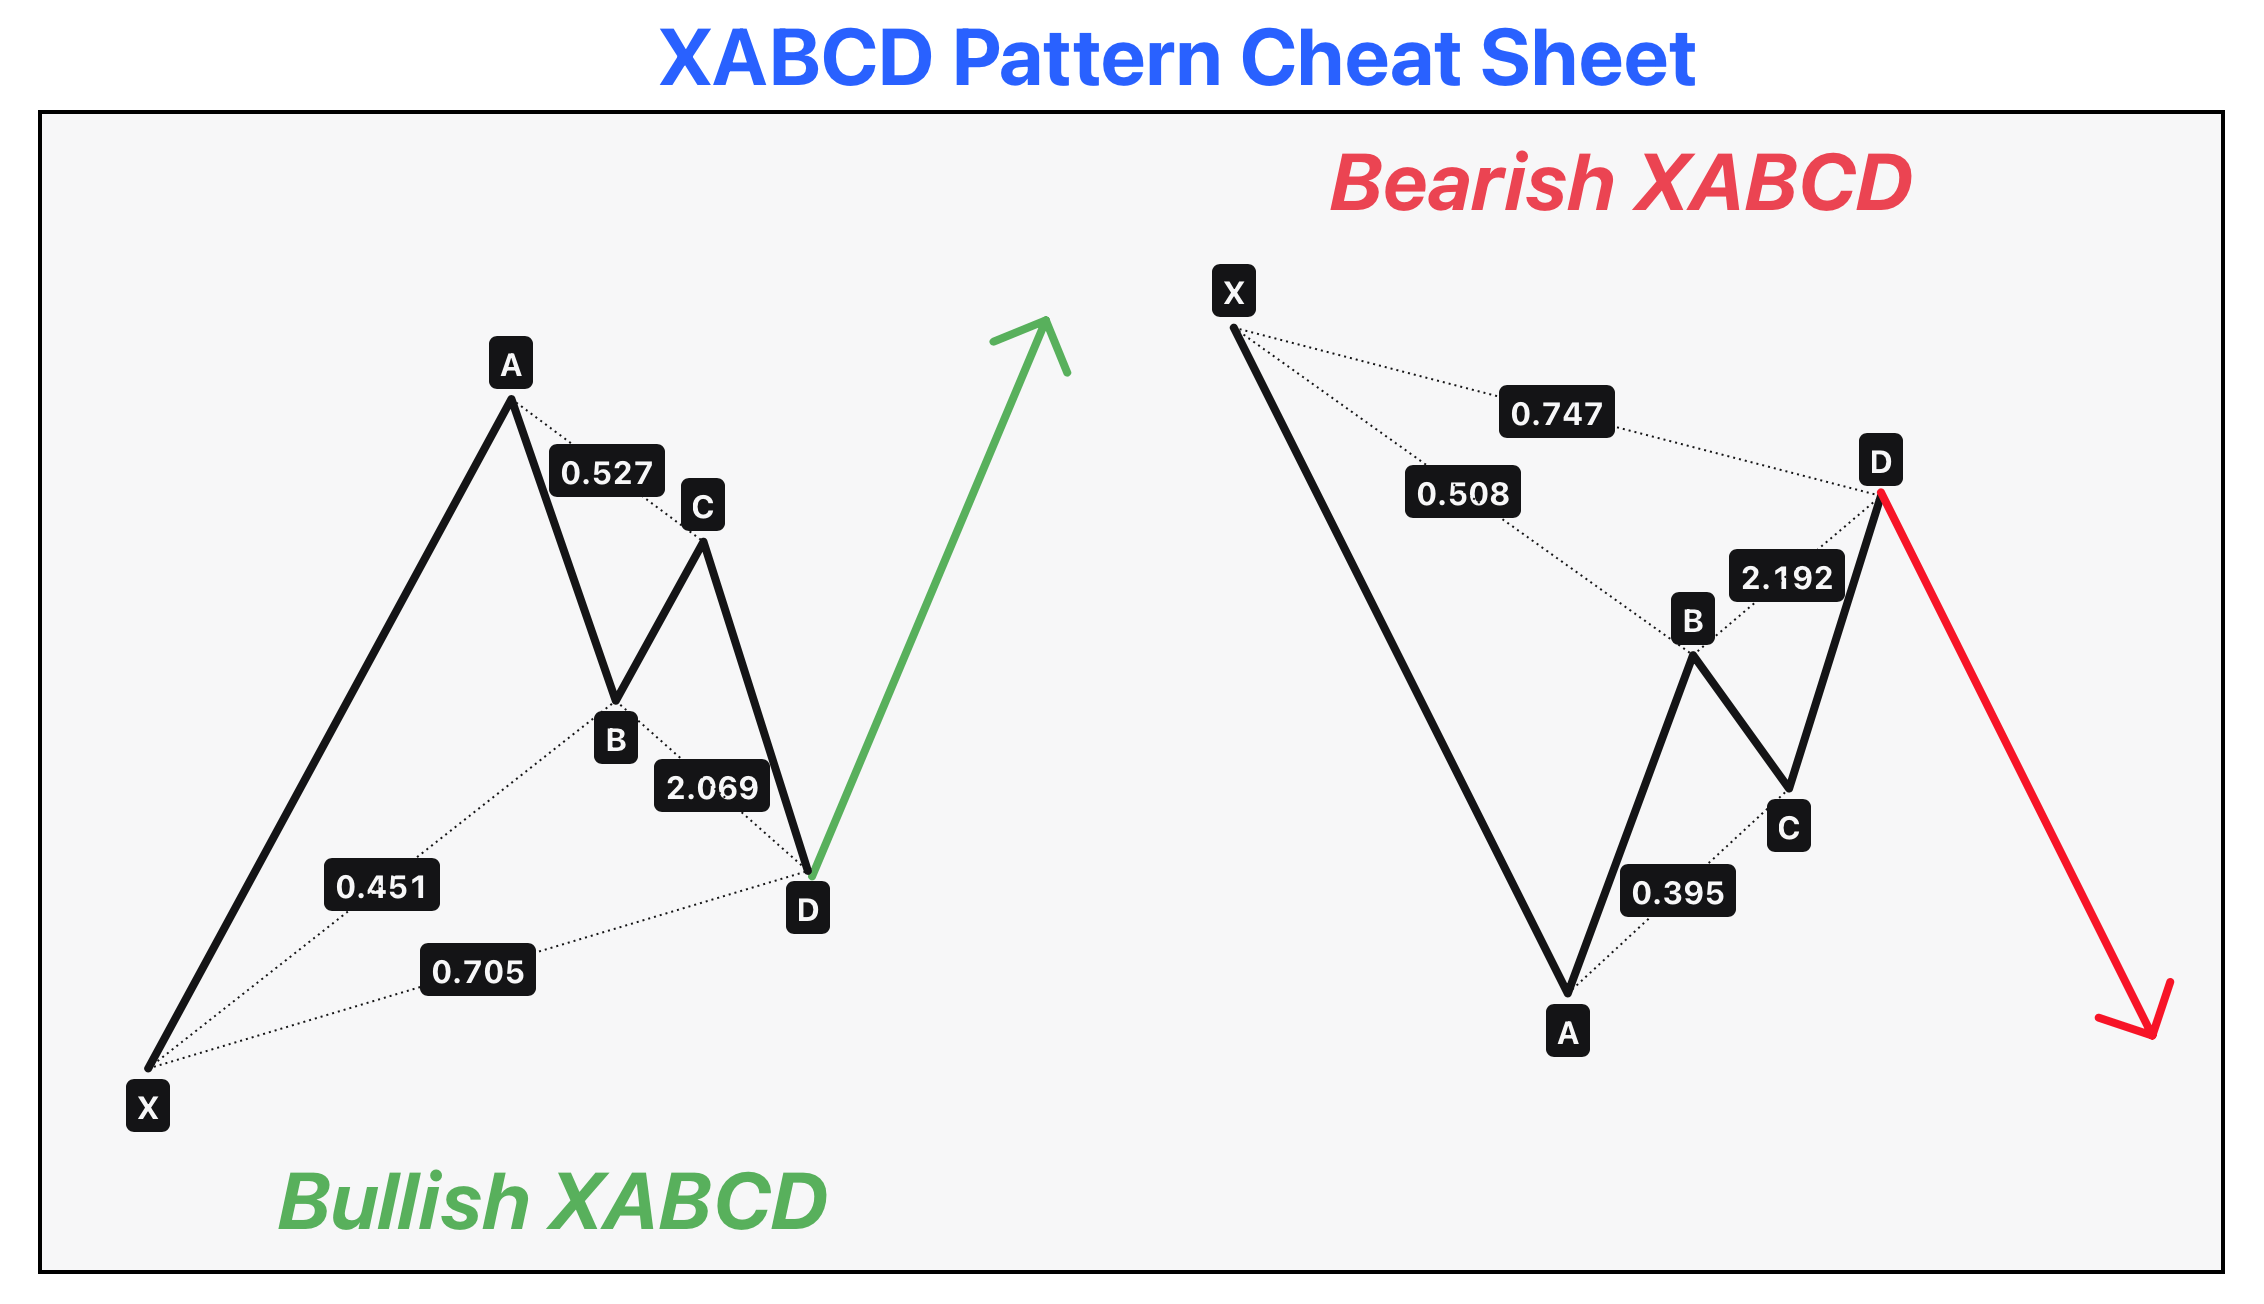
The XABCD pattern in trading is a chart pattern that consist of five points: X, A, B, C, and D, combining an initial strong wave (XA) and a follow-up corrective wave (ABCD), hinting at a trend’s continuation.
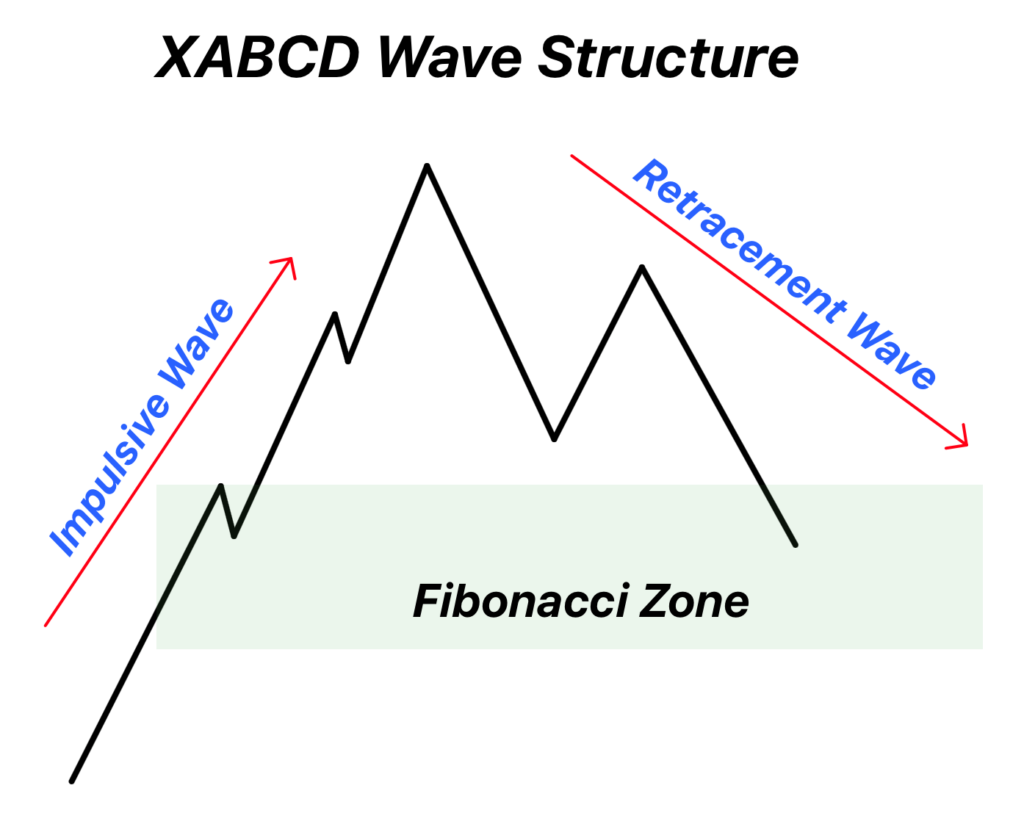
These points make two big parts: the XA wave, which is a strong move showing the trend’s direction, and the ABCD wave, which is a retracement or a slight step back.
Pattern Details:
- XA Wave: This is the beginning part where the price starts moving, showing us the trend’s direction.
- ABCD Wave: This comes after XA and is a retracement wave, where the price adjusts a bit.
The ABCD part on smaller timeframes splits into three waves: AB, BC, and CD. Watching for the pattern to complete, we look for the next big XA-like move to enter a trade.
How to Identify the XABCD Pattern
Identifying the XABCD pattern involves recognizing the sequence of moves and retracements in the market that match the pattern’s structure. Here’s what to look for:
- Start with the XA Wave: Spot the initial strong move that sets the trend’s direction. This could be a sharp rise or fall on the chart.
- Look for the AB Retracement: After the XA wave, there should be a noticeable pullback. This is the AB wave, where the price retraces part of the XA move.
- Find the BC Move: Next, the price should make a smaller move in the same direction as the XA wave, forming the BC segment.
- Check the CD Retracement: Finally, there’s another retracement, the CD wave, which completes the pattern.
Fibonacci Ratios:
The total movement from A to D in the ABCD part of the pattern should retrace to a Fibonacci ratio between 50% and 78.6% of the initial XA wave. This means the price pullback from its highest or lowest point in the AB and CD waves falls within these ratios, indicating a strong likelihood that the pattern will follow through with a trend continuation.
By keeping an eye on these steps and the specific Fibonacci retracement levels, you can confidently identify the XABCD pattern.
Characteristics of XA and ABCD wave
Both waves have separate importance in trading. a trader should identify the nature of XABCD chart pattern to trade effectively.
Here are few characteristics of each wave that you should keep in mind.
| XA Wave | ABCD Wave |
|---|---|
| Sets the initial trend direction and indicates the market’s momentum. | Reflects the market’s corrective action and potential for trend continuation or reversal. |
| The size and force of the XA wave suggest the pattern’s potential impact and reliability. | The depth of the ABCD retracement provides insights into the strength of the underlying trend. Deeper retracements might indicate a weaker trend, while shallower ones suggest a stronger trend. |
| Serves as a baseline for Fibonacci retracement and extension levels, guiding future wave predictions. | The alignment of retracement levels with Fibonacci ratios aids in pinpointing precise trading entries and exits. |
How to trade the XABCD pattern?
Aligning trading strategies with the prevailing market trend significantly increases the winning ratio. The XABCD pattern is particularly effective because it naturally forms within ongoing trends, making it a reliable indicator for trend continuation trades.
Here is the criteria for both buy and sell trades to trade with XABCD pattern.
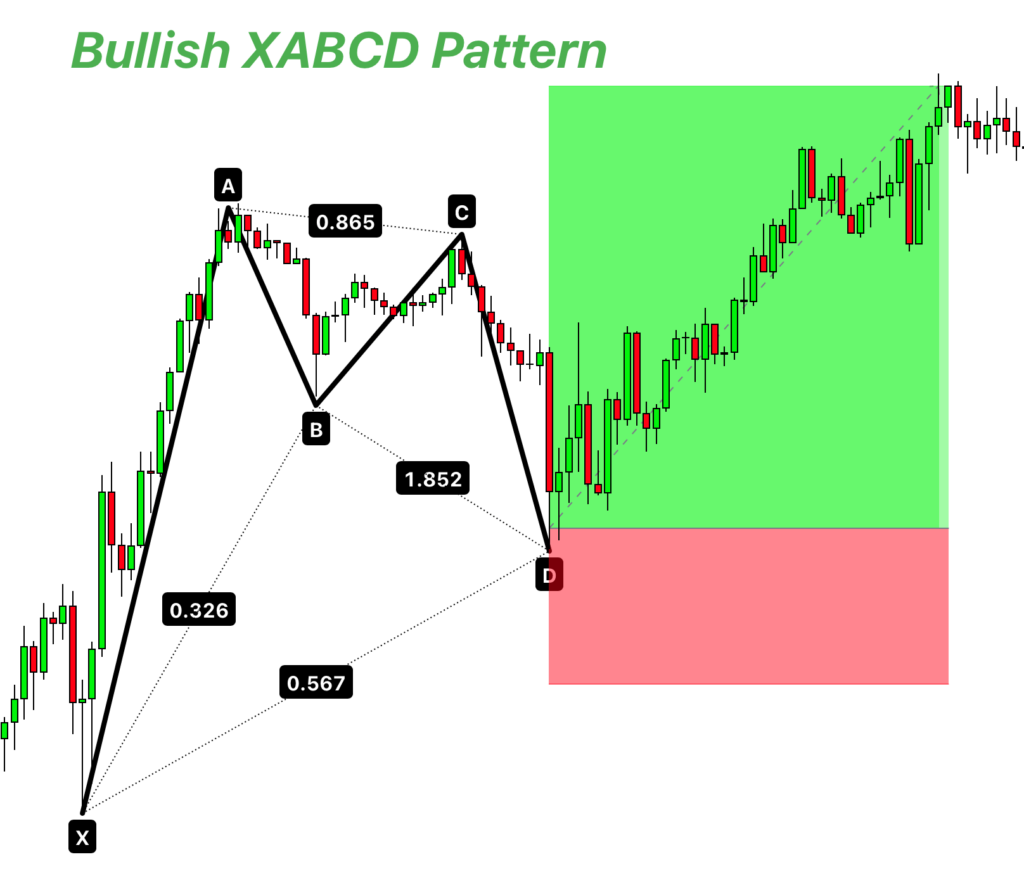
For Buy Trades:
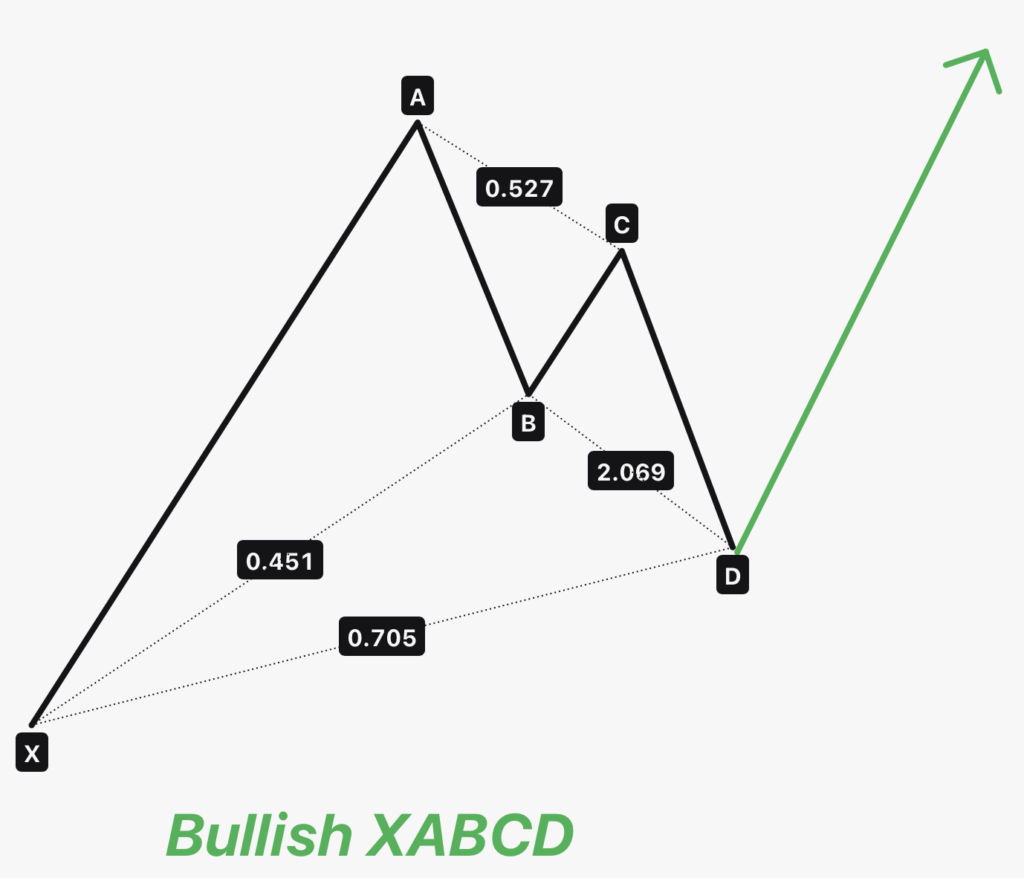
- Identify Bullish Trend: Look for higher highs and higher lows, indicating upward momentum.
- Confirm Pattern: Ensure X is at a higher low, A at a higher high, and D at a subsequent higher low, all in trend direction.
- Entry Point: Initiate a buy trade at D, where the pattern suggests the upward trend will persist.
- Stop Loss: Place stop loss below the swing low or the 78% Fibonacci level from D to X for protection.
- Take Profit: Aim for point A as the first take profit level, with a secondary target at the 121% Fibonacci extension.
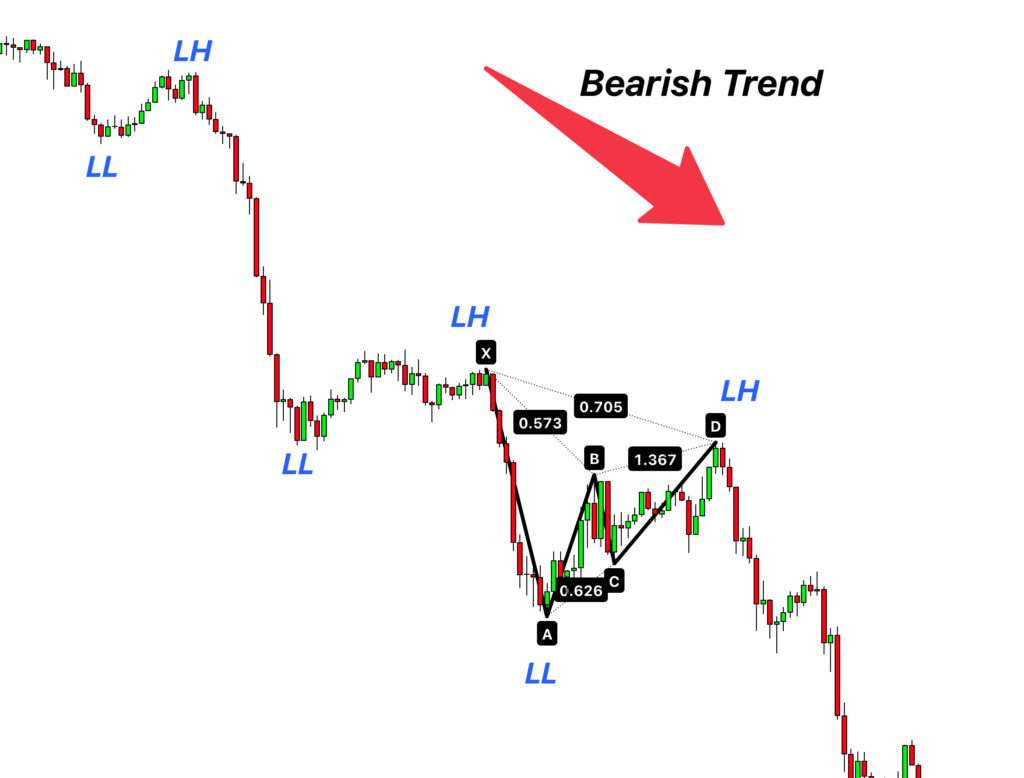
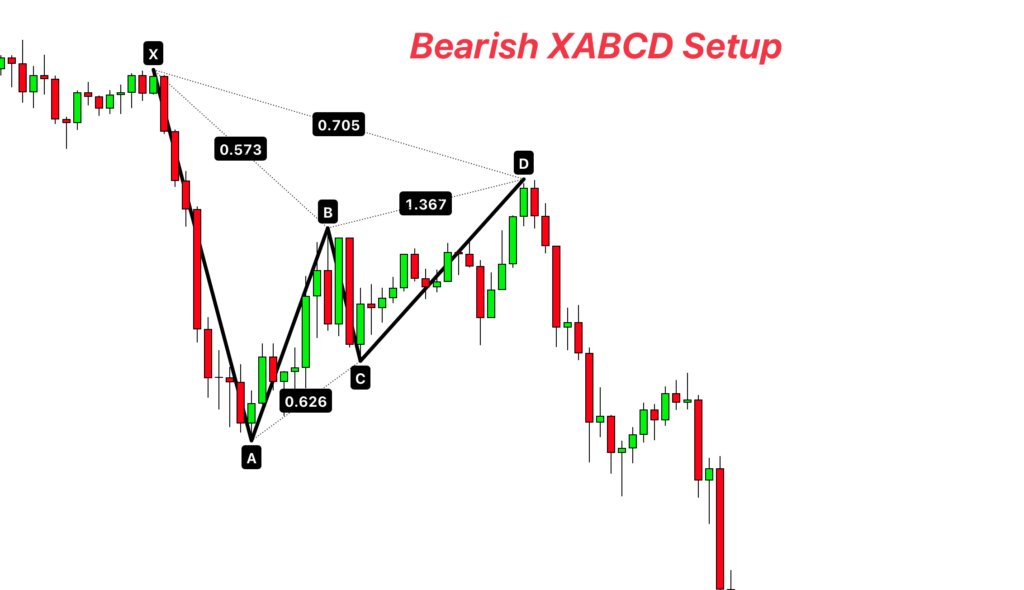
For Sell Trades:
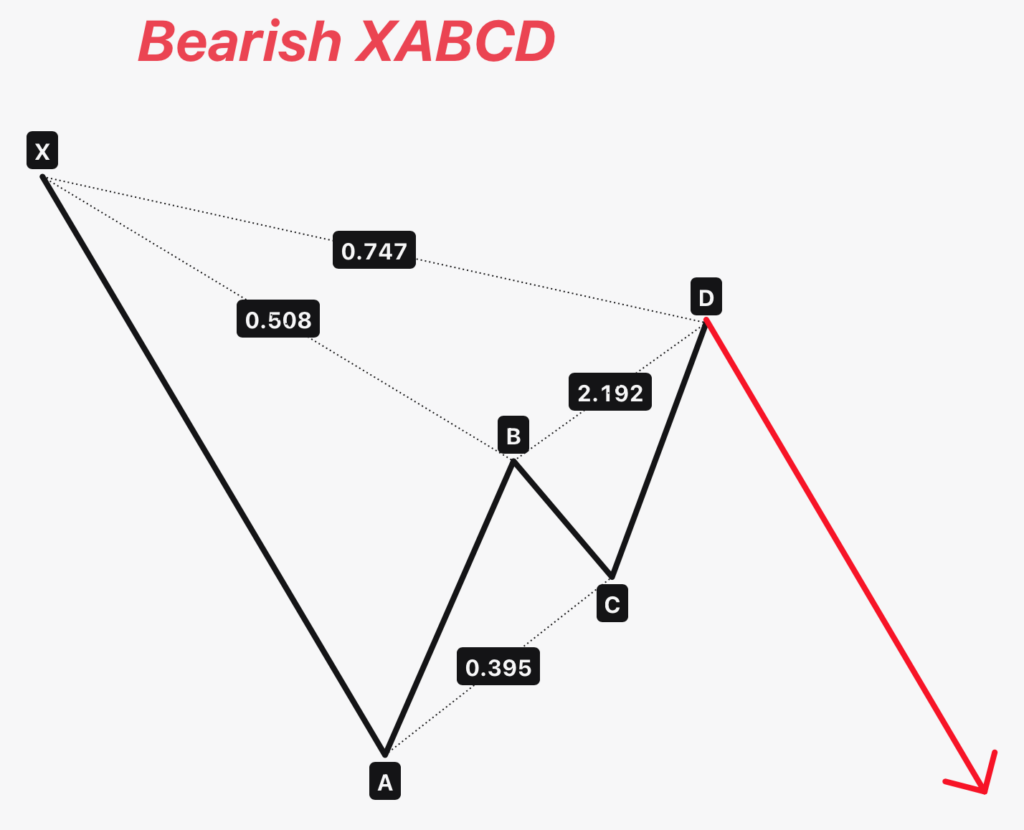
- Identify Bearish Trend: Spot lower highs and lower lows, signaling a downward trend.
- Confirm Pattern: X should be a lower high, A a lower low, and D another lower high, consistent with the bearish trend.
- Entry Point: Enter a sell trade at D, anticipating the trend’s continuation downwards.
- Stop Loss: Set stop loss above the swing high or the 78% Fibonacci level from D to X for safety.
- Take Profit: Point A is the initial take profit target, extending to the 121% Fibonacci extension for further gains.
ABCD Wave Variations
The XABCD pattern starts with a strong XA wave, showing a clear direction. But when we look at the ABCD retracement wave on smaller timeframes, we see some variations:
Common Variations:
- Equal Lengths: Sometimes, the AB and CD waves are about the same length, making the retracement look symmetrical.
- Small CD wave: Other times, the AB wave is longer, and the CD wave is shorter, leading to an asymmetrical look in the retracement phase.
Variations to Avoid:
- Double Top BC Wave: If the BC wave goes all the way up to match the high of point A, forming a double top, it’s usually not a good sign. This pattern might not follow through as expected.
- Impulsive CD Wave: If the AB wave is short but the CD wave is really long, almost like the initial XA impulsive wave, it’s a red flag. This kind of disproportionate movement suggests the pattern might not be reliable.
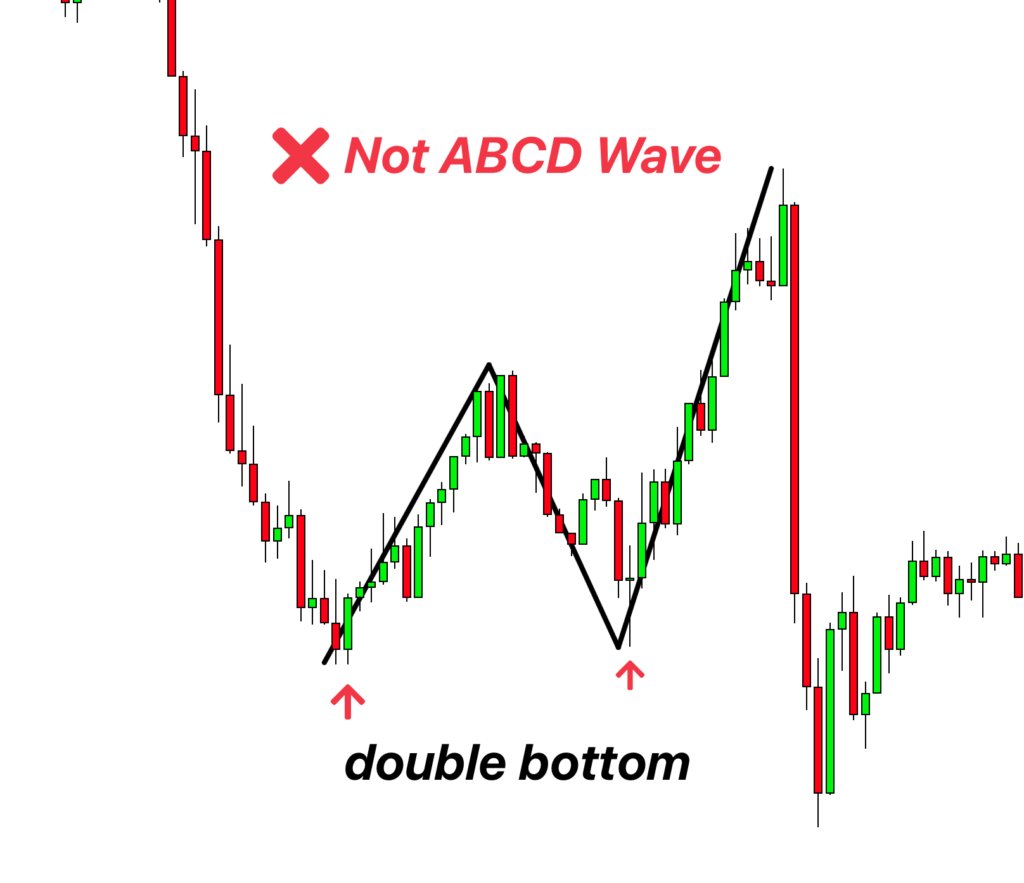
Being aware of these variations can help you make better decisions.
Conclusion
The XABCD pattern is a chart pattern that lines up with the trend, helping you trade in the same direction as the big players like institutions and banks. Remember, “trend is your friend,” and by using the XABCD pattern, you’re essentially moving with the market’s flow.
When analyzing the ABCD retracement waves, clarity and symmetry are your allies. Be cautious of patterns that seem off-balance or show extreme deviations, as they may not be as reliable.