

What is SMI Ergodic Indicator?
SMI Ergodic is a technical indicator that is used to predict an upcoming reversal in the price of a currency. SMI means Stochastic Momentum Index. This indicator oscillates around a zero line and continues generating signals based on the crossover.
It is used for buy/sell signals and overbought/oversold conditions on the price chart in technical analysis. By using the true strength index, SMI Ergodic indicator increases the efficiency of buy/sell signals.
How SMI Ergodic works in trading?
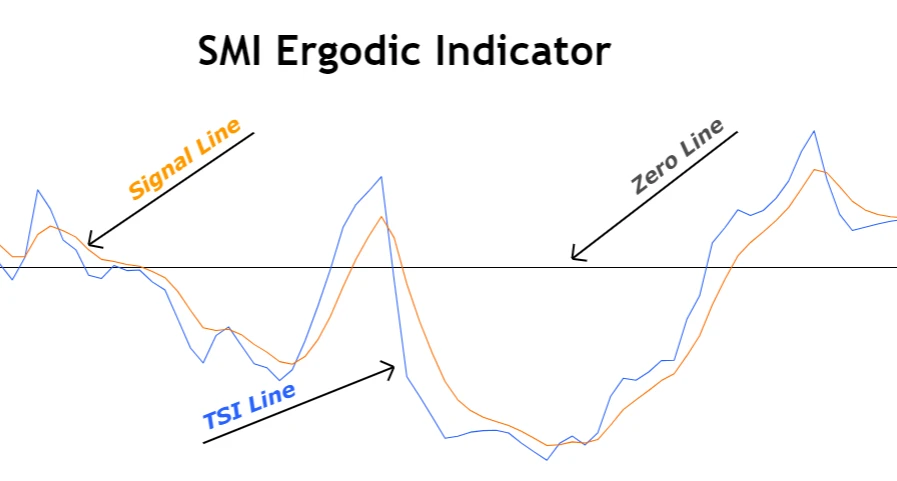
The indicator consists of two lines
- TSI line
- Signal line
TSI line uses true strength index formula and signal line uses exponential moving average. TSI represents the strength of an asset or a currency and exponential moving average is used to identify the average price value based on historic values.
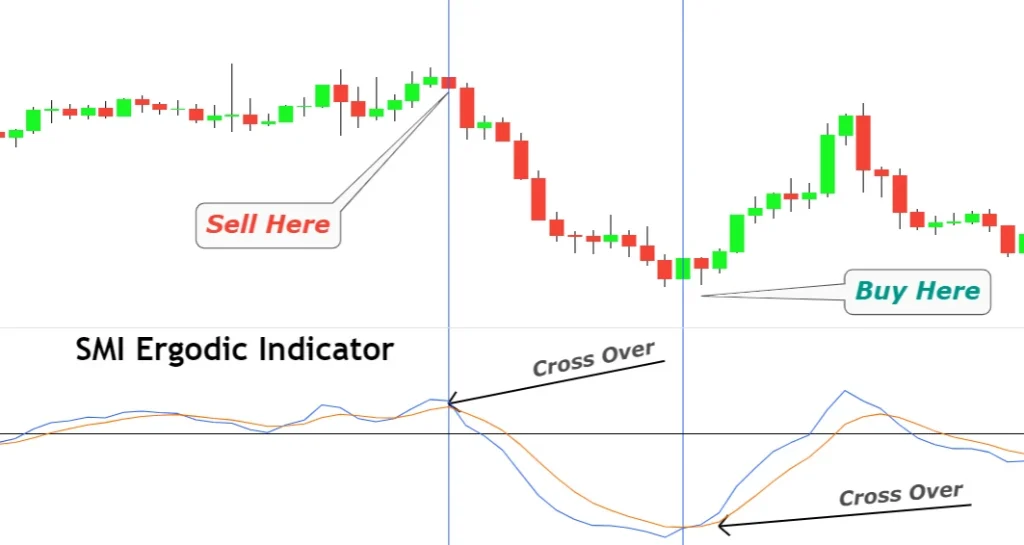
Working of Ergodic indicator is based on the conditions of crossover of the signal line and TSI line
Buy Signal
SMI Ergodic indicator shows a buy signal when the TSI line crosses the signal line below the zero line. The currency or an index will remain bullish until another opposite crossover of the signal line and TSI line.
Sell Signal
SMI Ergodic indicator indicates a sell signal when the signal line crosses the TSI line above the zero line. It shows a bearish trend until another opposite crossover of TSI and signal line.
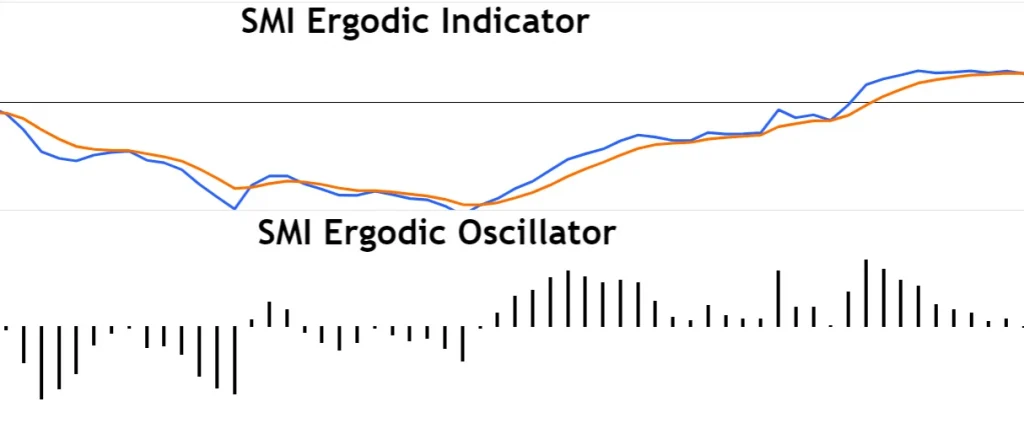
How to use Ergodic Oscillator?
The main feature of the Ergodic Oscillator is that it shows the difference between the TSI line and Signal line by drawing a histogram on the price chart.
Ergodic Oscillator = True strength index value – Exponential moving average value
- If the histogram is above the zero line, then it shows a bullish trend, and you should trade in bullish direction.
- Below the zero line indicates a bearish trend, and you should trade in bearish direction.
SMI Ergodic Indicator Formula
This indicator is made up of two lines and each line has a different formula. This indicator uses the TSI formula so I will explain the TSI formula here.
Ergodic indicator line = True strength index
TSI line formula = (Double smoothed price change / Absolute double smoothed price change) x 100
SMI Indicator Settings
The best settings for SMI Ergodic Indicator are the following
- Long Length = 20
- Short Length = 5
- Signal Line Length = 5
How to trade using SMI Ergodic indicator?
Using a price action pattern with any indicator will increase the probability of winning in a trade. Also, it will help us to filter out bad trade setups generated by indicators.
SMI Ergodic trading strategy will use reversal candlestick patterns to confirm a buy/sell signal. Without a candlestick pattern, you should avoid taking a trade. Candlestick pattern will also help to place a fixed stop loss and to manage the risk-reward ratio of a trade setup.
Without a candlestick confirmation, you will not make a profit because if you don’t know where to place a stop-loss then how can you trade without a stop loss? Obviously, you will lose at the end if you are trading without stop loss.
Open a trade
Open a buy trade if the following conditions are meeting
- TSI and Signal line both are below the zero-reference line
- Bullish crossover of TSI line and signal line
- Wait for a bullish candlestick pattern
If you did not get a candlestick pattern before crossing zero lines by signal line, then you should skip this setup and look for other setups.
On the opposite side, open a sell trade if the following conditions are meeting on the candlestick chart.
- Both lines are above the zero-reference line
- Bearish crossover between two lines
- Wait for bearish candlestick pattern
Place a stop loss
You should place stop-loss a few pips above/below the candlestick pattern.
Adjust Take-profit level
You should manage this trade manually and close the opened trade after an opposite crossover.
The Bottom Line
Technical indicators alert many false signals because of the high frequency of signals but you can filter out the best setups from the crowd by using price action strategies.
SMI Ergodic is a profitable indicator if used with proper strategies.
You should not trade on a live account until proper backtesting of this trade setup to get fruitful results.