
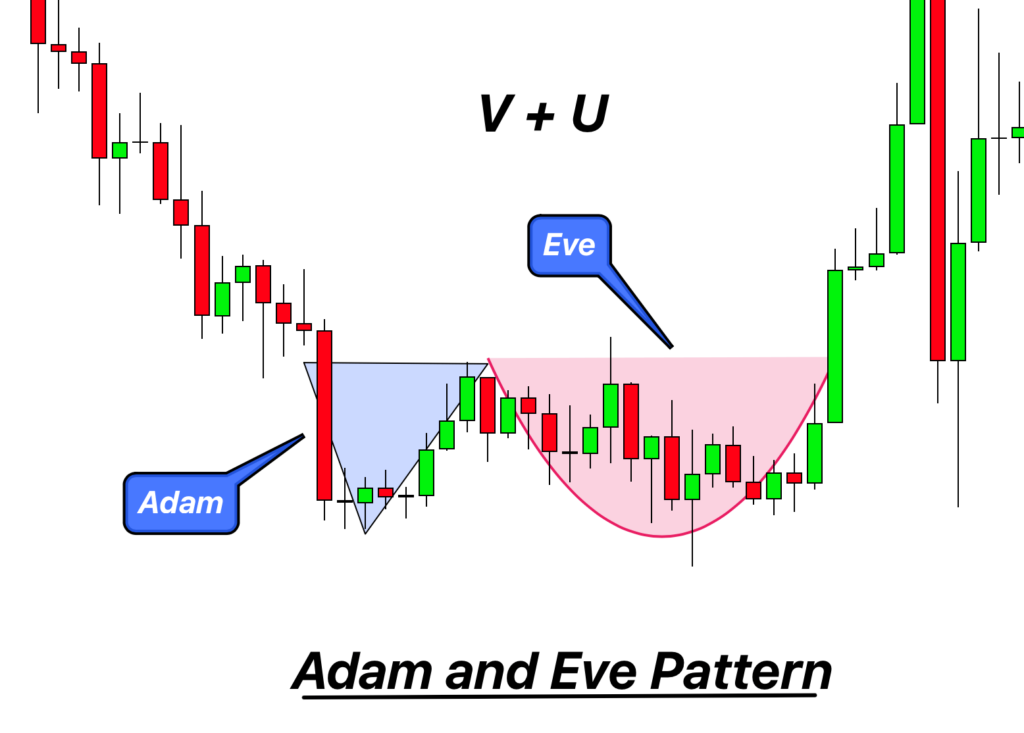
Adam and Eve is a rare bullish/bearish reversal double bottom/Top chart pattern that is a combination of V and U shape price patterns. It is a high success ratio chart pattern that is a variation of the usual double top/bottom chart pattern. Because of the high degree of resemblance to the typical double bottom/top chart pattern. This pattern is also known as Adam and Eve double Top/bottom chart pattern.
This chart pattern works more accurately in high-volume trades. The founder of this pattern is Bulkowski, who writes about this pattern in his famous book “Encyclopedia of Chart Patterns.”
This is a very rare chart pattern, and not many traders know about it. I will explain this chart pattern from alpha to Omega so that you can understand and utilize this wildcard in your trading.
Components of Adam and Eve Patten
Unlike the traditional double top/bottom chart pattern, the Adam and Eve pattern shows a slight variation. A traditional double top/bottom resembles a “W” or “M” shape. On the other hand, an Adam and Eve is neither a fine W nor an M; its shape has little variation.
There are two basic components of this rare chart pattern.
- Adam
- Eve
Adam
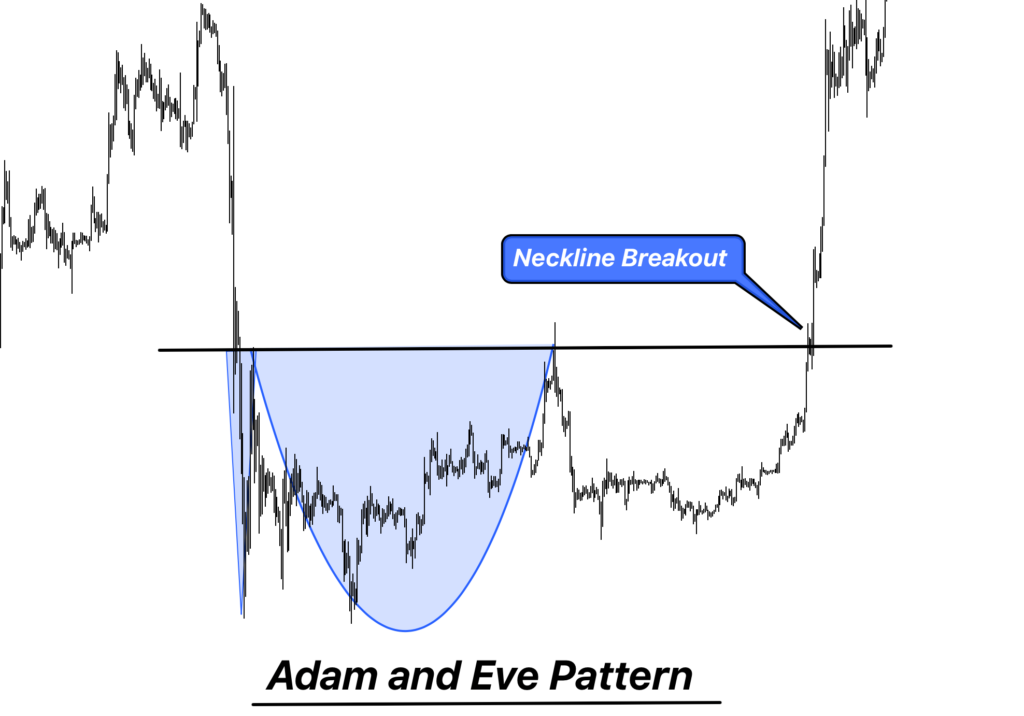
An Adam is the first part of the pattern. In the case of a double bottom pattern and Adam resembles a “V” shape. A V shape means the pattern begins at a higher point, and then the price drops to find a lower point. The lower point of the “V” is the lower price of the assets. After touching the lower point of the “V,” the prices again begin to rise. Once the price is equal to the first higher point in the “V,” the shape of Adam is clear.
Eve
The second component of this chart pattern is Eve. Eve is a “U” shape structure. The prices dip and slightly rise in a U shape to rise again.
A double-top Adam and Eve is an inverted form of the double-bottom chart pattern.
Types of Adam and Eve chart pattern
There are two types of Adam and Eve chart patterns.
1. Bearish Adam and Eve chart pattern
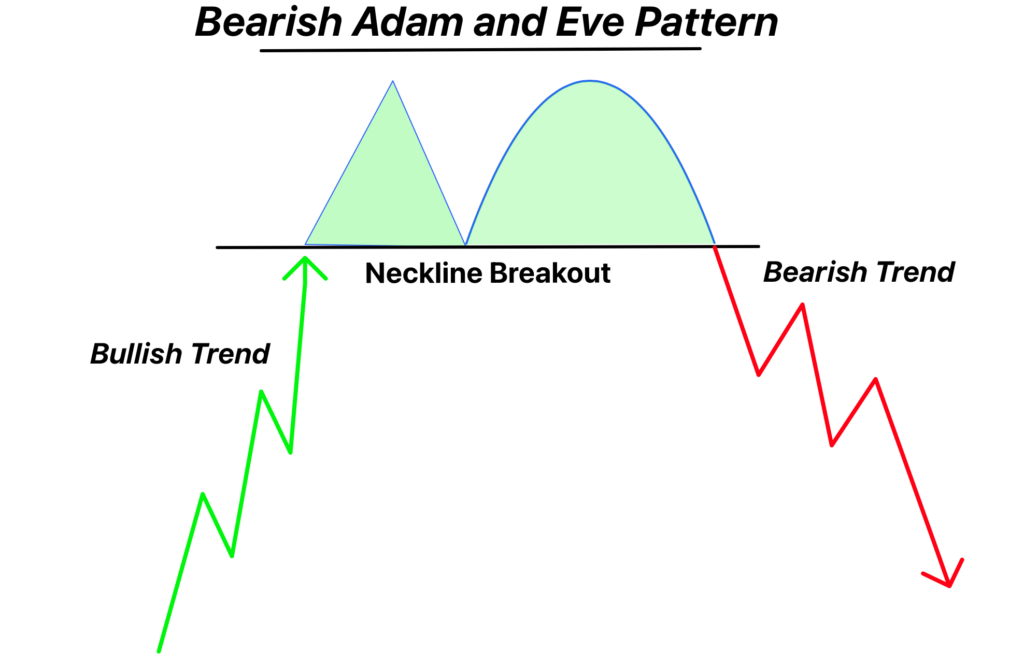
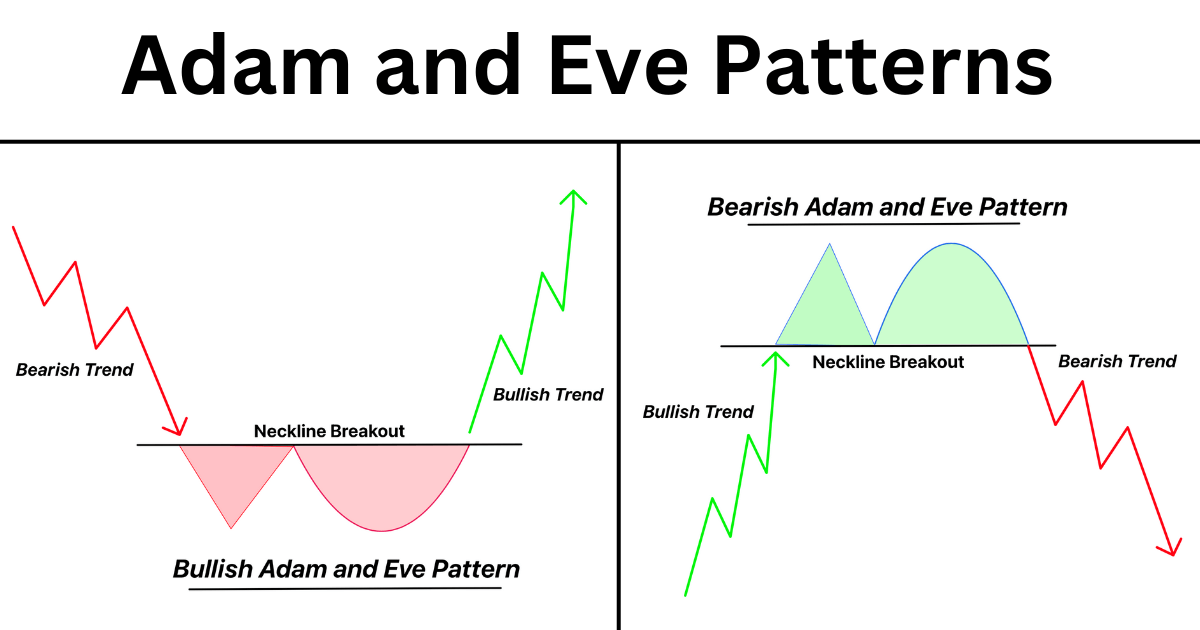
It s a bearish reversal pattern composed of an inverted V and U. The adam resembles the inverted V with a peak. The eve is an inverted U shape structure.
This pattern indicates that the market is about to take a bearish reversal where the bulls will begin to lose power. The number of sellers will dominate the market.
The Adam resembles ᐱ and the Eve resembles ᑎ. The overall look of the pattern resembles ᐱᑎ instead of M in the case of a typical double-top chart pattern.
The market takes a bearish break out once the double-top Adam and Eve pattern is confirmed.
2. Bullish Adam and Eve chart pattern
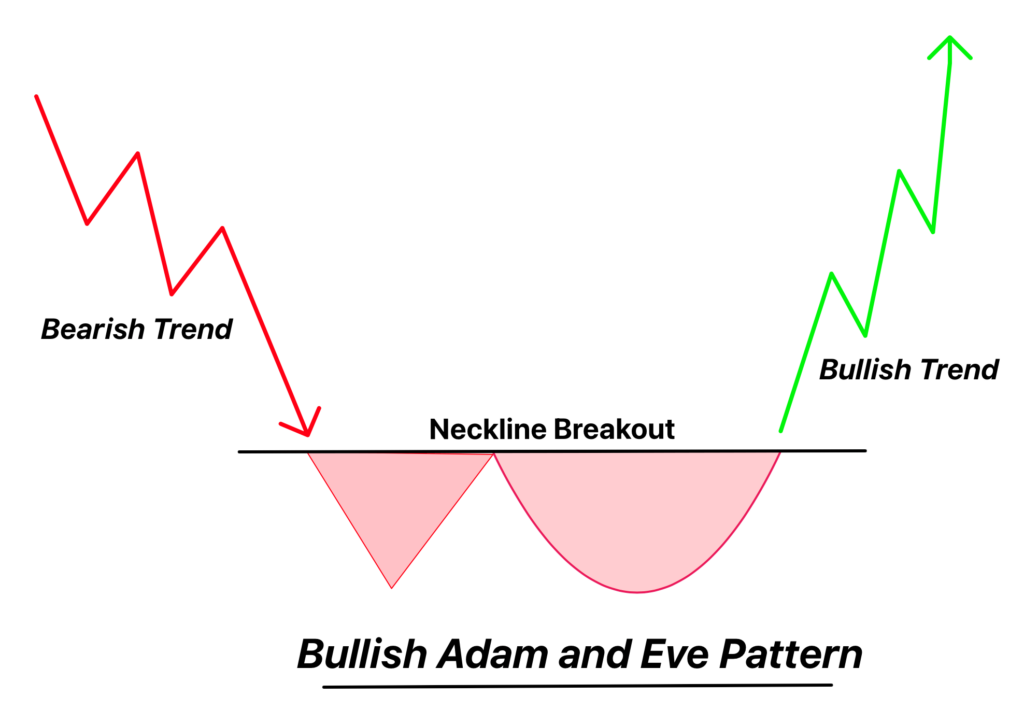
This chart shows a little variation from the typical double bottom chart pattern, which resembles the “W” shape. Instead of a typical W shape, this pattern resembles a “VU” shape. Adam is a “V” shape, and Eve is a “U” shape. This bullish reversal pattern indicates the bulls will take control of the market. As this pattern appears, the bears begin to lose their power, and the market’s bullish sentiment begins to take control. Later in this pattern, a bullish breakout usually takes place.
Comparison of bullish and bearish Adam eve pattern
The comparison between the two variations of the Adam and Eve pattern is as follows.
| Features | Adam and Eve Double top pattern | Adam and Eve Double bottom pattern |
| Shape of the Adam | ᐱ | V |
| Shape of the Eve | ᑎ | U |
| The shape of the pattern | ᐱᑎ | VU |
| nature | Bearish reversal | Bullish reversal |
| Prior trend | bullish | bearish |
| forecast | Bearish breakout | Bullish breakout |
How to trade the Adam and Eve Pattern?
The Adam and Eve is a rare yet very effective chart pattern. Once you confirm this chart pattern, you can form a significant trading strategy around this chart pattern. I will split the trading strategy for this chart pattern into three steps.
Entry and Exit
In the case of a double-bottom Adam and Eve chart pattern, draw a trend line that crosses the right upper point of the V shape of Adam and crosses all the way to Eve. Open the buy trade when the price breaks the trend line in the bullish direction. The same phenomenon applies to the double-top Adam and Eve pattern in the reverse direction.
Risk management
Risk management is a vital step for any trading setup. In this case, place the stop loss below the rounded shape of Eve. In the case of a double top chart pattern, place the stop loss above the round shape of Eve.
Take profit
Close the trade when the price covers a distance equal to the Adam and Eve pattern projection. This is similar to a double top or double bottom pattern.
Success ratio
It is a very high success ratio indicator, just like the traditional double top/bottom chart patterns. If you identify this pattern correctly, the success ratio can exceed 80%. The proper confluence of this chart pattern with other trading indicators can even increase the success ratio by higher than 80%. The RSI and Bollinger bands form a good trading strategy with Adam and Eve’s double top/bottom chart pattern.
Pros
The advantages of using this pattern are as follows.
- This is a very high success ratio chart pattern.
- It is easy to form a confluence of this pattern with other trading indicators to form a good trading strategy.
- It is very accurate in volume trading.
- It helps in finding an easy entry level.
- It provides a trader with the confidence to continue in the direction of the breakout.
Cons
There are the following disadvantages of this trading indicator.
- The prices can move in the previous direction in 20% of the cases. So, some false signals can impact your trading experience.
- This chart pattern doesn’t give you 100% confidence as it requires the confluence of some other trading indicators.
- This chart pattern struggles in low-volume trading markets.
The bottom line
An Adam and Eve chart pattern is a typical double top/bottom indicator variation. It is a high success ratio indicator. Though this indicator is rare, once you identify it, you can move in the direction of the breakout with a confident frame of mind. The confidence level of a trade even increases more once he finds the confluence of other trading indicators with this high success ratio chart pattern.