

Quasimodo pattern strategy is based on the Quasimodo chart pattern that is formed after the formation of higher highs and lower lows on the price chart of the currency in forex trading.
This article is about advanced Quasimodo trading strategy by using supply and demand methods. Quasimodo pattern has already been explained in the previous article. If you did not read the previous article, then make sure to read the first one before learning this strategy.
Key parameters to trade quasimodo pattern
A trading strategy is not based on a single chart pattern or a single parameter, but it is formed by the addition of many filters and confluences that increase the winning probability of a trade setup. Likewise, the Quasimodo strategy has been made by use of three parameters.
- FTR
- Flag Limit
- Quasimodo pattern
- Balance or Imbalance
- Higher timeframe trend
Make sure to learn FTR, Flag limit and Quasimodo pattern before proceeding further.
Balance & Imbalance in trading
Everything in the universe wants to stay in a balanced state. If one is in an imbalanced state, it will always try to come to a balanced state. This is a universal rule, and it also applies in the market. When the market is in an imbalanced state, it will always try to convert that imbalance into a balanced state.
Balanced state
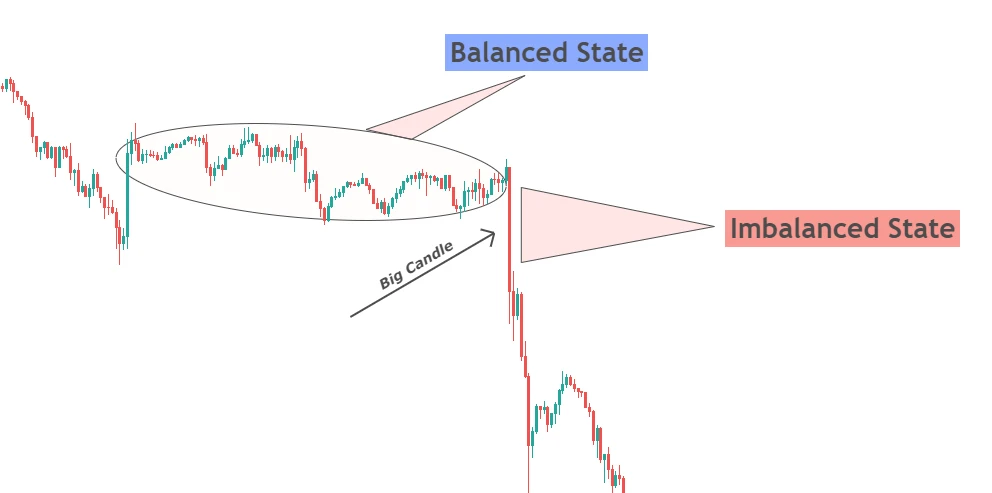
Balance in trading represents the sideways movement of price on the chart. It means the price is in a balanced state. The force of buyers and sellers is almost equal which results in a sideways direction of the price.
Imbalanced state
Imbalance in trading shows the area from where a sudden strong price move occurs. That results in the creation of a gap on the price chart. This gap indicates the imbalance state of a specific security in trading.
Whenever a gap is created on the chart of specific security then, the price will always try to fill that gap. Because it wants to stay in a balanced state.
Tip: A higher timeframe price gap will take more time to be filled as compared to a lower timeframe price gap.
Higher Timeframe trend
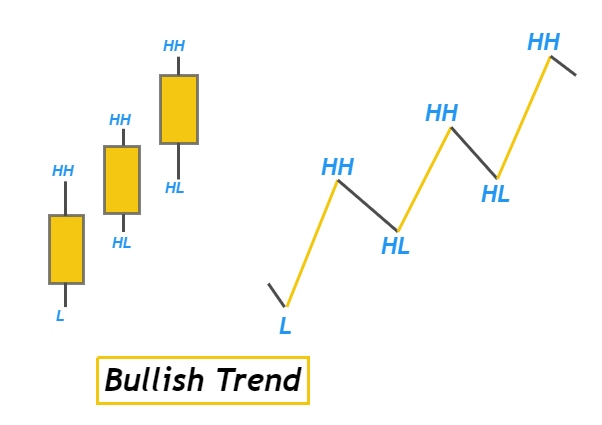
There are many ways to identify higher timeframe trends by analyzing higher highs and lower lows. But a simple strategy is to check the highs and lows of candlesticks on a daily timeframe. For example, if the daily trend is bullish, then you can trade bullish setups on a lower timeframe (H1, M30, M15).
- On daily timeframe, formation of higher highs and higher lows of candlesticks represent bullish trend. Formation of at least two consecutive higher highs and two higher lows is necessary to confirm bullish trend.
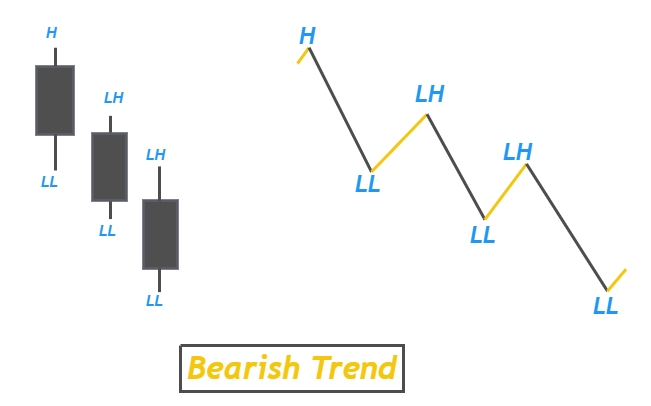
- Two consecutive Lower highs and lower lows on candlestick chart indicates higher timeframe bearish trend.
This higher timeframe strategy is the simplest one. You can use your own strategy or analyze higher timeframe trends in your own way. I just explained to make things simple.
Three phases of Quasimodo Pattern strategy
Quasimodo strategy in trading consists of three phases
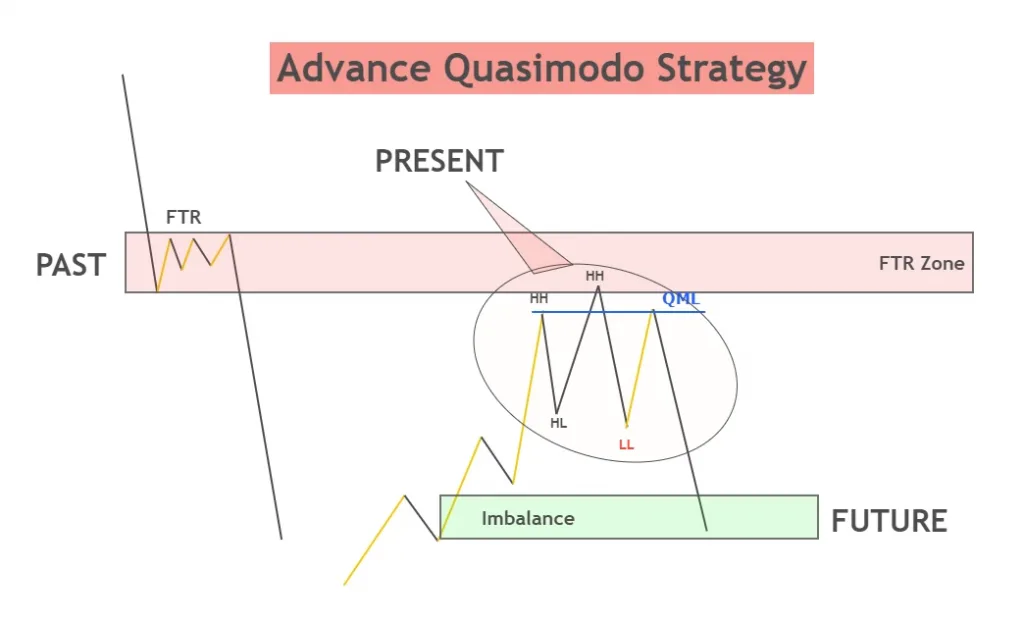
- Identify FTR and flag limit levels (past)
- Behavior of price to those levels in the form of Quasimodo pattern (present)
- How price will fill the gap and will achieve a balanced state (future)
Nature also has made three phases of time past, present, and future. I have tried my best to relate this strategy to nature as much as possible.
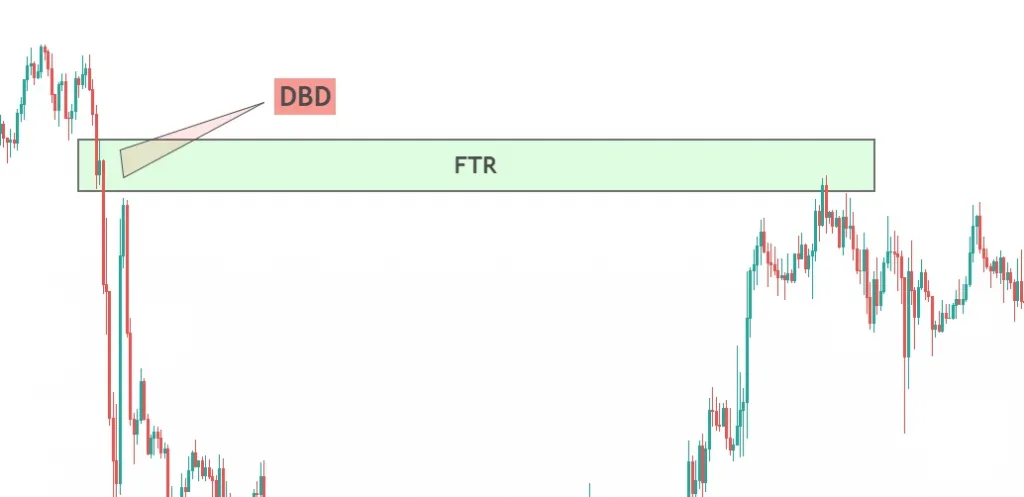
Identify FTR and Flag limit
FTR means fail to return of price and Flag limit means the area where price takes a decision either to continue its trend or reverse (RBR & DBD).
The first step in Quasimodo trading strategy is to look for the FTR zone or Flag limit zone in the past. Mark the high and low of FTR or Flag limit and draw the zone by meeting low & high. Now extend that zone to right.
Remember to draw a zone only at FTR or only at the Flag limit. It depends on the type of level. Either price had formed FTR level in past or Flag limit level in past.
Look at the image below
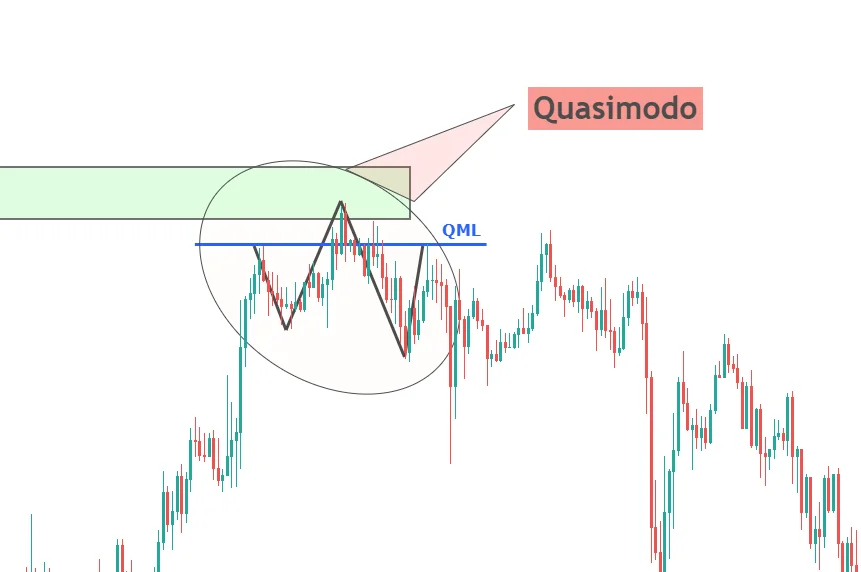
Formation of Quasimodo pattern
Quasimodo pattern in forex is a trend reversal chart pattern and is widely used in technical analysis to predict the upcoming trends in the markets.
The second step is to identify a Quasimodo pattern at FTR or Flag limit zone. Quasimodo at a key level will represent a strong trend reversal from that level.
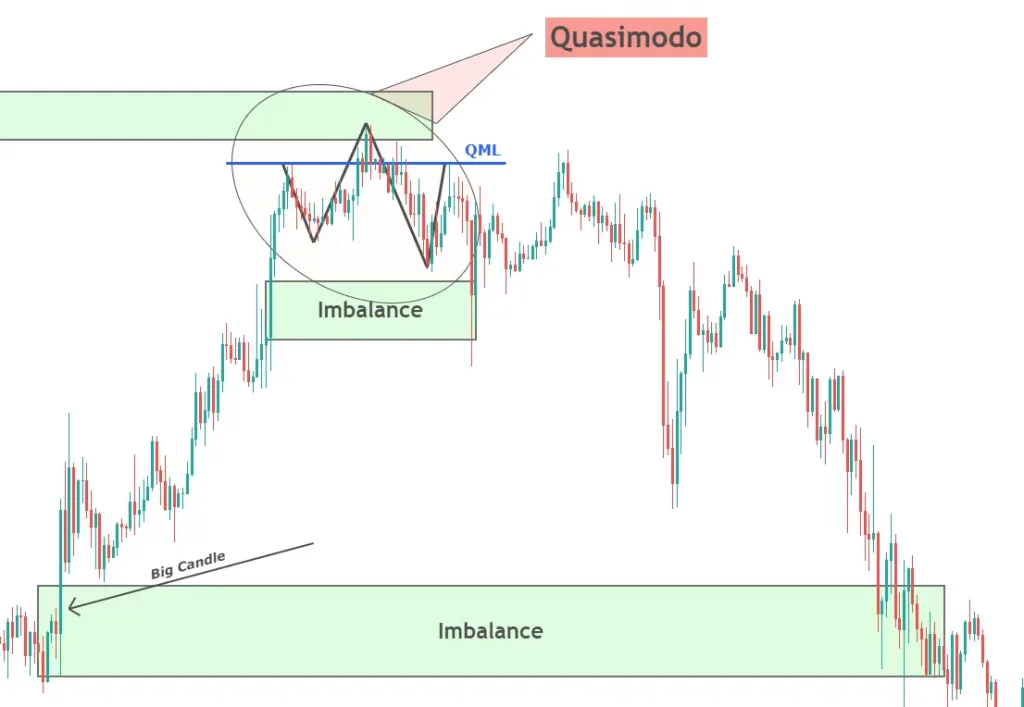
What is the target price of QM?
This is the most important question you must answer yourself before taking any decision. For example, you got a Quasimodo trend reversal pattern at the FTR zone. Now next step is to think about why the price will reverse and start a new trend?
Is there any imbalance in the price chart on the way?
If there is an imbalance on the way, then it is a clear indication that price will come to a balanced state and fill the gap. Target level in trading is as important as a stop loss level. Without a proper target level, you will lose because of psychological issues.
Final Quasimodo Pattern trading strategy
Combine the three phases past, present and future to make a perfect Quasimodo trading strategy in forex. Follow three easy steps in this strategy
- Analyze the past by finding out Zones
- Identify Quasimodo chart pattern at those levels
- Measure the target by finding out the gaps or imbalance states
This is an advanced Quasimodo trading strategy in forex.
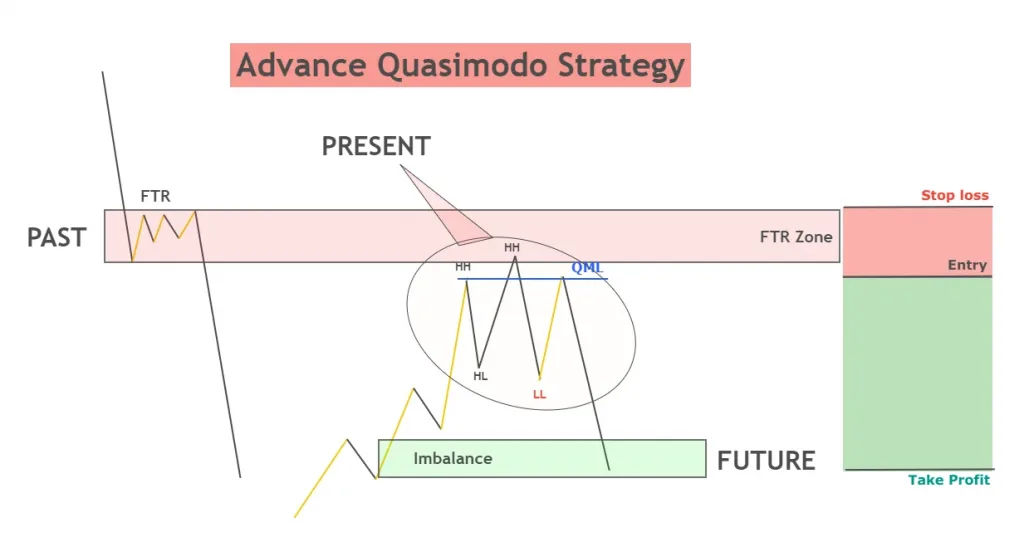
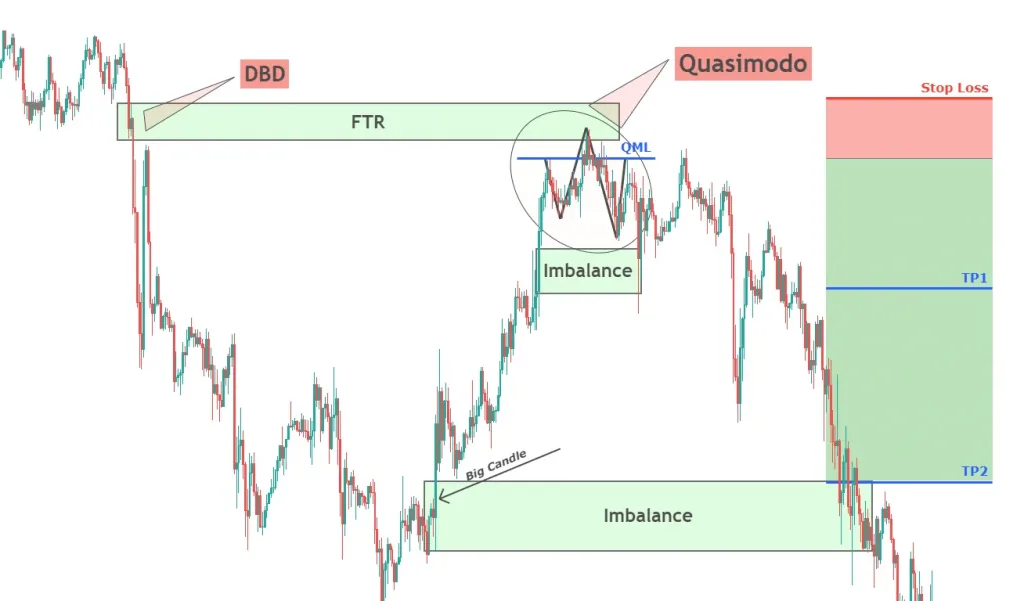
Trade entry
Open a trade on the left shoulder level of the QM pattern. Break-even the trade when price breaks the lower low or higher high of Quasimodo pattern.
Stop loss
Always place a stop loss above the flag limit or FTR zone (in case of bearish pattern) and below the flag limit or FTR zone in case of a bullish pattern.
Take profit
Place take profit level at imbalance states. If there is more than one imbalance state, then split take profit into two and use two take profit levels to get a high risk-reward ratio.
Look at the live chart example in the below picture.
Conclusion
The market is purely natural and only a natural pattern will be able to win in long term. Fixed mathematical patterns will always fail sooner or later. Quasimodo is a natural pattern, and this relates to nature in a lot of ways.
This is an advanced level of trading. You will not be able to profit just after learning this strategy until you will backtest it properly. There is also a proper way of backtesting like taking 100 samples and analyzing those samples to master this strategy.
QM means Quasimodo pattern in forex trading. it is a reversal chart pattern used to do technical analysis in trading.