Introduction
When it comes to trading, there’s a concept that’s really worth understanding: the Fair Value Gap, often referred to as FVG. It may seem a bit tricky at first, but it’s actually quite simple.
In this article, we’re going to explain FVG in simple terms, like we’re talking about a regular, everyday idea. To make it even easier, we’ll compare it to things we see in nature. By the end of this article, you’ll understand what FVG is and how you can use it in your trading. Let’s get into explaining FVG in a way that’s easy for everyone.
Roadmap to understanding the fair value gap
- What is the Fair Value Gap?
- A straightforward definition of FVG and an explanation of ‘fair value’ in trading terms.
- The Importance of FVG in Trading
- Discussing why FVG is significant for traders, its role in predicting market movements, and how it can indicate take profit levels, market direction, and future price predictions.
- How to Identify the Fair Value Gap on a Candlestick Chart
- Explaining the process of identifying FVG on candlestick charts and outlining the different types of FVG.
- How to Draw FVG Zone on the Candlestick Chart
- A guide on how to visually represent FVG zones on a candlestick chart.
- FVG as a Market Magnet
- Elaborating on how FVG acts like a magnet in the market, influencing prices to move towards it and discussing the concept of market balance.
- Natural Analogies to Understand FVG
- Drawing parallels between FVG and natural phenomena to help readers intuitively grasp how FVG works in trading.
- FVG and Price Movement
- Explaining the relationship between FVG creation and subsequent price movement, and the significance of aligning trading setups with FVG.
- FAQs
- Addressing common questions about FVG
- Conclusion
- Summarizing the key points of the article and the importance of FVG in trading.
What is the Fair Value Gap?
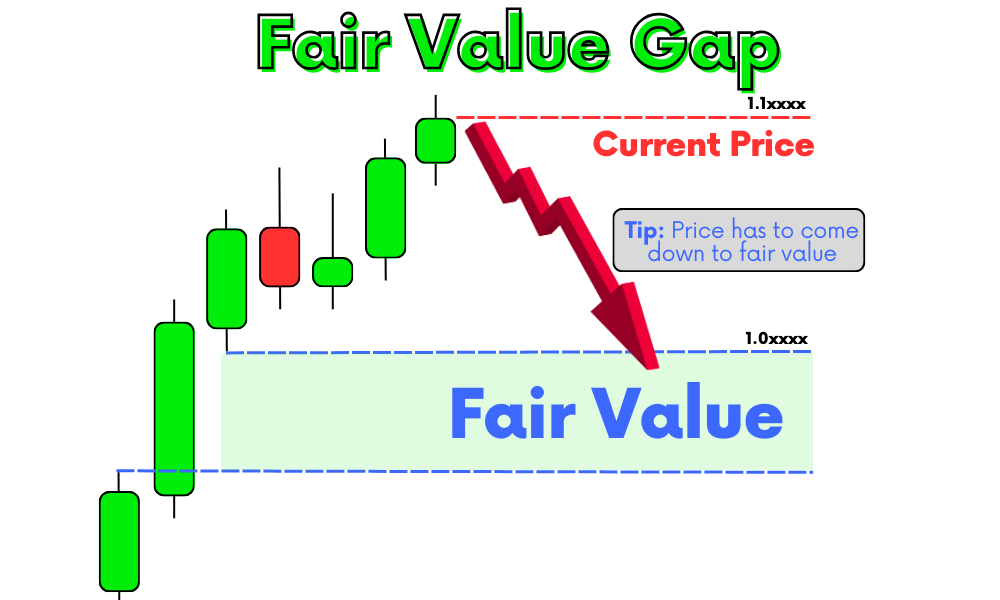
The Fair Value Gap, or FVG, is a term you’ll often hear in trading, and it’s actually pretty straightforward. In simple terms, FVG is all about identifying a gap or a difference in the value of an asset – like a stock or a currency – on a trading chart.
To understand FVG, we first need to grasp what ‘fair value’ means in trading. Think of fair value as the ‘true’ or ‘real’ price of an asset, based on its fundamental characteristics and market conditions. It’s the price at which an asset should reasonably trade in an efficient market.
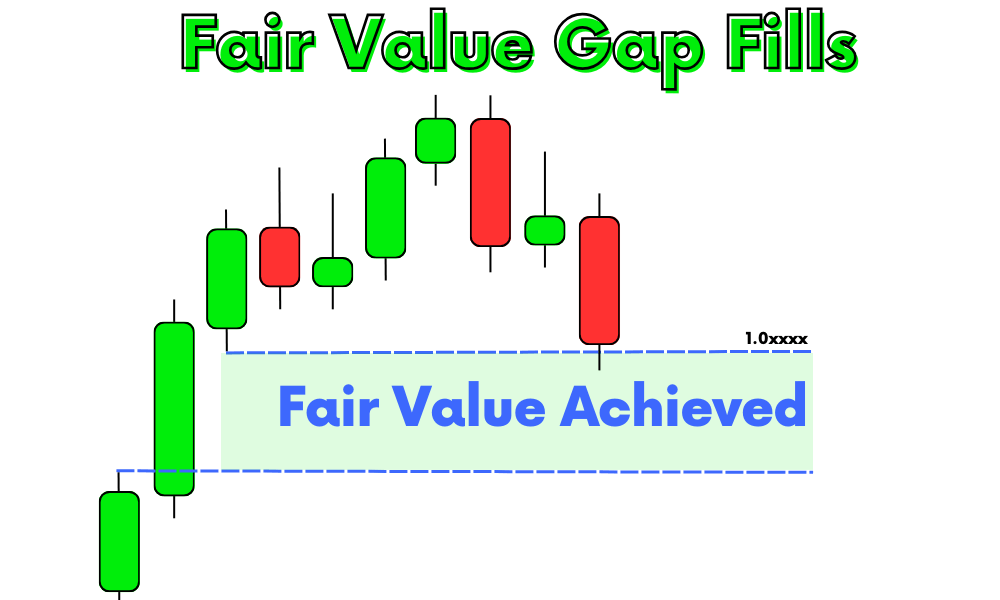
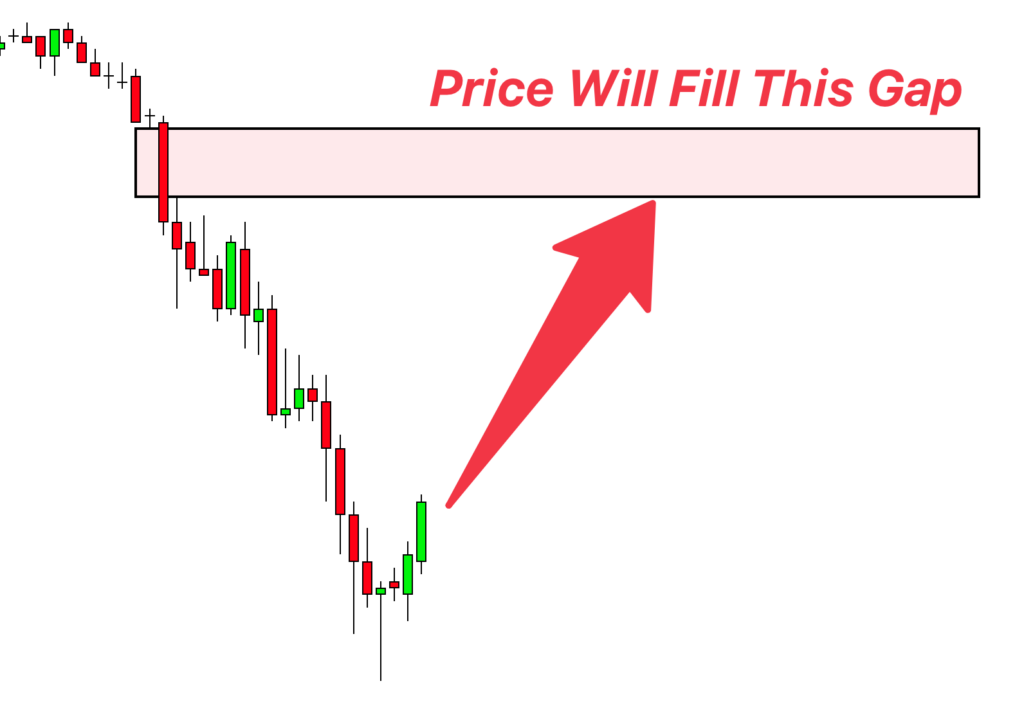
Now, how does FVG fit into this? On a candlestick chart, which is a type of chart used in trading to show price movements, FVG represents the difference between the current trading price of an asset and its fair value. This gap is visually noticeable. It’s like seeing a space on the chart where the asset’s price hasn’t touched yet, but theoretically, it should, based on its fair value. So, FVG is all about spotting these spaces or gaps on the chart – they show us where the price might move to align with the asset’s fair value.
The Importance of FVG in Trading
The Fair Value Gap (FVG) isn’t just a technical concept; it plays a crucial role in a trader’s decision-making process. Understanding FVG is key for traders, especially when it comes to predicting where the market might head next.
There are the following three major uses of fair value gap in trading:
Take Profit Levels
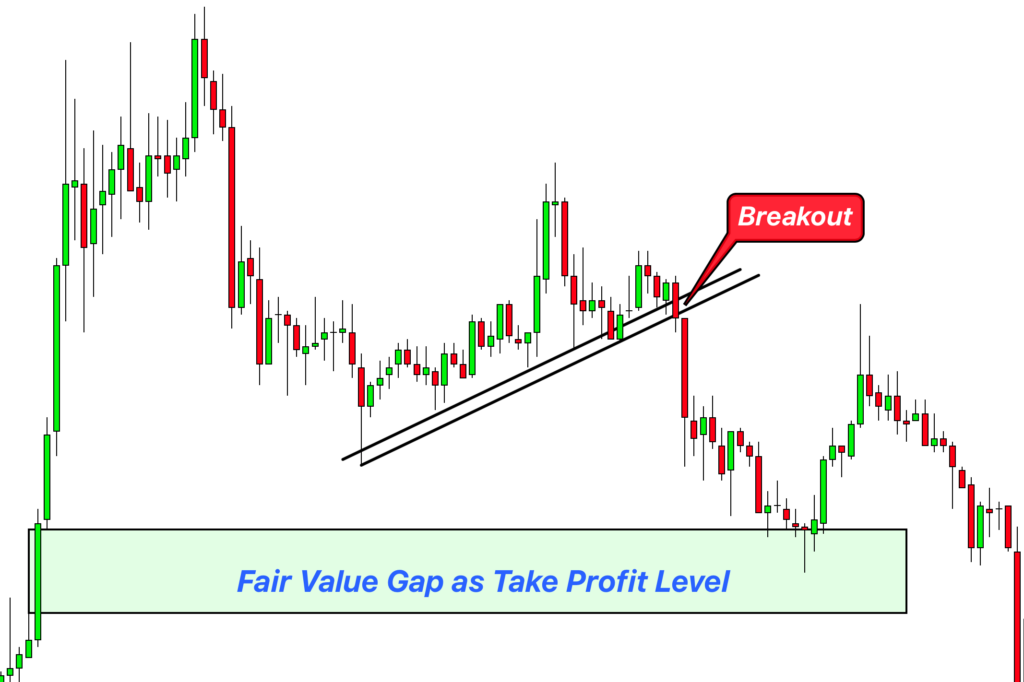
One of the significant benefits of understanding FVG is that it helps in identifying take profit levels. When a trader knows where the price is likely to move to fill the gap, they can set their take profit targets more accurately. It’s like having a roadmap that shows where the price is expected to travel.
Indicating Market Direction
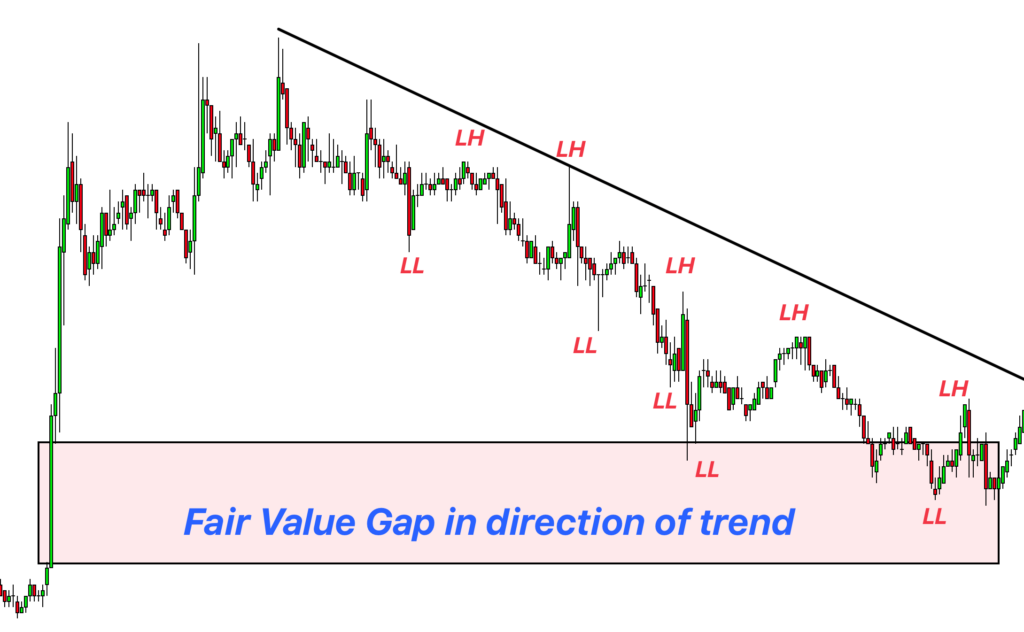
FVG can act as a compass for market direction. By analyzing where the gaps are, traders can get a sense of whether the market is likely to move up or down. For instance, if there’s an unfilled gap above the current price, it could suggest an upward movement is on the horizon.
Future Price Prediction
While no tool can predict market movements with absolute certainty, FVG gives traders a leg up in forecasting future price actions. Since the market often moves to fill these gaps, knowing where they are can provide valuable insights into potential future price levels.
How to Identify the Fair Value Gap on a Candlestick Chart
Identifying the Fair Value Gap (FVG) on a candlestick chart is a key skill for traders. Here’s how you can spot it:
- Look for Significant Candlesticks: Start by finding a large candlestick on the chart, which stands out due to its size compared to the surrounding candlesticks. This candlestick is your starting point.
- Check the Neighboring Candlesticks: The neighboring candlesticks are crucial in identifying FVG. For a valid FVG, the candlesticks on either side of the large one should not overlap it significantly. These gaps are where the market has not traded, indicating a potential FVG.
- Identify the Gap Area: The actual gap is the price area between the low of the previous candlestick and the high of the next one (or vice versa). This space on the chart is where the FVG lies.
Types of FVG
There are two main typees of fair value gaps in trading based on the direction of price.
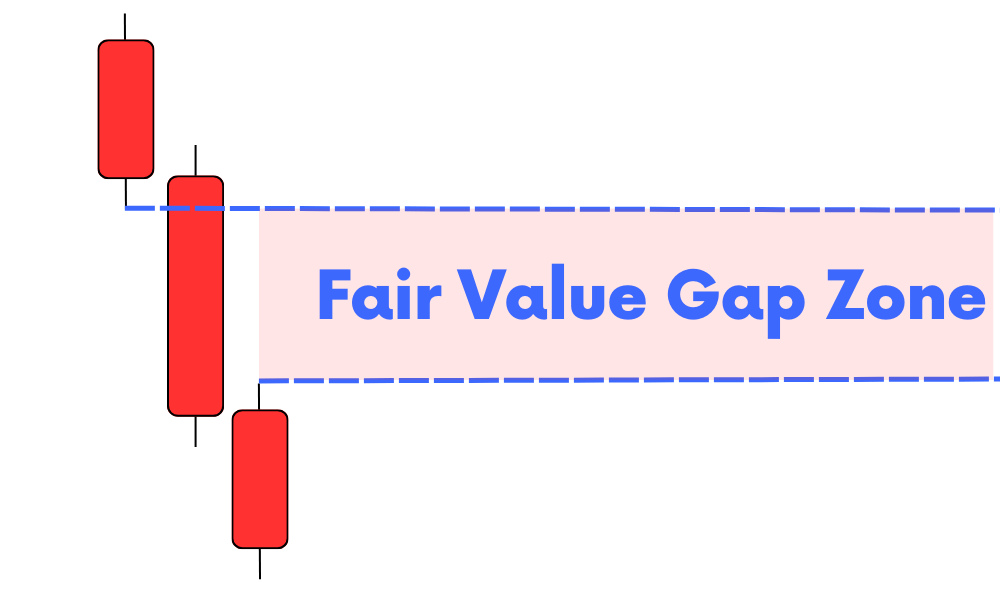
Undervalued FVG: This occurs when the price of an asset is lower than its perceived fair value. On a candlestick chart, it’s typically indicated by a large bearish (downward) candlestick followed by a gap. It suggests that the price may increase in the future to reach its fair value.
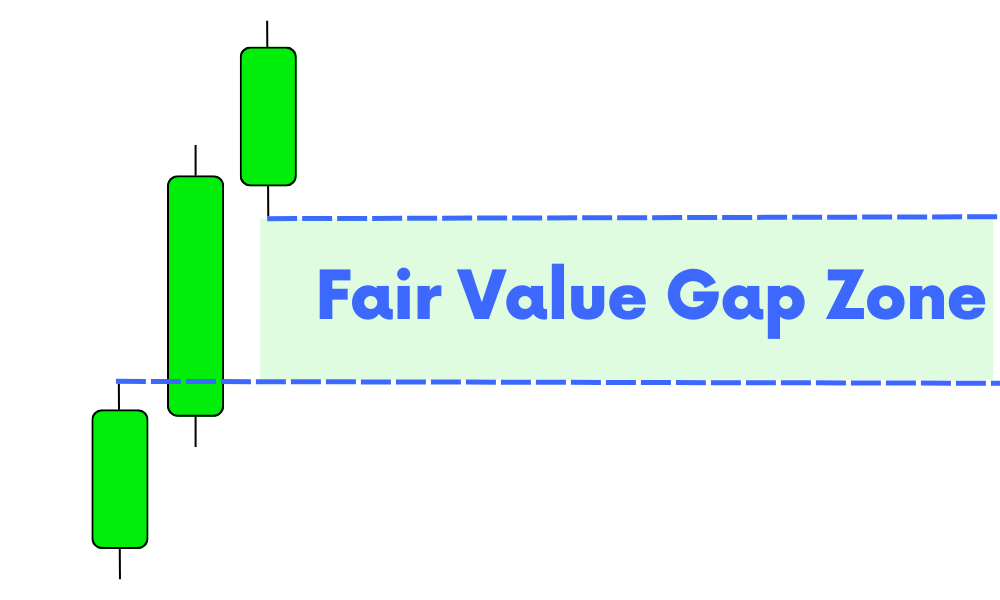
Overvalued FVG: Conversely, an overvalued FVG is present when the price is higher than its fair value. This is often shown by a large bullish (upward) candlestick followed by a gap. It indicates that the price might decrease to meet its fair value.
How to Draw FVG Zone on the Candlestick Chart
Drawing the Fair Value Gap (FVG) zone on a candlestick chart is a practical skill that can enhance your trading analysis. Here’s how to do it:
- Identify the Large Candlestick: First, find a significant candlestick that stands out due to its size relative to the others around it. This candlestick is your reference point for the FVG.
- Locate the Gap: Look at the candlesticks immediately before and after the large one. The FVG is the area where these neighboring candlesticks do not overlap with the large candlestick. This gap signifies an area where the price has not been established yet.
- Draw the FVG Zone:
- For an Undervalued FVG: Use the low of the candlestick just before the large candlestick and the high of the candlestick right after it. Draw a horizontal rectangle connecting these two points across the chart. This rectangle represents the undervalued FVG zone.
- For an Overvalued FVG: Connect the high of the candlestick before the large one and the low of the candlestick after it. Again, draw a horizontal rectangle across these points to represent the overvalued FVG zone.
- Extend the Zone: Extend the rectangle to the right side of the chart. This extension represents the area the price might move into to fill the FVG in the future.
FVG as a Market Magnet
The Fair Value Gap (FVG) can be thought of as a magnet in the market, exerting a pull on prices. This magnetic effect of FVG plays a crucial role in how prices move and eventually find balance.
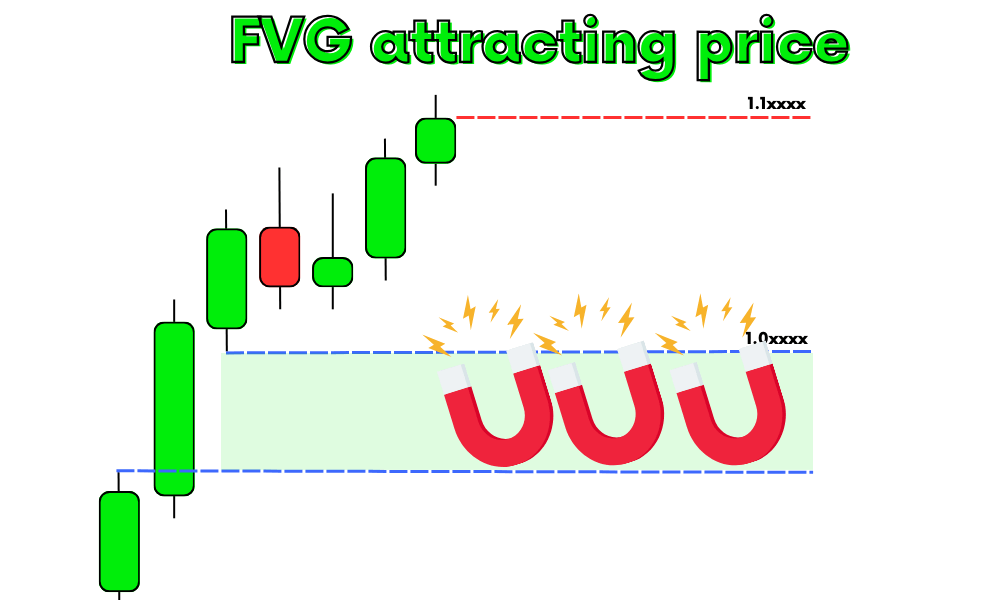
- FVG’s Magnetic Pull: Think of FVG as an area on the chart that draws the price towards it. Once an FVG is formed, it creates a sort of imbalance in the market. Prices are naturally inclined to move and fill these gaps, as if drawn by a magnetic force. This movement is often because the market seeks efficiency, and filling the FVG restores a sense of normalcy or equilibrium.
- Market Balance and Equilibrium: The concept of market balance is integral to understanding FVG. Markets, like many natural systems, tend to move towards a state of balance. When an FVG is present, it represents an imbalance — a deviation from the fair value. As the market strives to correct this imbalance, prices move in a way that ‘fills’ the gap. This movement towards the FVG and eventually filling it is the market’s way of achieving equilibrium.
- Predictive Nature of FVG: This characteristic of FVG makes it a valuable tool for traders. By identifying FVGs, traders can often predict the direction in which the prices are likely to move. If there’s an unfilled FVG, there’s a higher probability that the price will shift towards it in the future.
Natural Analogies to Understand FVG
To make the concept of the Fair Value Gap (FVG) more relatable and easier to grasp, let’s draw some parallels with natural phenomena.
| Natural Phenomenon | Behavior | FVG in Trading |
|---|---|---|
| Wind Filling Empty Spaces | Wind moves to balance air pressure by filling empty spaces. | Prices move towards FVG to fill the gap, aiming to restore market balance. |
| Water Flowing to Fill Gaps | Water naturally flows into and fills any depressions or gaps. | Prices are drawn to FVGs, similar to water filling a depression, to create a level field in the market. |
| Plants Growing Toward Sunlight | Plants grow towards sunlight, seeking the energy necessary for growth. | Market prices move towards FVGs, seeking areas of potential growth and balance. |
I am highlighting these natural phenomena because the trading market, at its core, is also a natural system. It operates on principles that are often mirrored in nature. As a technical analysis trader, comparing trading patterns with natural phenomena can provide us with a unique perspective. This approach allows us to anticipate future price movements with greater accuracy.
It’s similar to how we use other chart patterns in trading. By understanding these natural tendencies, we can better interpret and predict market behavior.
FVG and Price Movement
When a Fair Value Gap (FVG) is created in the trading market, it often signals an upcoming movement in price. This is because prices have a tendency to move towards and eventually fill these gaps. Think of an FVG as an incomplete part of a picture; the market naturally wants to complete it by moving the price into this gap. This tendency is akin to a puzzle seeking completion, with the market striving to fill in the missing pieces for a complete image.
It’s important to note that FVGs occur across all timeframes, from shorter minute-by-minute charts to longer daily or monthly charts. This universality means that no matter what your trading style or preferred timeframe is, FVGs are a relevant and useful concept.
Aligning your trading strategies with the presence of FVGs can lead to better trading results and a higher winning ratio. When your strategy considers FVGs, you’re essentially moving in sync with the market’s natural tendencies.
FAQs
Fair Value Gap (FVG) works on all timeframes. The best approach is to use the timeframe that you are already using to analyze your currency pair for FVG. This ensures consistency in your analysis and helps in making more accurate trading decisions.
If a currency pair has both underrated and overrated gaps, you should focus on the one that is nearest to be filled first or that aligns with the current trend direction. This strategy helps in prioritizing trading opportunities and aligning with the market’s momentum.
Yes, there is a Fair Value Gap indicator available, developed by Forexbee. This tool can automatically detect FVG zones, simplifying the process of identifying potential trading opportunities. You can check it out here. 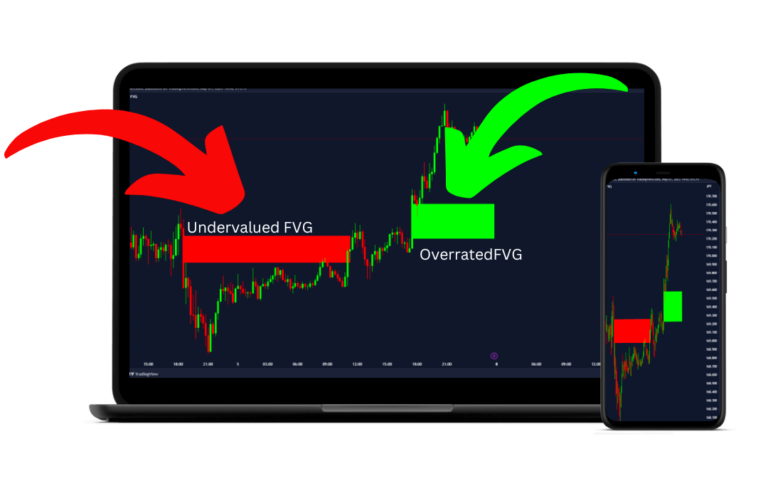
While FVGs tend to get filled, there’s no definite timeline for when this will happen. It could take days, weeks, or even months. The key is to recognize that while FVGs are likely to be filled, the timing can vary significantly.
In forex trading, due to the high volume and continuous trading, a clear space or gap is not often visible as it is in stock trading. In forex, we use large body candlesticks to identify gaps. A big body candlestick on a higher timeframe suggests a gap on a lower timeframe, helping forex traders to spot FVGs effectively.
Conclusion
To wrap up, the Fair Value Gap (FVG) is a straightforward yet powerful concept in trading. It’s about spotting those spaces on a chart where the price hasn’t reached but is likely to move towards. This movement is often because the market, like nature, tends to fill gaps and seek balance.
By aligning your trades with the presence of FVGs, you’re not just guessing the market’s next move; you’re strategically placing your trades in line with the market’s natural tendencies.
In conclusion, keep an eye out for those FVGs, understand their impact, and use them to your advantage. This simple approach could significantly enhance your trading decisions, leading to potentially better outcomes in your trading journey.


