
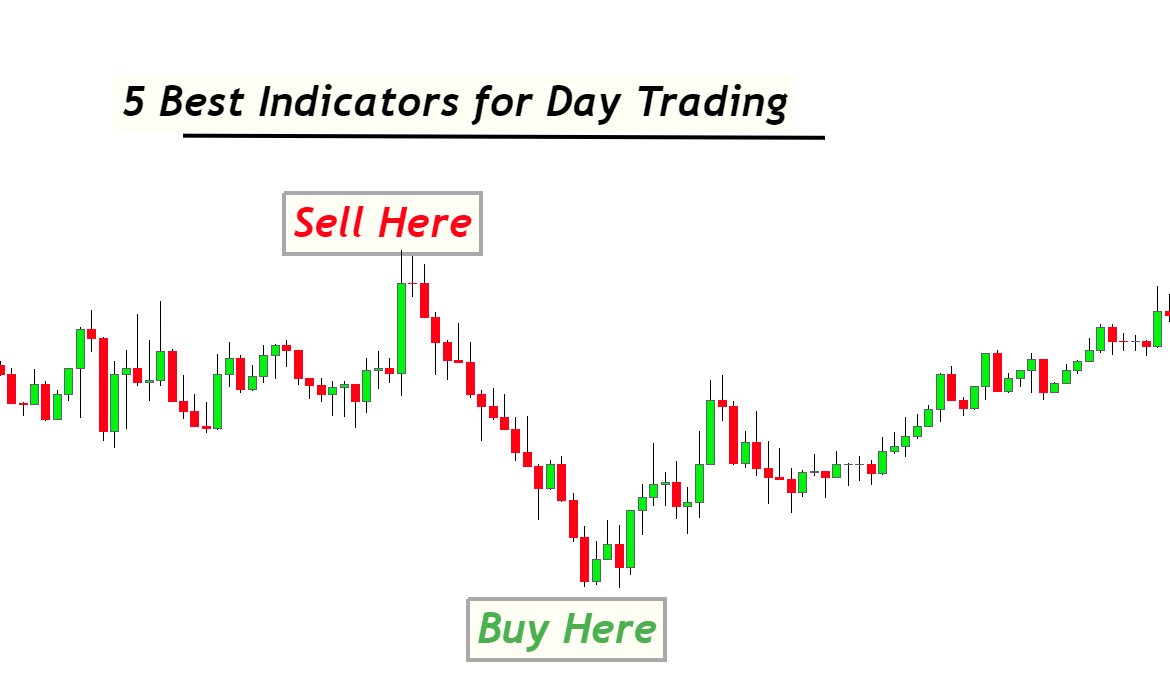
Introduction
Technical indicators are the tools that help to forecast the financial markets in day trading. These intraday indicators are beneficial in identifying the trend of an asset or currency pair, either a bullish trend or a bearish trend.
Day traders have very short time intervals for trading because they must close the positions before the daily market closing. They cannot analyze all the currency pairs or assets manually daily. So intraday indicators help a lot to find the trends without any effort. That’s why day traders use these indicators and analyze the markets quickly.
There are many technical indicators available in the market. Still, I rely on the price action indicators only because they show a clear picture of the market instead of mathematical indicators. The mathematical indicators always lag the price while price action indicators always lead the price. So, choosing the price action is the best to do technical analysis in day trading.
What are the 5 best indicators for day trading?
For day traders, I will recommend going with the price action indicators. Here is the list of best indicators for day trading you should use:
- Supply and demand indicator
- Higher high lower low trend indicator
- Exponential Moving average indicator
- Candlestick pattern indicator
- Daily Fibonacci indicator
You should use these indicators to automate your trading strategy to some extent. This will also improve the discipline and trading psychology.
| Indicator Name | Function |
|---|---|
| Supply and demand indicator | Supply and demand zones |
| Higher high lower low indicator | Price trend direction |
| Exponential Moving average indicator | Price Trend reversal |
| Candlestick pattern indicator | find trend reversal candlestick patterns |
| Daily Fibonacci indicator | Draw Fibonacci lines on daily TF candlestick |
Here is the review of the top 5 technical indicators for intraday trading.
Supply and demand indicator
Supply and demand is the most basic form of technical analysis. Trading is incomplete without supply and demand because this is the footprint of market makers in technical analysis.
The best feature of this indicator is that it provides ultra-high risk-reward ratios. These high-risk reward ratios help to manage the risk in trading. For example, if you lost five trades and won a trade with a 1:6 risk-reward, you will be in profit.
The supply and demand indicator has the potential to provide even 1:40 risk-reward trades. This will also improve your trading psychology.
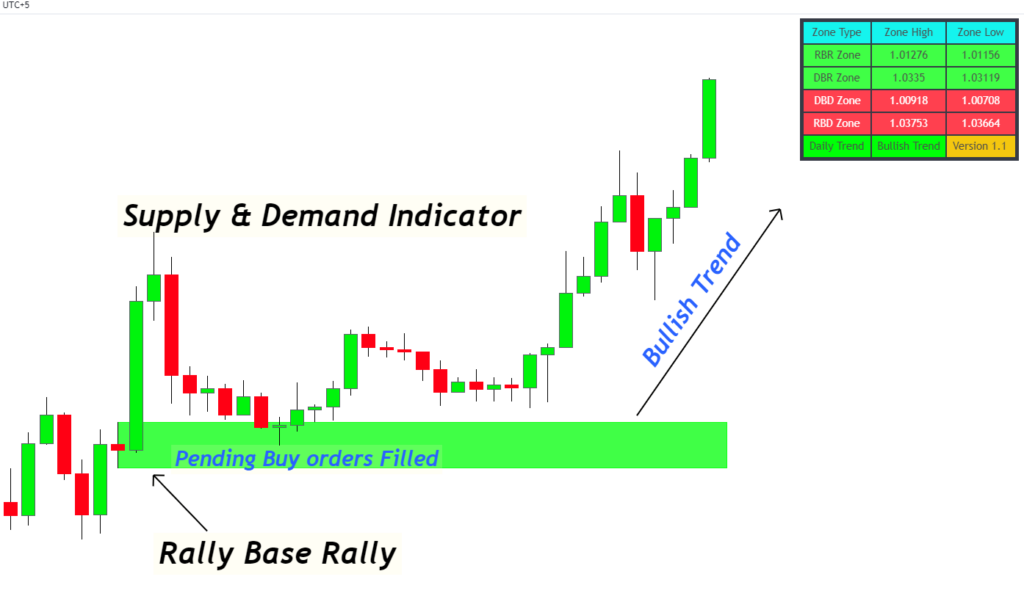
The demand zone shows the area from where a trader should open buy trades and stop-loss levels. The supply zone indicates the price zone from where a trader should open a sell trade. Usually, these zones have a small price range, unlike support and resistance zones. Then stop loss range will also be small. This results in ultra-high risk-reward trades.
I will highly recommend this supply and demand indicator to day traders to try once. You will never regret it later because this indicator has been made after proper research on supply and demand zones. It has been improved by backtesting and the live testing process.
Exponential Moving average indicator
Moving average is the most widely used technical indicator by intraday traders. Although it is a mathematical formula-based indicator, it is natural. Because it has simple logic of average price of last few days. And average price matters a lot because the price will always try to approach the average price naturally.
MA indicator is used to identify the trend continuation and trend reversal on the price chart. In intraday trading, the moving average helps traders check whether either price is moving above or below the moving average line.
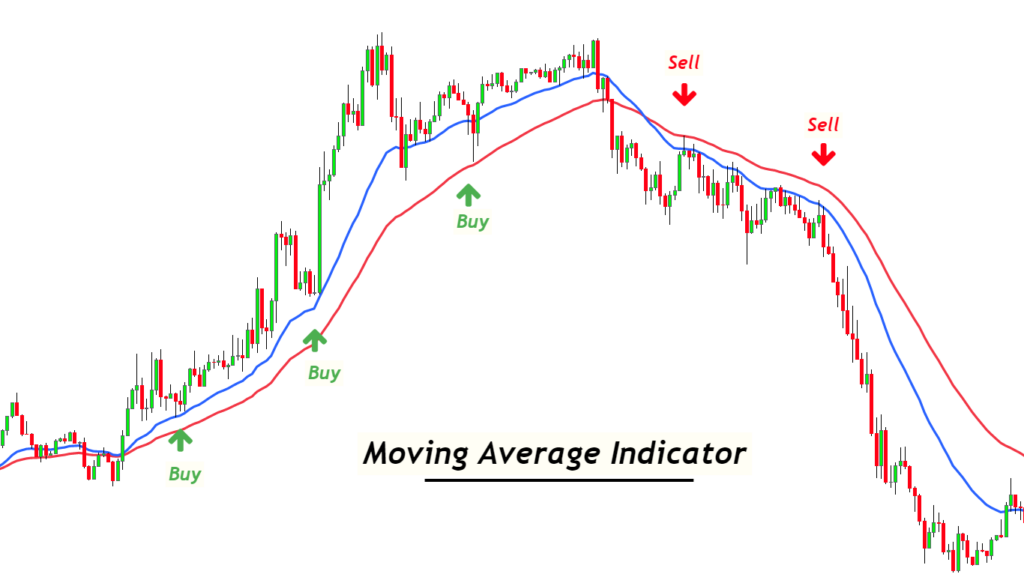
Intraday traders tend to open a buy trade only when the price moves above the moving average line. On the other hand, day traders tend to open a sell trade only when the price moves below the moving average line.
My recommendations for moving the average indicator
First, I recommend day traders use two simple moving averages with 23 and 45 periods. Because the price will stay above the 23 periods MA, the bullish trend is strong. While if the price is below the 23 period MA line, then it means a bearish trend is strong.
If the price is between the 23 and 45 periods Mas, the price is in the decision phase. Market makers decide either to continue the trend or take a trend reversal.
The second important thing is that you should always take a trade when the price is close to the moving average line because the moving average always acts like a magnet. It attracts the price. So, when the price deviation from the moving average line is greater, you should avoid opening a trade.
For example. If there is a significant deviation between the price and the 23-period moving average line during a bullish trend, you should avoid opening a bullish trade.
A day trader should note these two essential points while day trading with a moving average indicator.
Higher high and lower low trading indicator
The advanced strategy to determine the trading trend is by the higher high and lower low methods.
According to price action, when price waves form higher highs and higher lows, the overall trend is bullish. While if the price waves form lower lows and lower highs, the general trend will be bearish.
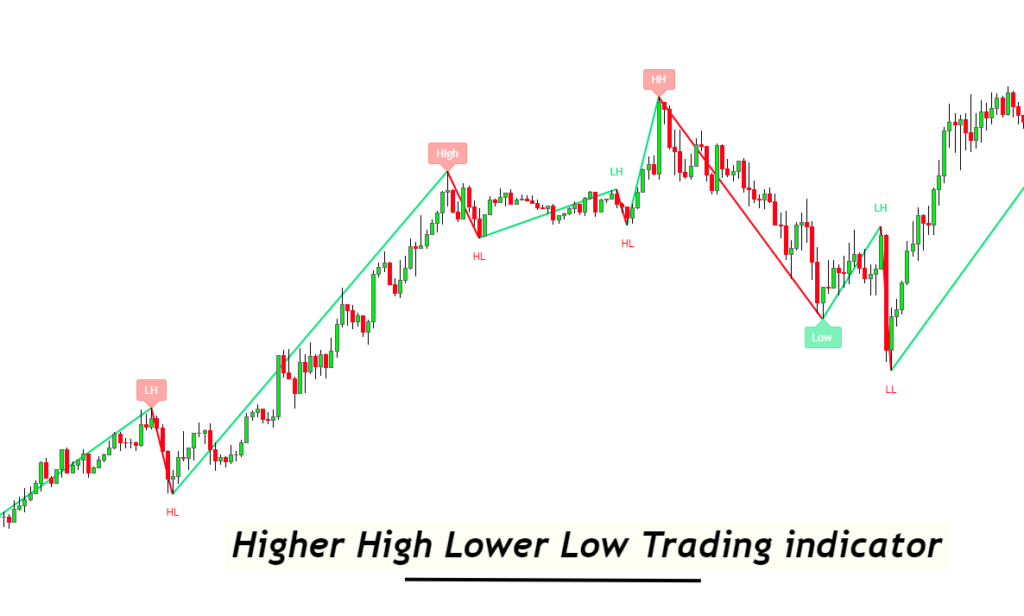
So, to automate this trend filter, there are indicators available on the tradingview platform.
The main drawback of this indicator is that its accuracy is above 80%. So, I will also recommend you look at this indicator while analyzing the trend. Although this method is more accurate for trend filtering in trading than moving average lines, it is also difficult for beginner traders.
Candlestick pattern indicator
This is the most important indicator you need to use. Candlestick patterns show the reversal points on the candlestick chart.
For example, you always need a trend confirmation from a key level to open a trend reversal trade. A trader will prefer to buy from the support zone, but market makers can also break the support zone. So, to confirm the validation of the support zone, I recommend looking for a bullish candlestick pattern at the support zone. This will ensure that the support zone is valid, and the price will take a bullish trend reversal.
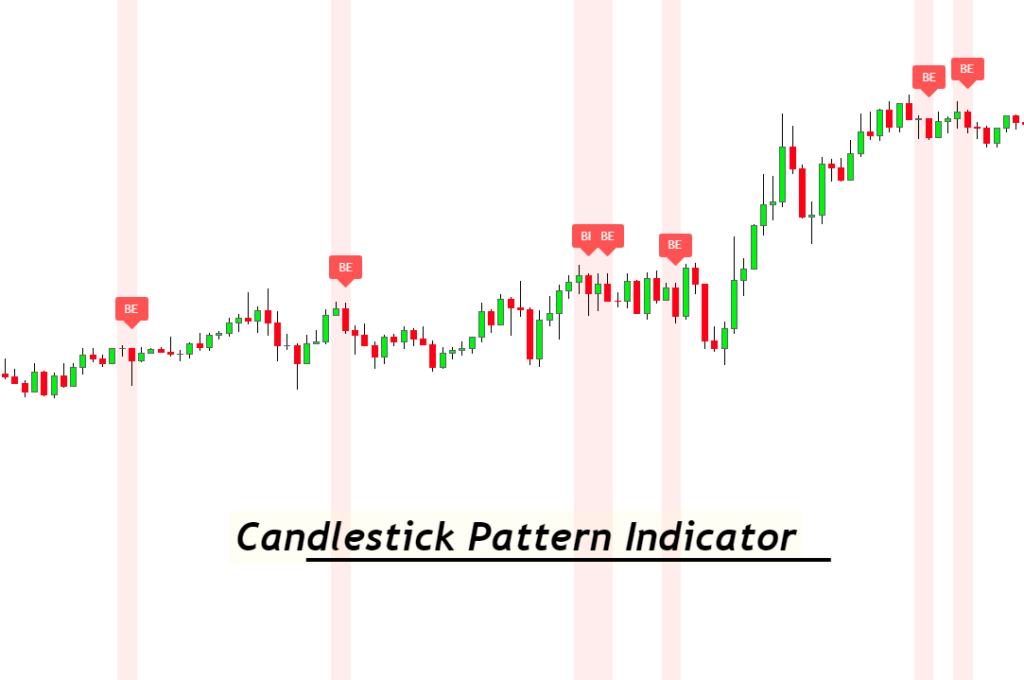
Another advantage of the candlestick pattern indicator is that it will also tell us about the stop loss and entry price levels to open an order. It helps to increase the risk-reward ratio per trade.
Retail traders use many candlestick patterns, but I recommend only four patterns to reduce the chances of mistakes. These four candlestick patterns are following:
- Pin bar
- Inside bar
- Morning and evening star
- Engulfing pattern
Daily Fibonacci indicator
Fibonacci is the most widely used technical tool in trading. Because it consists of natural ratios, it is a very effective tool to predict the key levels on the price chart.
The daily Fibonacci indicator is especially important for day traders. Because this indicator will plot Fibonacci ratios on the daily candlestick, and then you can day trade those Fibonacci levels on lower timeframes.
50 – 61.8 Fibonacci zone is essential. It is also called the golden zone. Price mostly retraces to this zone to take a trend reversal.
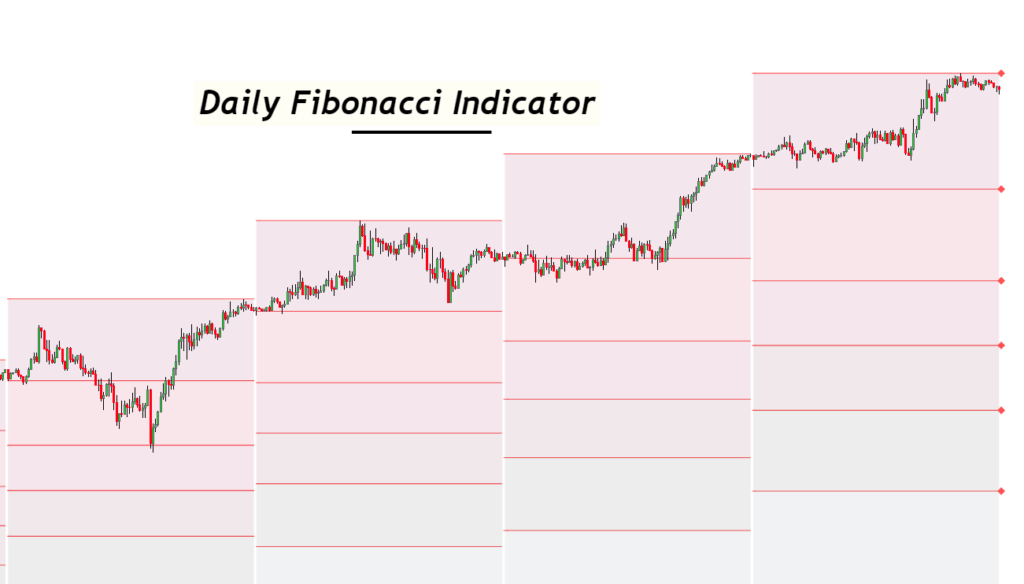
I highly recommend you use this daily Fibonacci indicator in day trading. This will help you open orders from pinpoints to get high-risk reward ratio trades.
What do the trading indicators tell day traders?
In day trading, you always need a confluence to increase the probability of winning in a trade. Technical indicators have proven the best way to add confluence to a trading strategy.
For example, confirming the higher timeframe trend in intraday trading is necessary. If you open a trade against the higher timeframe trend, you will usually have to bear a loss in the London session due to increased market volatility.
So, to tackle this, you can use the trend indicator instead of analyzing the trend of 28 currency pairs in forex trading daily.
Let’s take another example of the supply and demand indicator.
You will always have to look for a demand zone to open a buy trade during the London session in intraday trading. But you cannot analyze a demand zone on 28 currency pairs every day because this will become massive work to handle. Instead, you can leave this work to indicator with an alert function. Because the indicator will send you an alert each time, it will find the demand zone on the chart of 28 currency pairs.
When the confluence of technical indicators meets, you should manually analyze that trading setup. These steps will substantially improve your trading.
Discipline in trading is also a very important factor
Conclusion
A highly profitable strategy consists of many confluences with a semi-automatic system. Because you should manage your time and improve your trading psychology. The trading psychology is the most challenging part of forex trading, and it takes years of experience to improve it. But with a semi0automatic system, you can improve your trading skills.
That’s why I highly recommend that day traders use the above indicators to improve their strategy. It does not mean you will have to use all the five indicators, but you can use any appropriate indicator according to your trading strategy.
Yes, but it mainly depends on the type of trading strategy a professional trader uses. A trading strategy consists of the confluence of three or more technical tools.
I always recommend the traders to use only leading indicators like indicators based on price action. The mathematical indicators like MACD, RSI, etc., generate many false signals. In price action trading, you should rely on price action indicators only.
A day trader should use one to two indicators with the trading strategy. Please keep in mind that you should not rely totally on the indicators. But you should build a semi-automatic system using a confluence of indicators and natural repetitive price patterns.
If you use many indicators on the chart, it will make it difficult for you to make a decision. Making a decision is very important in trading, and you should always prefer to make the decision easy. This will improve your trading psychology.
It depends on the backtest results. Because different indicators will perform differently on different trading assets or currency pairs, I will say the supply and demand indicator is the most accurate because it is built by professional traders using price action patterns. It is also based on the most advanced concepts of trading.