
Introduction
Trading in the financial markets isn’t just about guessing; it’s about making informed decisions. That’s where smart money concepts come in. These concepts are the strategies used by experienced traders and big financial institutions. They help in understanding market movements and making profitable trades.
In this guide, we’re going to make smart money concepts easy to understand and use. No matter if you’re new to trading or have been at it for a while, these key ideas are important. They’ll give you a clearer view of the market and help you trade more effectively, just like the experienced traders.
What are Smart Money Concepts?
Smart money concepts are the tricks used by big, experienced traders and institutions in the forex market. Think of them as the special moves used by the market’s big players to make profits. Knowing these can help you understand the market better and improve your own trading.
These concepts are important because they show you how the market really works. They’re like a behind-the-scenes look at what drives prices up or down. By using these concepts, you can make smarter trades, just like the pros.
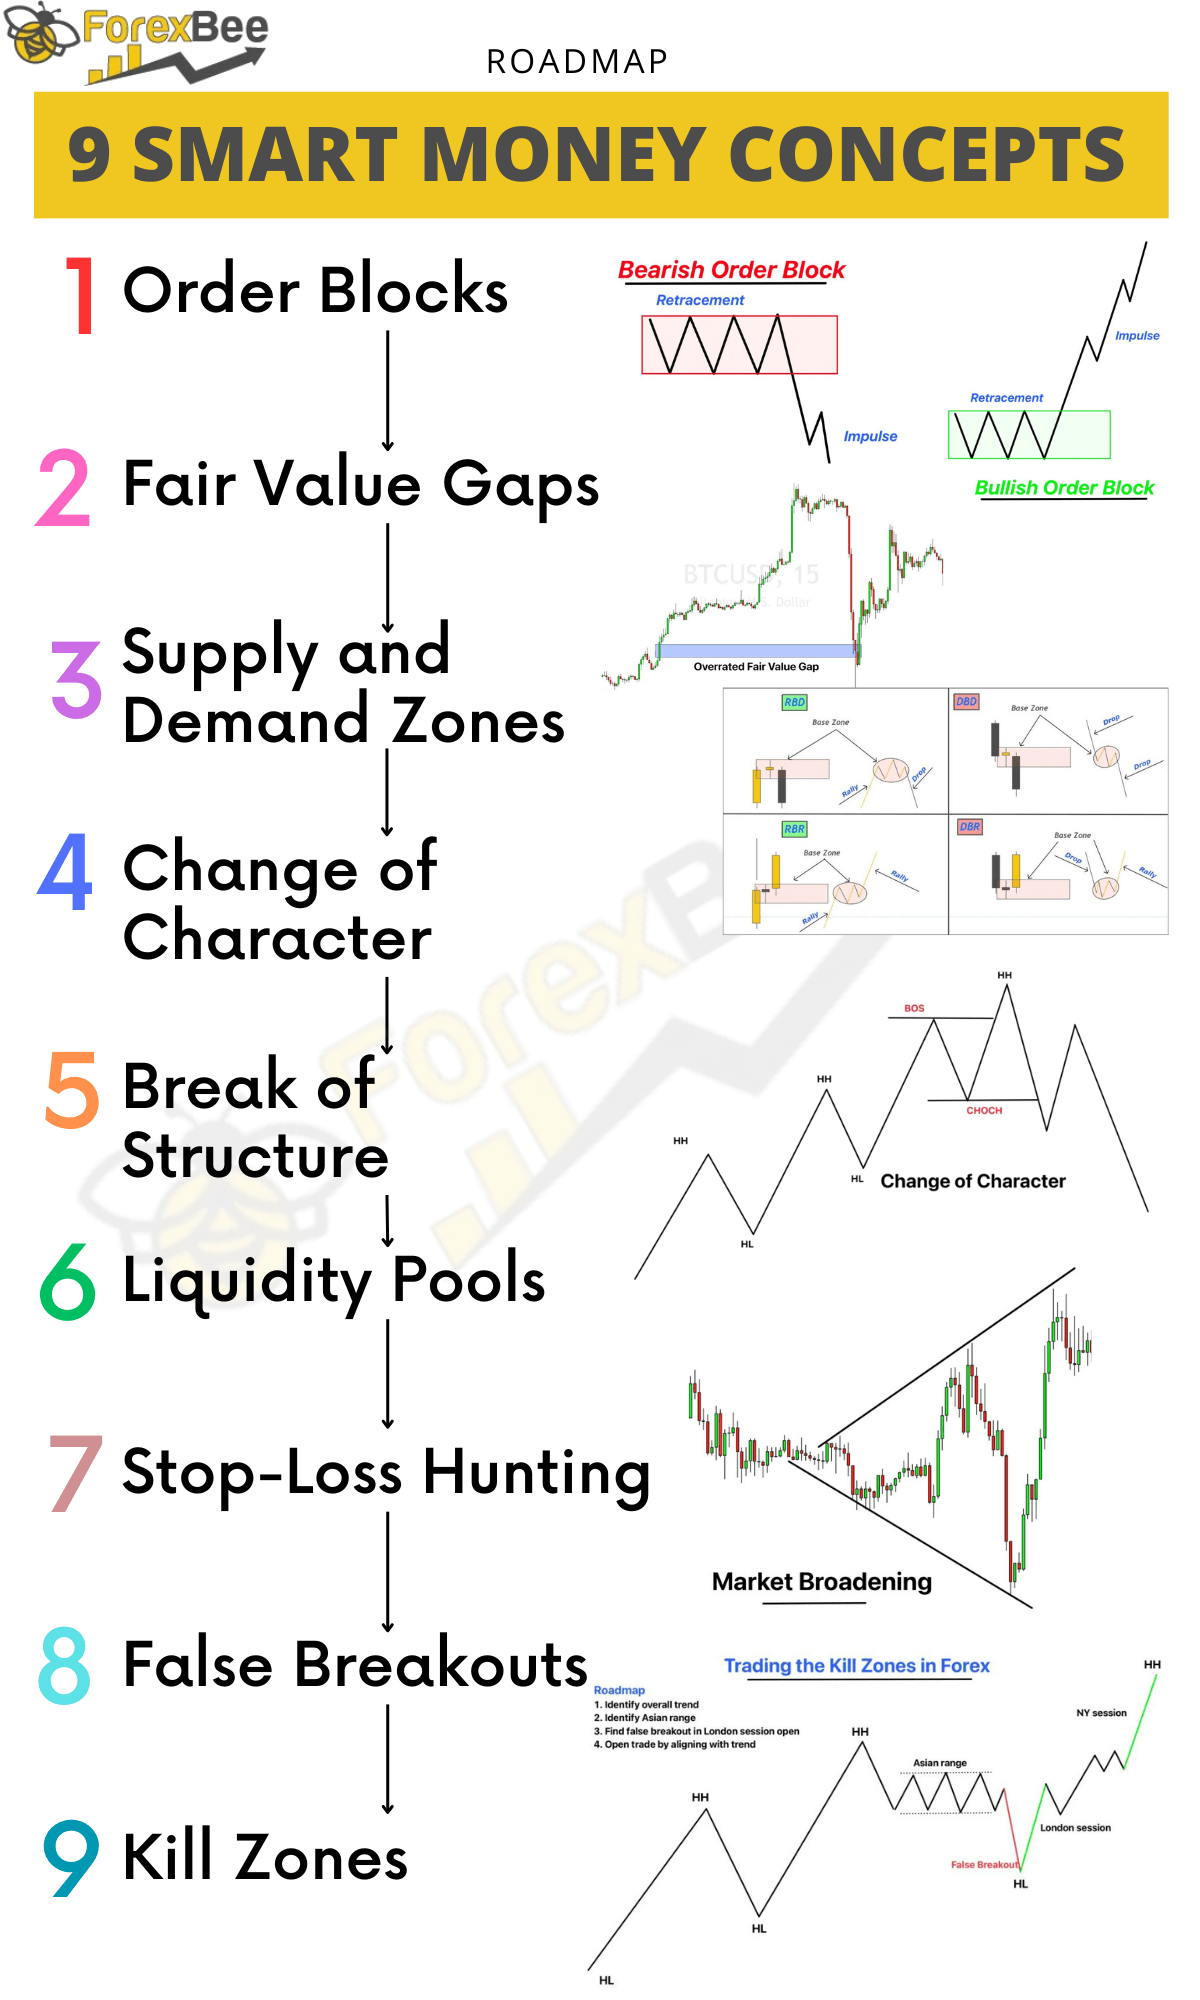
Let’s check out the main smart money concepts:
| Smart Money Concept | Description | Image |
|---|---|---|
| Order Blocks | Finding where big traders are likely to buy or sell a lot. | 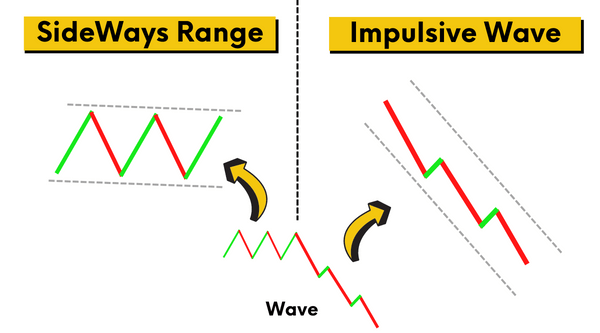 |
| Fair Value Gaps | Gaps that act as price magnets and are typically filled. | 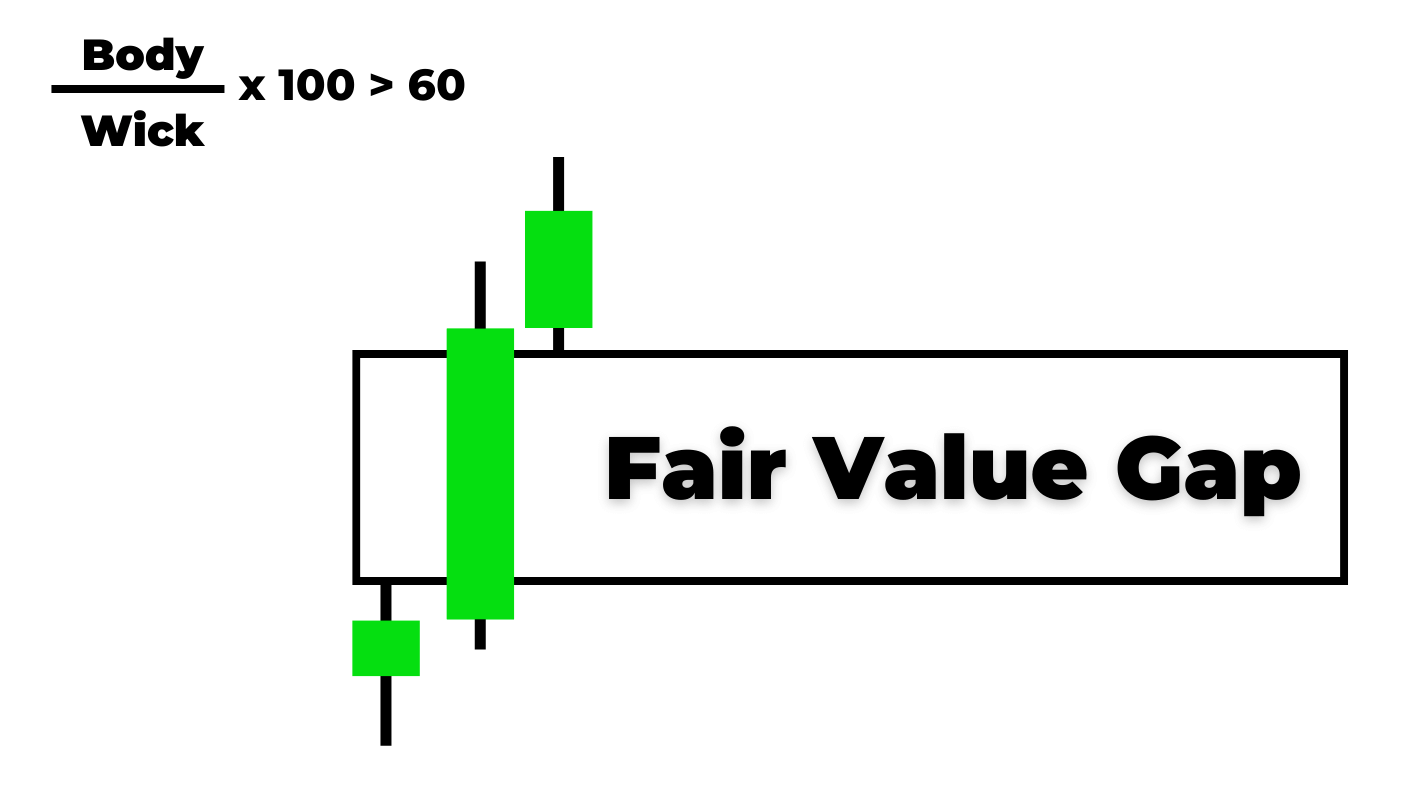 |
| Supply and Demand Zones | Zones where price fills the pending orders of market makers. | 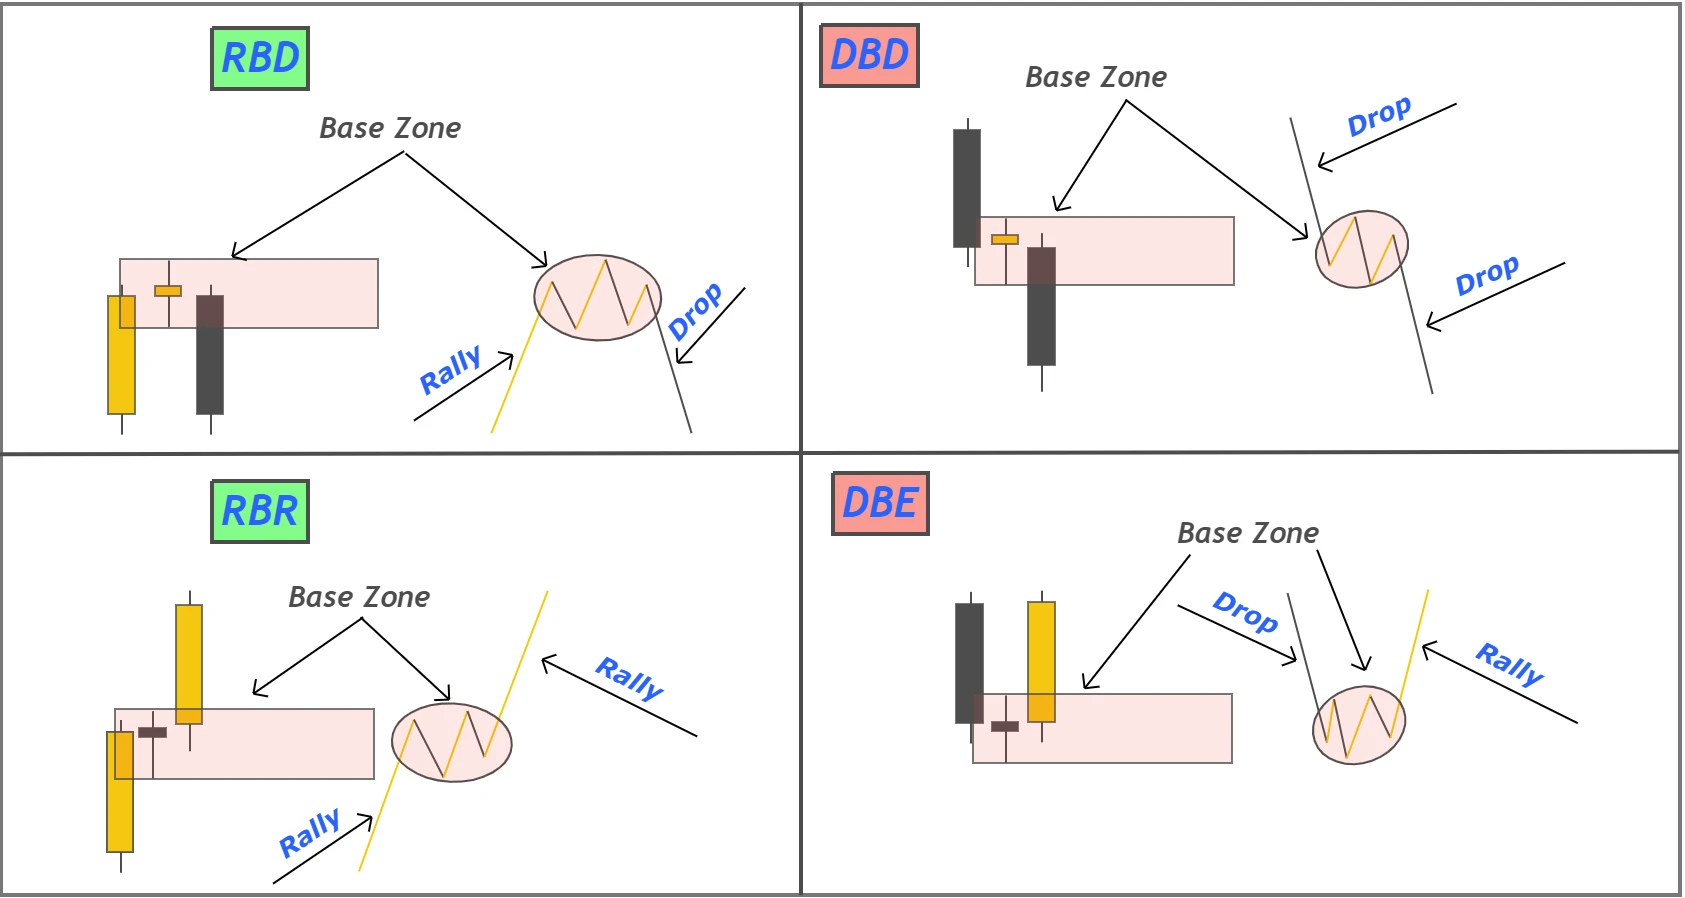 |
| Change of Character Trading | When the market starts acting differently, signaling a possible trend change. |  |
| Break of Structure | Points where the normal pattern of the market changes. | 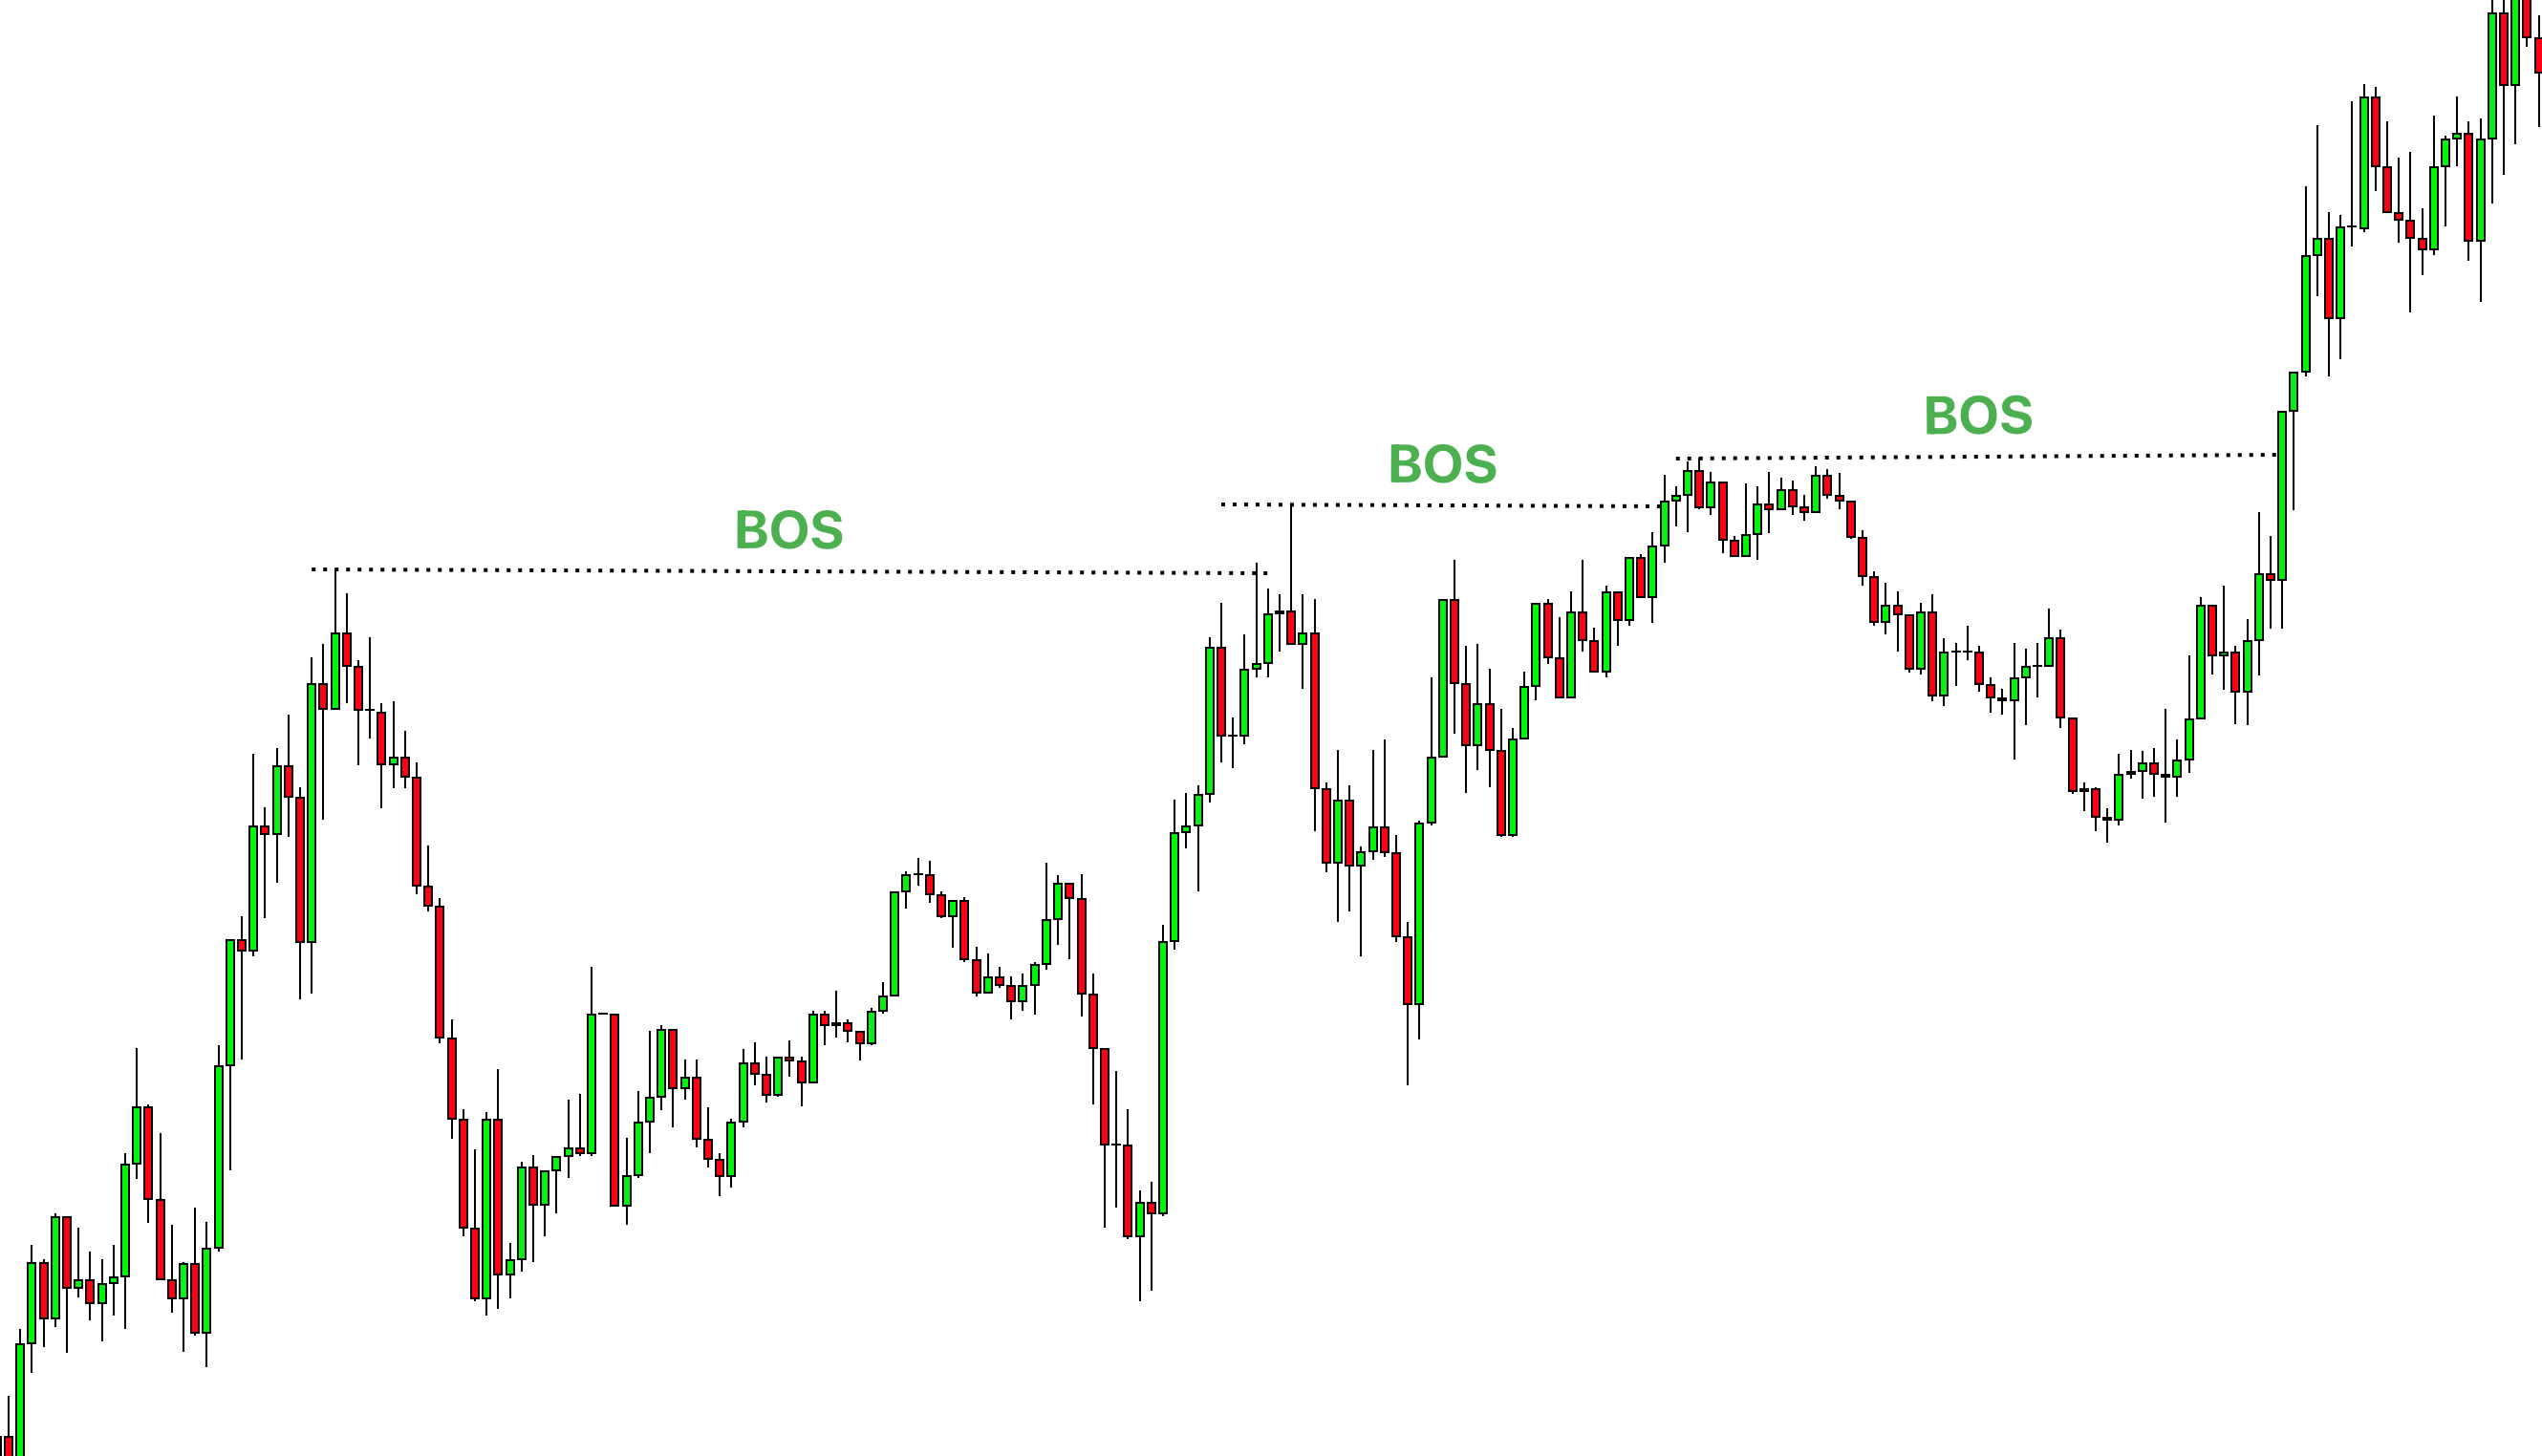 |
| Liquidity Pools | Places where a lot of trading happens. | 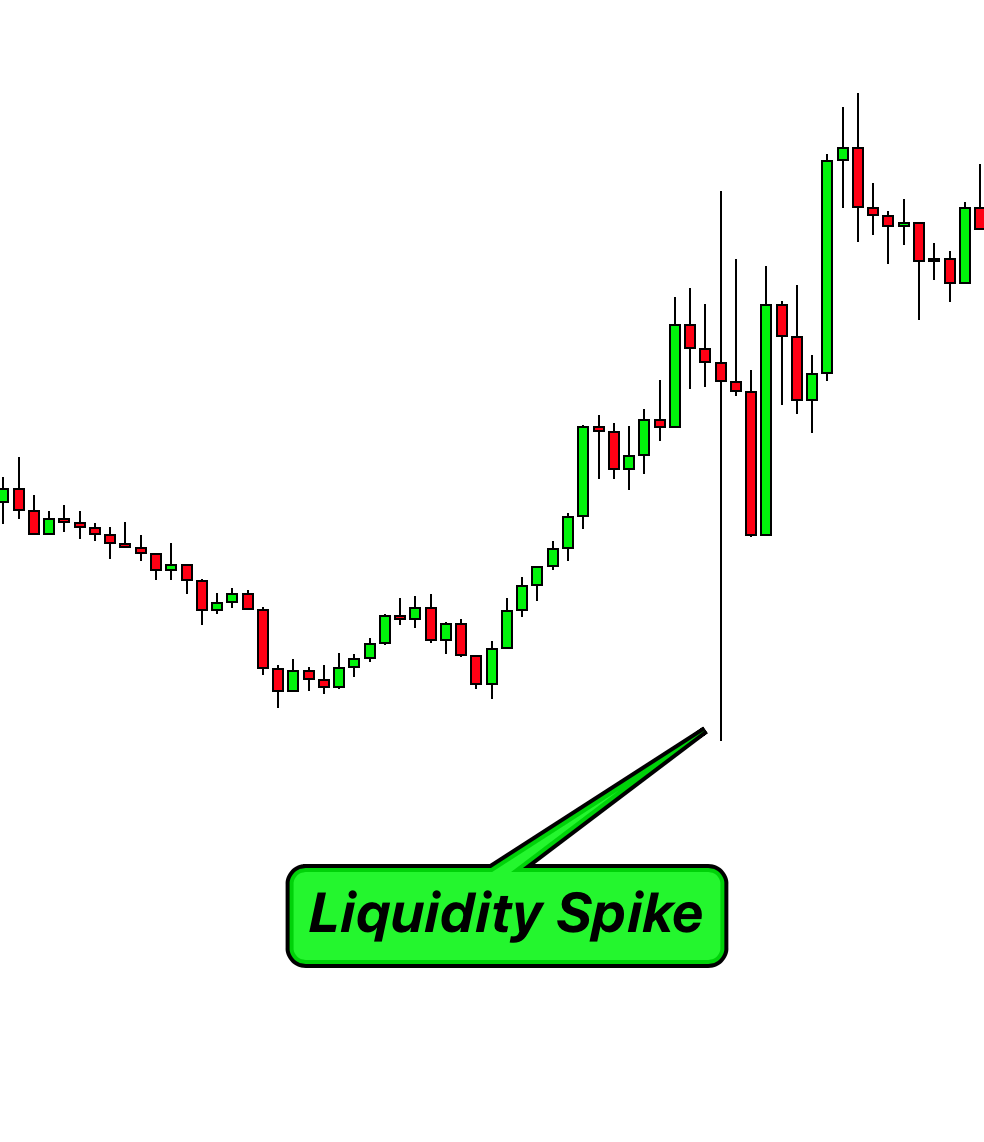 |
| Stop-Loss Hunting | When big traders make moves to trigger smaller traders’ stop-losses. |  |
| False Breakouts | Times when the market looks like it’s moving one way but then goes the other way. |  |
| Kill Zones | Times during the day when the market is buzzing with activity. | 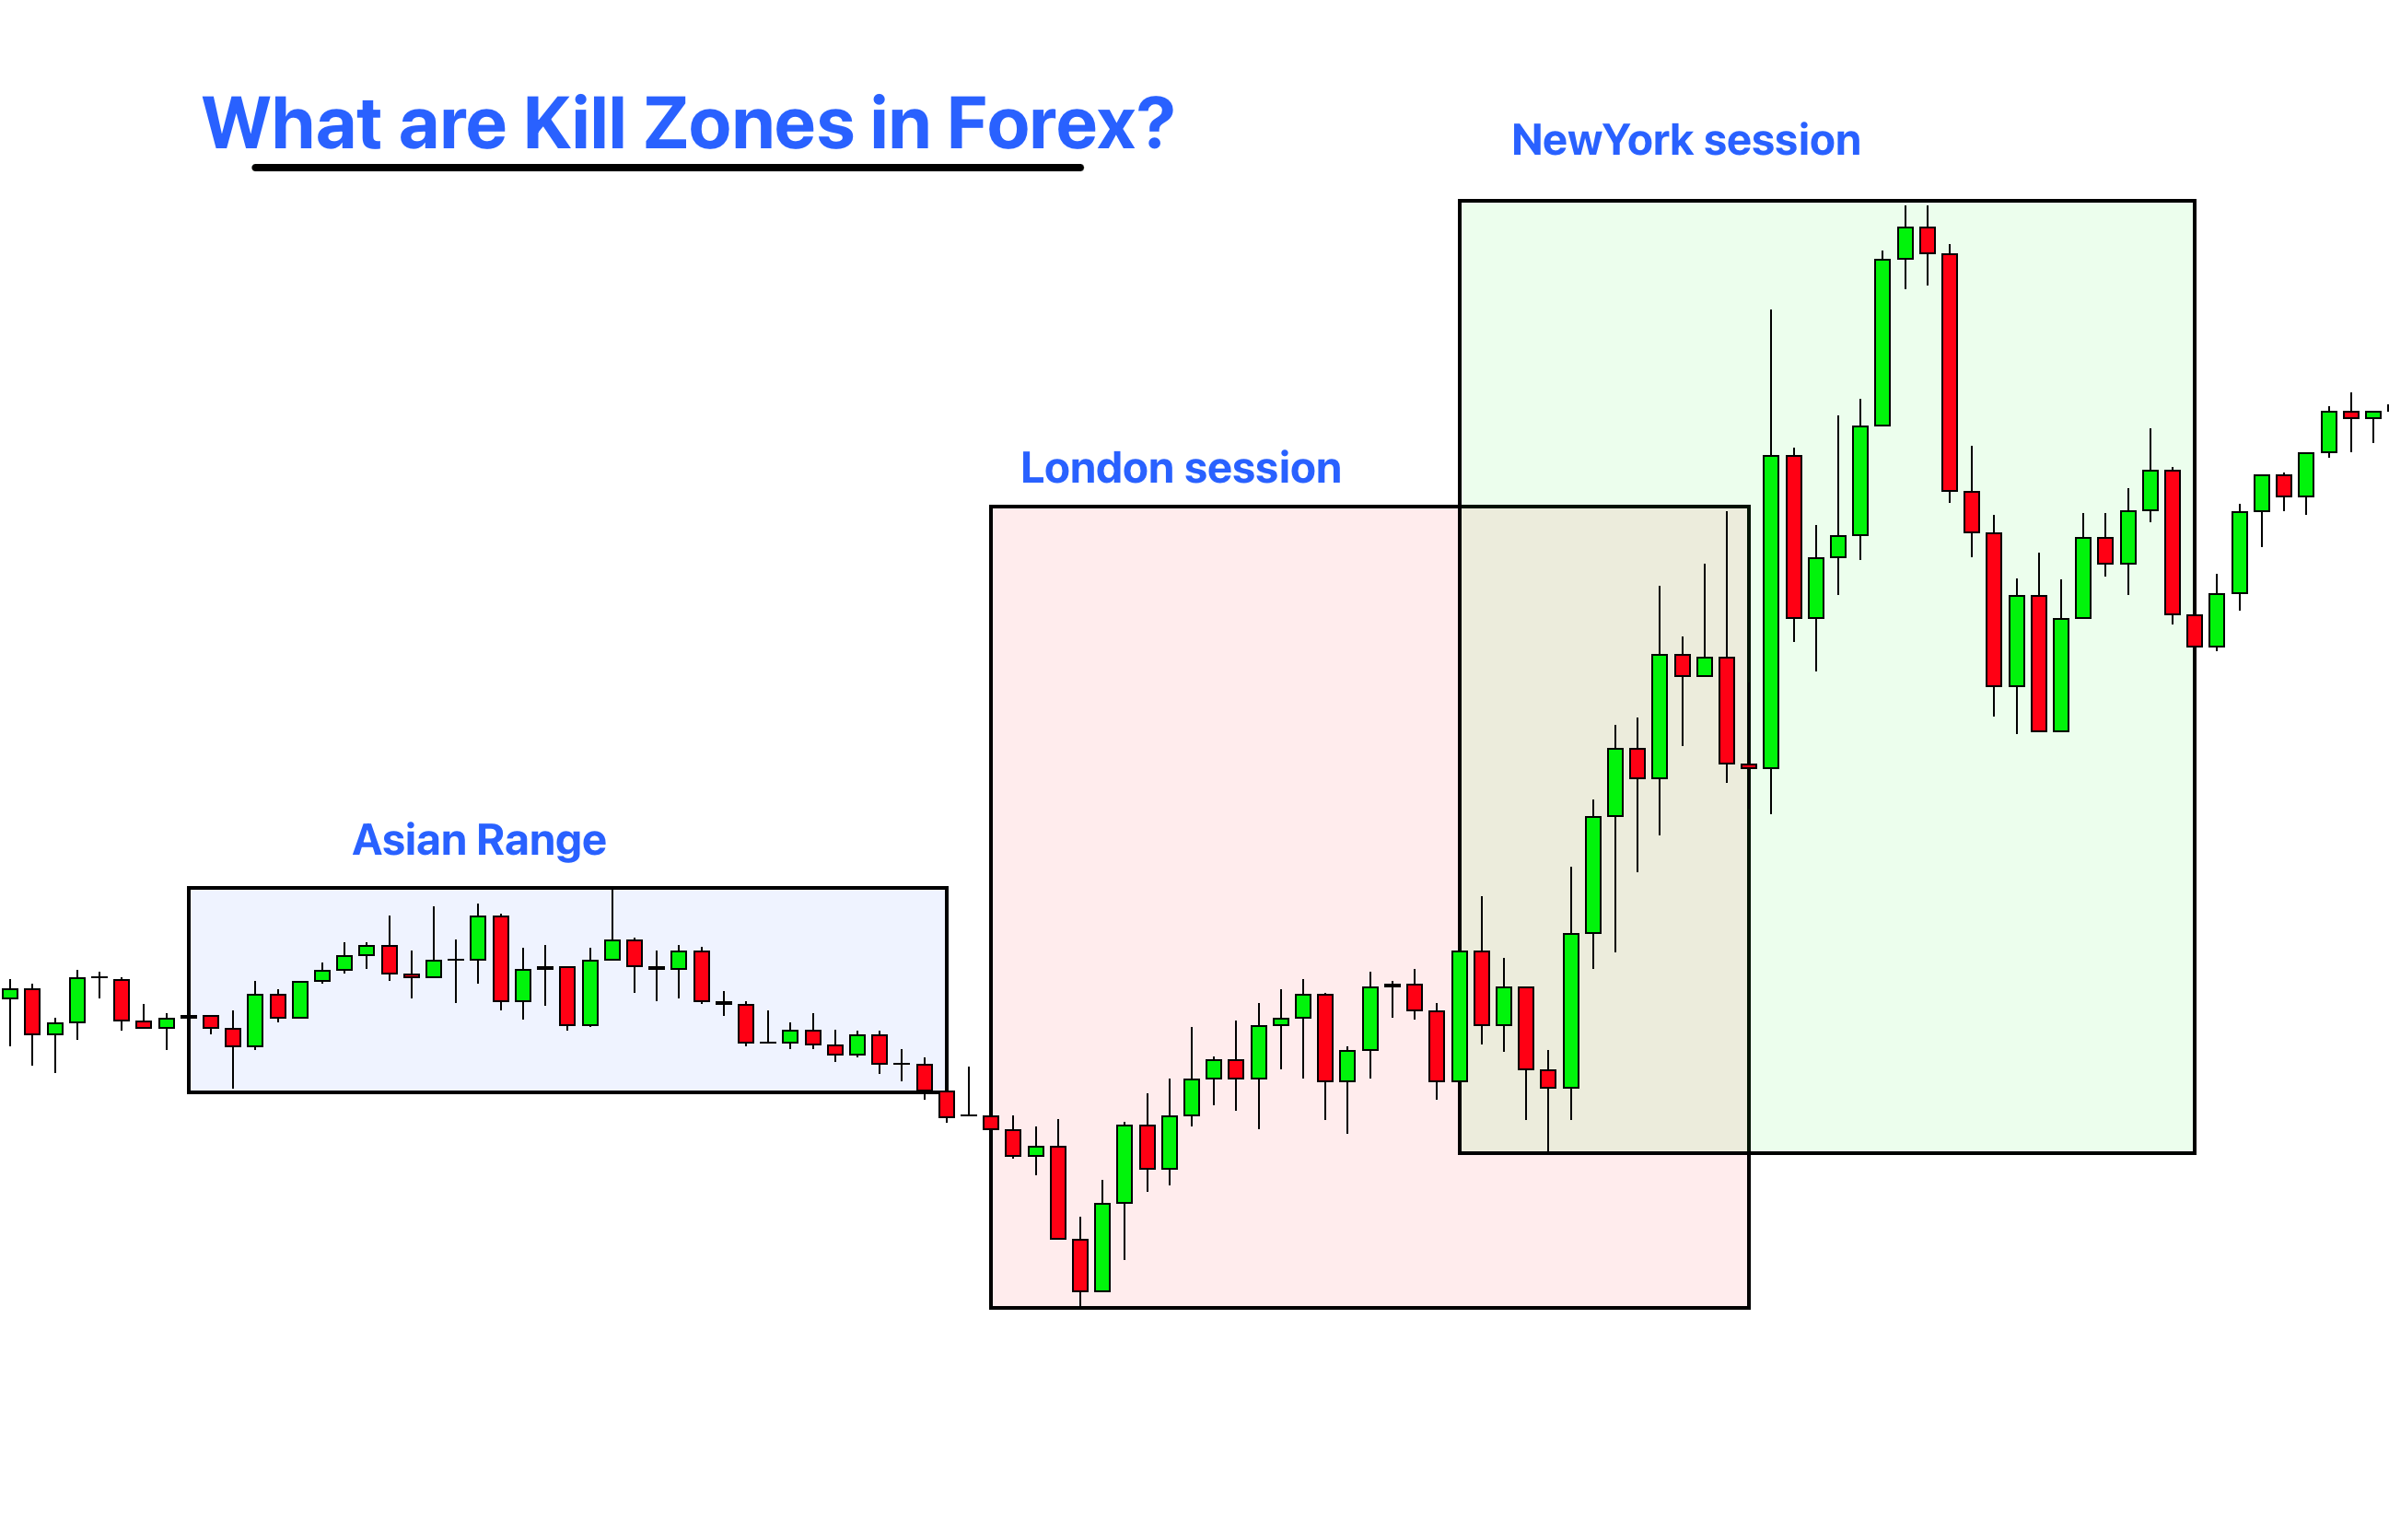 |
Understanding these concepts can really help you trade smarter and more like the big guys in the market.
1. Order Blocks
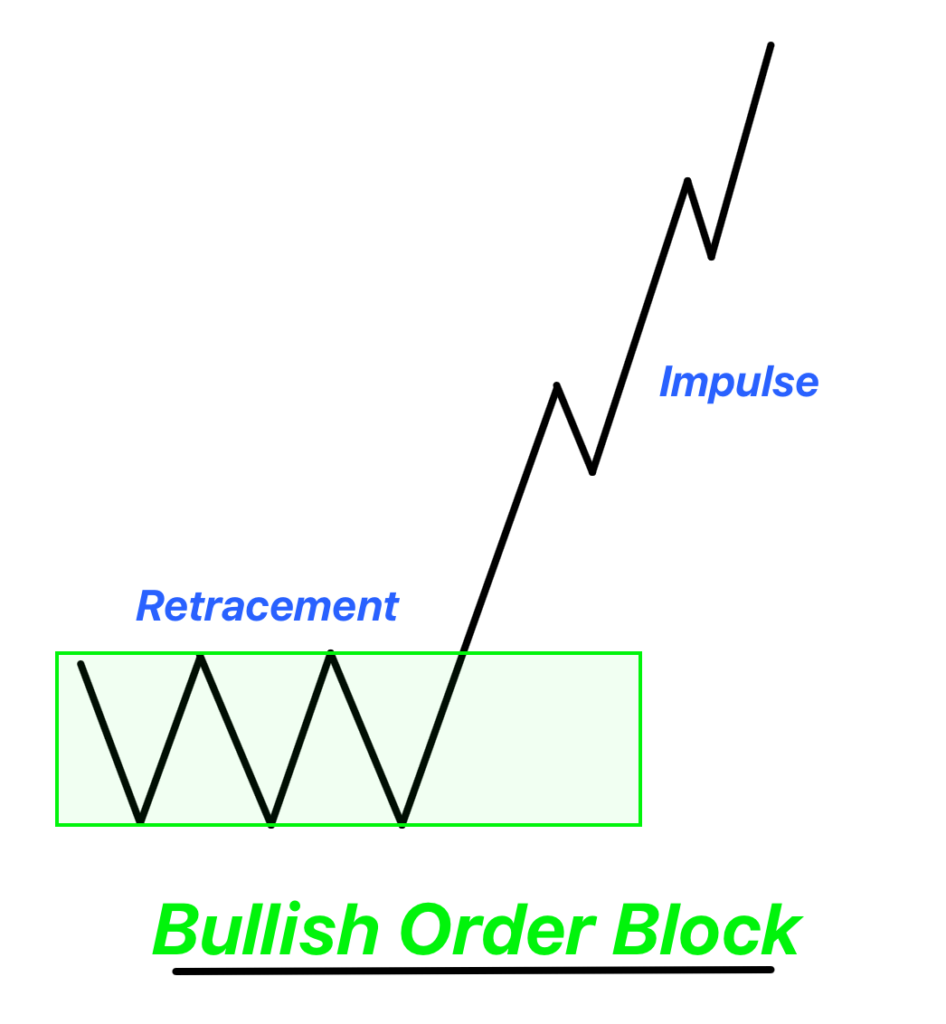
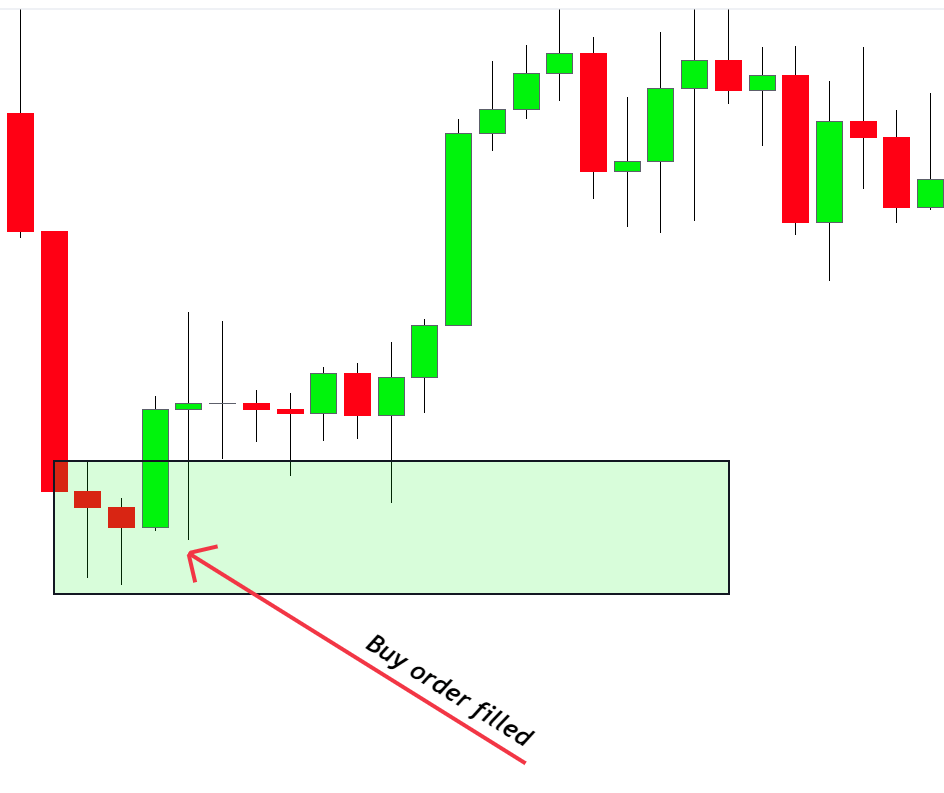
Order blocks in forex refer to the collection of orders of big banks and institutions in forex trading. The big banks do not just open a buy/sell order, but they distribute a single order into a check of blocks to maximize the profit potential. These chunks of orders are called order blocks in trading.
Types of Order Blocks
Order blocks are generally of two types:
Bullish Order Block: This forms after a bullish impulsive wave breaks a ranging market structure or block. When the price returns to this block zone, it’s an opportunity to open buy orders, aligning your trades with the institutions.
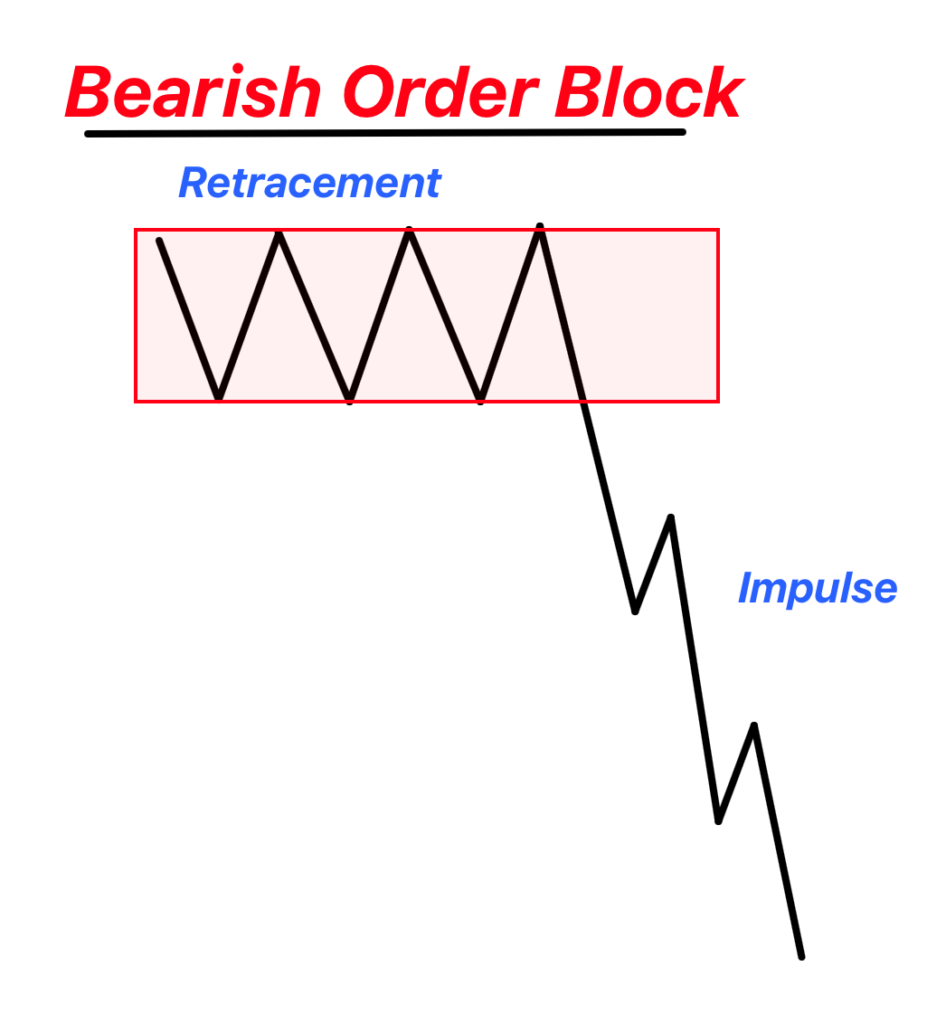
Bearish Order Block: This is formed after a bearish impulsive wave breaks the price range or block. When the price revisits this zone, it’s time to consider opening sell orders.
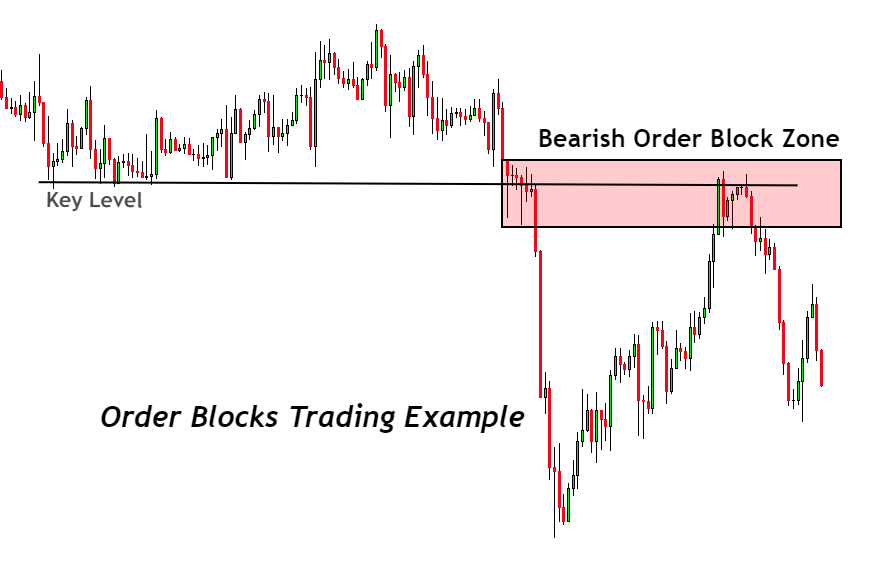
Drawing an Order Block Zone
To effectively draw an order block zone:
- Identify the Price Range: Find the range or block where the price has been moving horizontally.
- Mark the Highs and Lows: Note the highest and lowest points within this range.
- Draw the Horizontal Zone: Create a horizontal zone that includes these high and low points. This is your order block zone.
2. Supply and Demand
Supply and demand are like the heartbeat of the Forex market. Demand is all about how many buyers are looking to buy, and supply is about how many sellers are looking to sell. When there’s a lot of supply, prices tend to go down. When there’s a lot of demand, prices usually go up. If supply and demand are balanced, prices move sideways.
Identifying Supply and Demand Zones
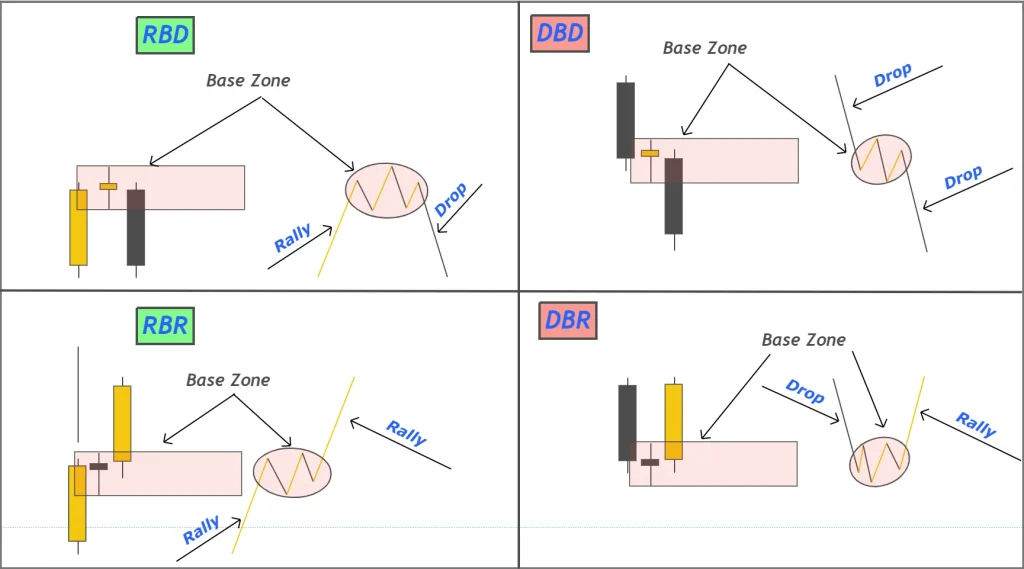
Supply and demand zones are all about finding the base regions on your chart. Price in Forex moves between these base regions. These movements are either ‘impulsive’ (showing market maker’s moves) or ‘retracement’ (showing where market makers might change direction).
In supply and demand trading, you’re basically looking for zones to open and close orders. There are four main patterns you’ll see:
- Rally Base Rally (RBR)
- Rally Base Drop (RBD)
- Drop Base Rally (DBR)
- Drop Base Drop (DBD)
Drawing Supply and Demand Zones
To draw these zones:
- Measure the Base Region Range: Look at the chart and find the range of the base region.
- Mark the High and Low Points: Note the highest and lowest points of this base region.
- Draw and Extend the Zone: Create a zone covering these high and low points, and extend it to the right on the chart.
3. Fair Value Gaps
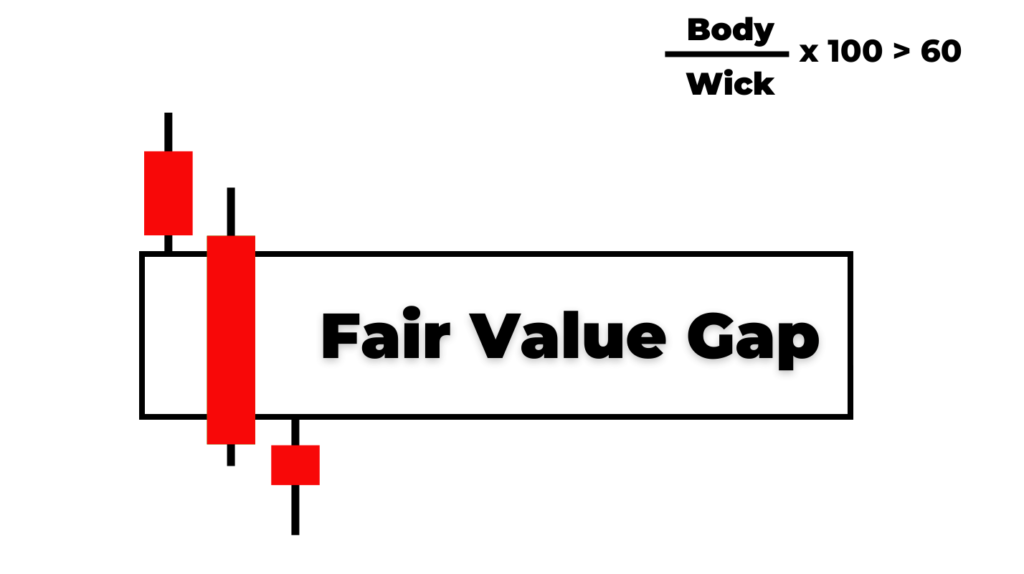
The fair value gap (FVG) is a key concept in Forex trading. It’s all about the difference between the current price of a currency and its ‘fair’ value. This gap often happens because the market isn’t perfectly efficient or because traders aren’t all acting on the same information.
To spot an FVG in technical analysis
- Look for a really big candlestick, bigger than the last 20 to 40 candles. It should have about 70% of its length as the body.
- Check the candles right next to this big one. They shouldn’t overlap much with it. A small overlap at the top or bottom is okay.
- The gap between the low of the candle before the big one and the high of the candle after it is your fair value gap.
Types of Fair Value Gaps
Fair value gaps come in two types:
Undervalued FVG: Here, the currency’s price is lower than it should be. You’ll see this as a big bearish (downward) candlestick. The price is expected to go up eventually to correct this.
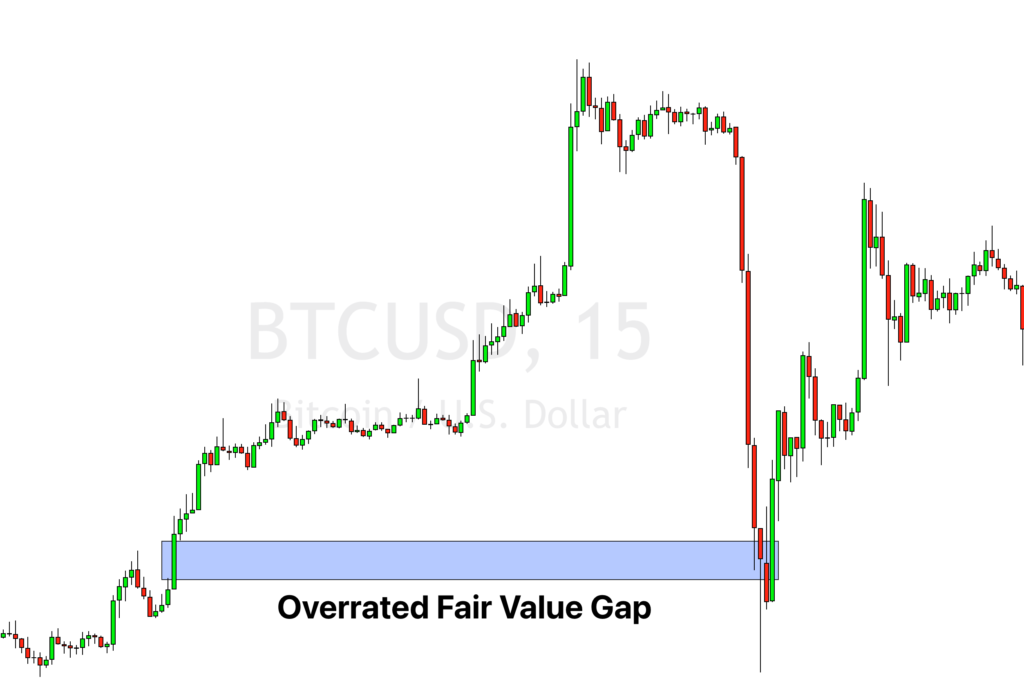
Overrated FVG: In this case, the currency’s price is higher than its fair value. It’s shown by a big bullish (upward) candlestick. The price will likely drop to fix this imbalance.

Drawing Fair Value Gap Zones
To draw these zones on your chart:
- For Undervalued FVG: Use the low of the candle before the big one and the high of the candle after. Draw a rectangle between these points and extend it to the right.
- For Overrated FVG: Use the high of the candle before the big one and the low of the candle after. Draw your rectangle here and extend it right.
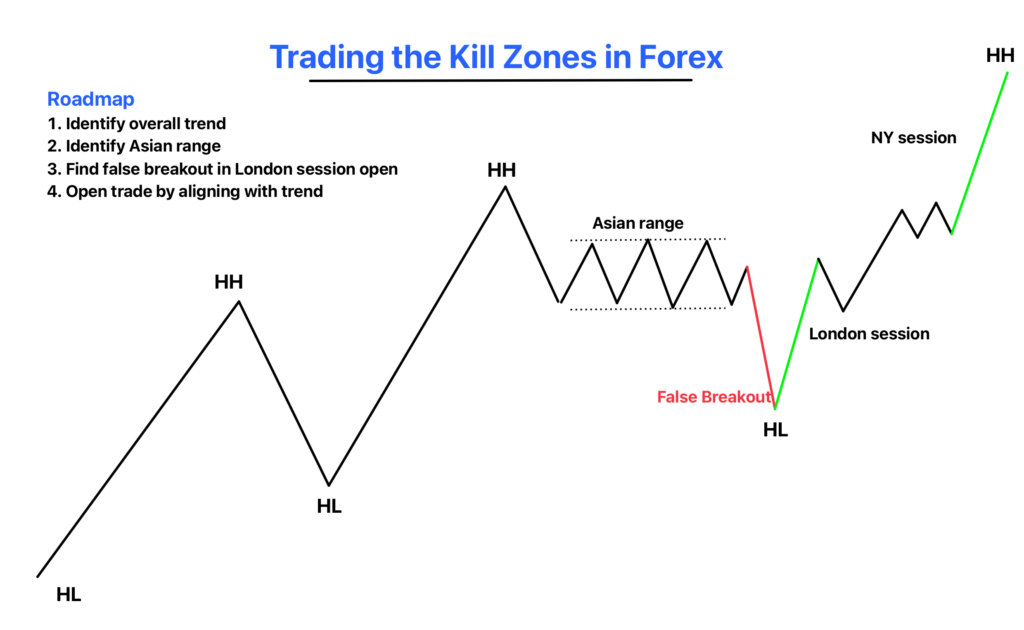
4. Kill Zones in Forex
In Forex, kill zones are those times during the day when the market is buzzing with activity. Not all hours are equal for trading. Sometimes the market is quiet, but during kill zones, it’s lively and full of opportunities for traders.
Understanding Market Sessions First, it’s key to understand the different forex market sessions. The market runs 24 hours, but it’s split into major sessions – each with its own trading characteristics.
- Asian Session (6 PM to Midnight New York Time): Known for lower volatility, this session is good for steady trends.
- London Open (2 AM to 5 AM New York Time): This is when things heat up with high liquidity and volatility. It’s prime time for big moves.
- New York Open (7 AM to 10 AM New York Time): Also very active, especially when it overlaps with the London session.
These are the times you’ll likely see the most action and have the best trading opportunities.
Identifying Kill Zones To spot a kill zone, you can draw a rectangle on your chart during each trading session. This rectangle covers the range from the lowest to the highest price in that session. This boxed area is your kill zone.
Kill zones are crucial because they’re when big market moves often happen. A lot of trading decisions are made during these active times. By focusing on these zones, you can better understand what the major players are doing and find good opportunities to trade.
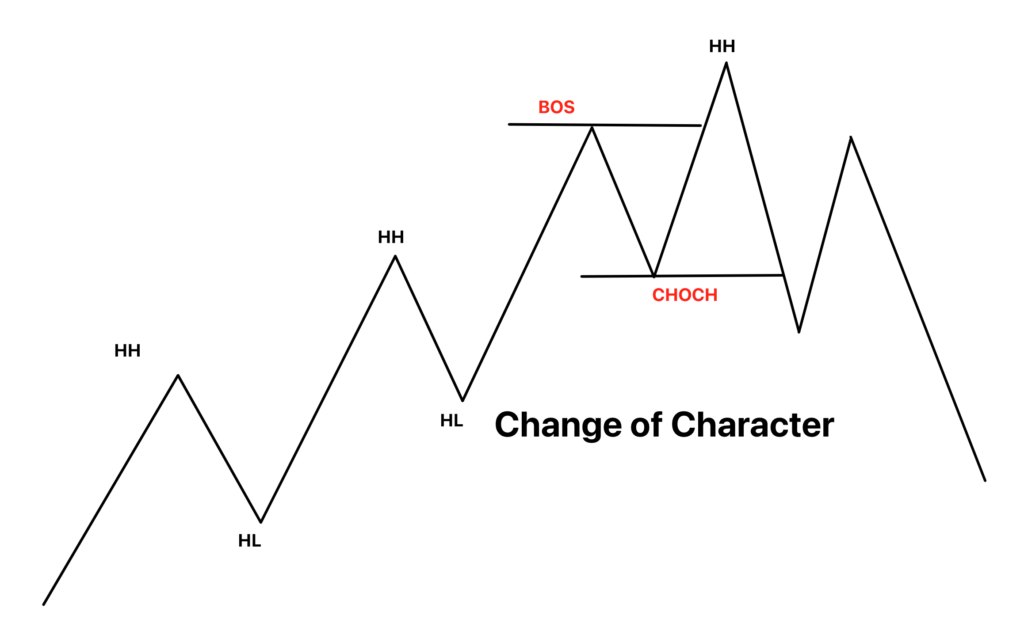
5. Change of Character (CHoCh) in Trading
In trading, the Change of Character (CHoCh) pattern signals a potential trend reversal in the market. This occurs after a break of key highs or lows. It’s quite similar to the Quasimodo pattern in its structure, though they are used in different trading strategies.
Identifying the Change of Character Pattern
To spot the CHoCh pattern on a candlestick chart, you need to follow these steps:
- Identify the Prior Trend: First, figure out the current trend direction. You can do this by looking at the highs and lows. For an uptrend, you’re seeing higher highs and higher lows. For a downtrend, it’s lower highs and lower lows.
- Break of Structure (BoS): This is where things start to shift. In a bearish trend, look for a break of a lower low. In a bullish trend, watch for a break of a higher high. This break of structure is a key signal that the current trend might be losing steam.
- Break of Lower High or Higher Low: After the break of structure, the price will usually move to reverse the trend. This means breaking the recent lower highs (LHs) in a bearish trend or higher lows (HLs) in a bullish trend. This break is your confirmation that the market character is changing.
- Trend Change: After these steps, you’ll typically see the trend begin to change. For instance, if the market was in a bullish trend, a change of character would mean it’s shifting to bearish.
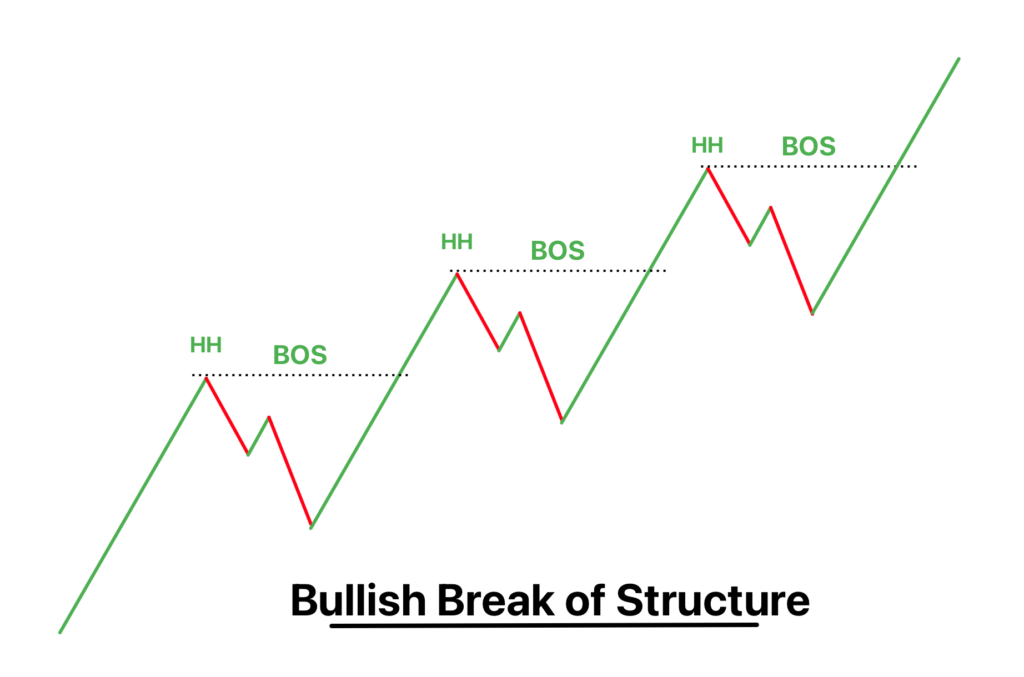
6. Break of Structure (BoS) in Trading
In trading, a Break of Structure (BoS) is a key signal that shows the market’s momentum and possible future direction. It happens when the price clearly moves past the established highs and lows of a trend, indicating a strong continuation of the current order flow.
Understanding Basic Market Structure
To grasp BoS, it’s essential first to understand the basic market structure. There are three main types:
- Uptrend: Prices consistently rise, creating new highs, and they don’t fall below previous lows.
- Downtrend: Here, it’s the reverse of an uptrend. Prices consistently fall, setting new lows without rising above previous highs.
- Range-Bound: Prices move up and down within a specific range without creating new highs or lows.
In uptrends and downtrends, the concept of BoS becomes crucial. It’s a clear indication that the current trend is strong and likely to keep going. However, in a range-bound market, BoS isn’t as relevant because the prices aren’t breaking past previous highs or lows.
Types of Break of Structure
BoS can be categorized based on the trend direction:
- Bull Break of Structure (Bull BoS): This happens when the price action breaks above a swing high in a trend. It shows strong upward momentum, suggesting that the bullish trend might continue.
- Bear Break of Structure (Bear BoS): In contrast, this occurs when the price action breaks below a swing low. It indicates strong downward momentum, pointing to the likelihood of the bearish trend continuing.
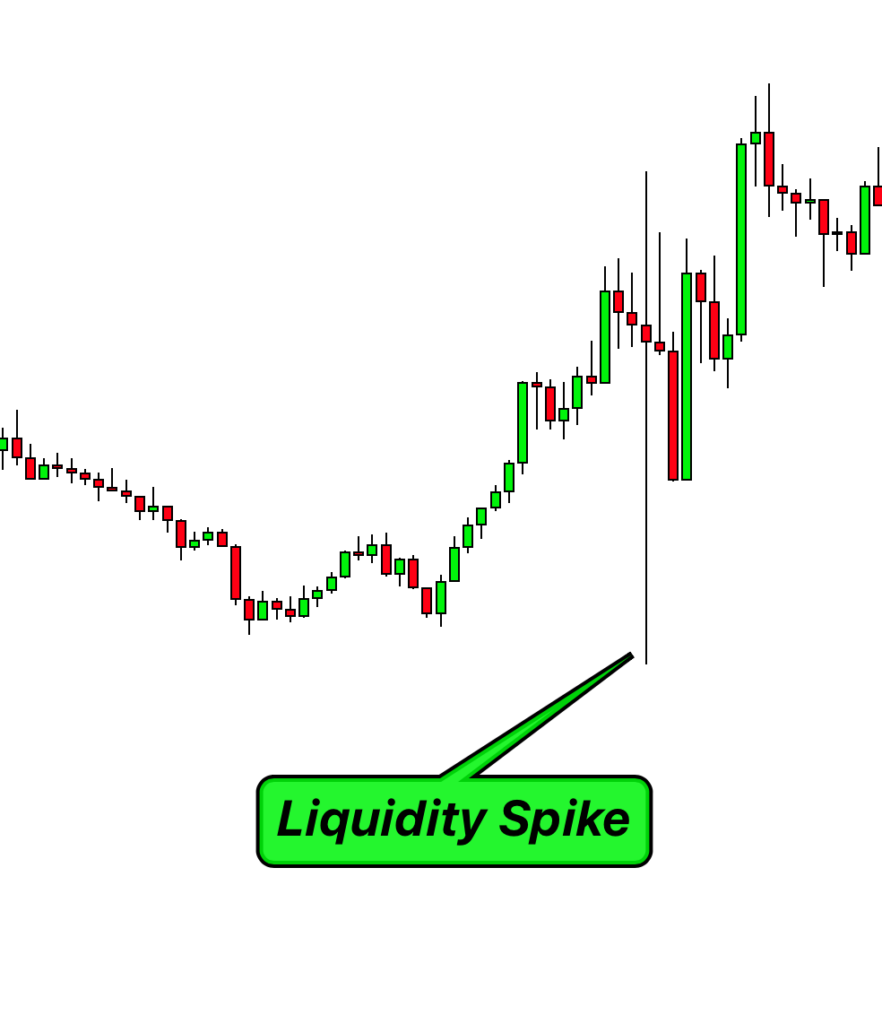
7. Liquidity Pools
In the world of trading, liquidity pools refer to areas in the market where there is a significant amount of trading activity. These are the zones where large orders are likely to be executed.
Why Liquidity Pools Matter
Liquidity pools are important for several reasons:
- Large Volume Trades: These pools often represent the locations where big players like institutional traders are likely to place their orders.
- Price Movements: Since these areas have a large volume of orders, they can significantly influence the direction of price movement.
- Target Areas for Traders: For retail traders, these pools can act as target areas for entering or exiting trades, as they offer potential for significant price changes.
How to Find Liquidity Pools
Identifying liquidity pools involves looking for areas on the chart where there is a high concentration of orders. Here are some tips to spot them:
- Look for Price Levels with Historical Significance: These include areas where the price has reversed or consolidated in the past. Historical support and resistance levels are often good indicators.
- Use Volume Indicators: Tools like Volume Profile can help identify areas where a significant amount of trading has occurred.
- Watch for Price Gaps: Sometimes, liquidity pools can be identified near gaps in the price chart, as these are areas where the market may move to fill the gap.
- Pay Attention to Psychological Price Levels: Round numbers or historically significant prices often act as liquidity pools because many traders place orders at these levels.
8. Stoploss Hunting Pattern
Stoploss hunting is when big traders in Forex make moves to hit the stop-loss orders of smaller traders. It’s like a game where the big players try to push the price to a point where many have set their stop-loss, causing a lot of selling or buying.
How to Identify Stoploss Hunting:
- Starts with a Big Move: First, look for a really big candle on the chart. This shows a strong move, either up or down.
- Highs and Lows Game: Next, the market will make a high and a low point. After that, it breaks the low, tricking traders into selling. But instead of continuing down, the price goes up and breaks the high. This hits the stop-losses of those who sold.
- False Reversals: When the price goes up, some traders think it’s changing direction and start buying, with stop-losses below the recent low. But then, the price drops again, breaking the low and hitting these stop-losses.
- Pattern Repeats: This up and down movement keeps happening, breaking highs and lows. It’s like the market is shaking out traders on both sides.
By understanding this pattern, you can better spot when big players might be trying to push the market to hit stop-loss orders, and you can plan your trades more wisely.
9. False Breakouts
False breakouts in Forex happen when the price appears to break through a key level (like support or resistance) but then quickly reverses direction. It’s like the market is faking a move, tricking traders into thinking a new trend is starting when it’s not.
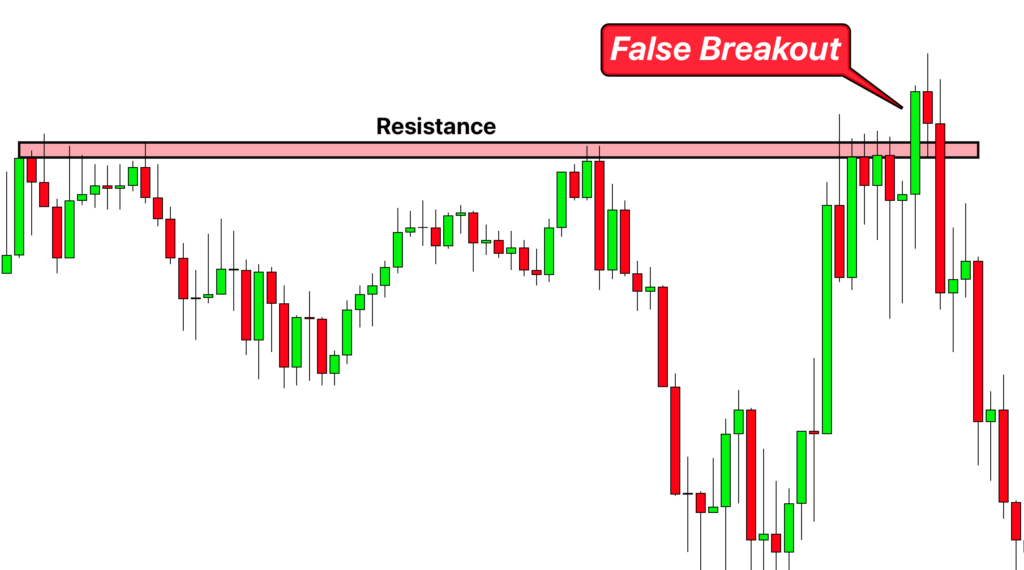
How to Identify False Breakouts:
- Watch Key Levels: Keep an eye on important support and resistance levels. These are the prices where the market has turned around before.
- Initial Break: Look for the price to break through one of these levels. This might seem like a big move at first.
- Quick Reversal: Here’s the catch. After breaking the level, if the price quickly reverses and goes back to where it was, that’s a false breakout. It’s like the market said “just kidding” and moved back inside its previous range.
- Confirmation: To be sure it’s a false breakout, wait for a candle or two to close. If they close back within the original range (before the breakout), it’s likely a false move.
By learning to spot false breakouts, you can avoid jumping into trades based on misleading market moves and make smarter trading decisions.
Conclusion
So, we’ve gone through the key smart money concepts in Forex trading. These ideas, like order blocks, fair value gaps, supply and demand zones, changes in market direction, structure breaks, liquidity pools, stoploss hunting, and false breakouts, are your guides to how big traders move in the market.
Think of these concepts as your trading toolkit. They help you see where the market might head next, where prices might turn, and if a trend is getting stronger or about to change. They’re your map in the world of Forex trading.
The insights into things like where big orders are waiting (liquidity pools), how big players might push prices to hit stop-losses, and how to spot when the market is just faking a move are super valuable. These are the moves that can trip you up, but now you know how to watch for them and use them to your benefit.
It’s all about practice and learning.