
Introduction
Bullish candlestick patterns refer to those candlestick patterns that cause the change of bearish trend into a bullish trend or continuation of the bullish trend.
These patterns help predict the market movement to earn decent profits from the financial market.
Before this article, we have learned to identify the perfect candlestick patterns on the chart. Now we will reveal only four bullish reversal candlestick patterns with a high winning ratio compared to other candlestick patterns.
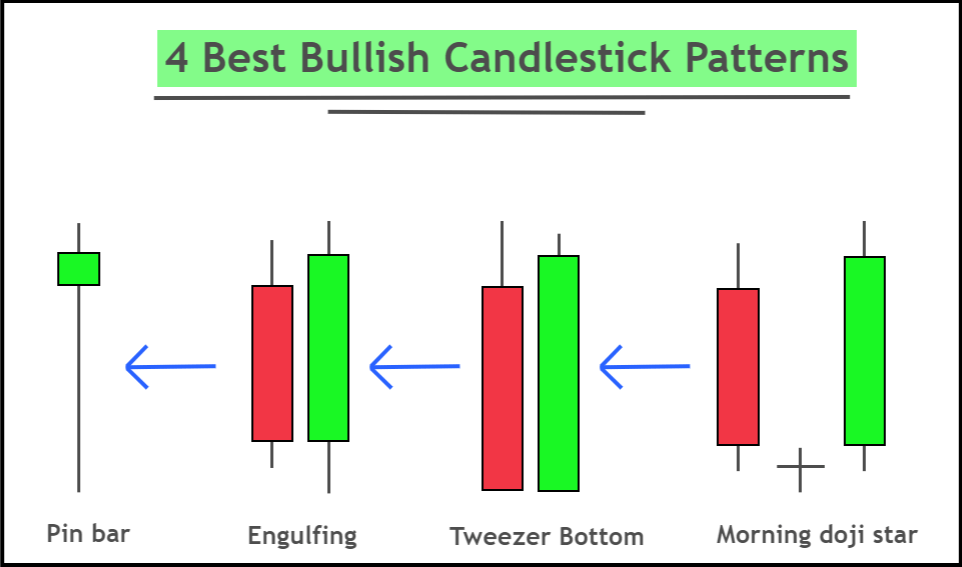
What are the top four bullish candlestick patterns?
These are universal bullish candlestick patterns because these patterns will work in technical analysis of any industry of the work, either foreign exchange or stocks. Because of this characteristic, these patterns are used by many retail traders to forecast the market.
Here I will explain a brief introduction of these candlestick patterns, but you can also read the complete article of respective patterns to learn in detail with a trading strategy.
Bullish Pin bar
The pin bar is a candlestick pattern with a long tail with a small body on the head of the candlestick. In the case of the bullish pin bar, the body will form at the top of the candle, and the lower section of the candlestick will represent the tail.
It shows that trend is about to change from bearish into bullish. That’s why pin bar candles mostly form at the end of the downtrend.
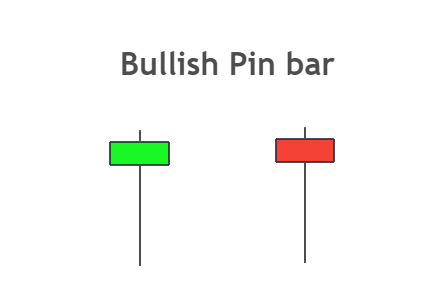
70 to 80% of candlestick’s total size will consist of shadow, and 20 to 30% will consist of body. It is a mandatory requirement that the body forms at the top of the candle and that the body to wick ratio should be less than 30% consistently.
The colour of the pin bar candlestick does not matter, but it is good practice to check that the pin bar should close within the range of the previous candlestick.
The long tail of the pin bar shows that sellers tried to decrease the price, but buyers were strong enough to overcome the forces of sellers and then pushed up the price. A bullish trend reversal will happen when this happens at a key support level.
Learn pin bar pattern in detail with a strategy.

Find High Probability Trades with this ADVANCED Candlestick Patterns Course
The Ultimate Candlestick Patterns Course That Will Help You To Trade Better
Bullish engulfing candlestick
Engulfing pattern consists of two candles in which the later candle will fully engulf the first candlestick. In bullish engulfing candlestick, the first candlestick will be bearish, and the second candlestick will be bullish. The bullish candlestick will make a higher high and a lower low.
It means buyers have fully engulfed the forces of sellers, and now the price will increase.
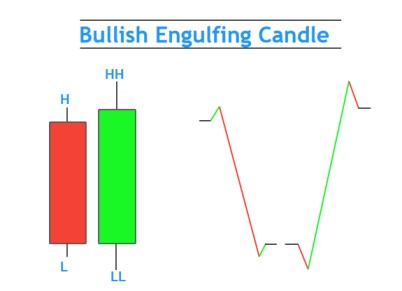
The body-to-wick ratio of both candlesticks in the engulfing pattern should be greater than 60% because the big body candlesticks show the market’s momentum.
It is a bullish trend reversal pattern that’s why it will mostly form at the end of the bearish trend.
The engulfing pattern is also the modified structure of the pin bar on the lower timeframe. Pin bar and engulfing pattern have the same trading psychology but there is a difference of timeframe and pattern structure only.
Learn bullish engulfing pattern in detail with a strategy.
Morning doji star
Morning Doji star consists of three candlesticks a bullish trend reversal pattern. It comprises a bearish candle, a Doji candle, and a bullish candlestick.
In this pattern, the body-to-wick ratio of the bullish and bearish candle should be greater than 70%.
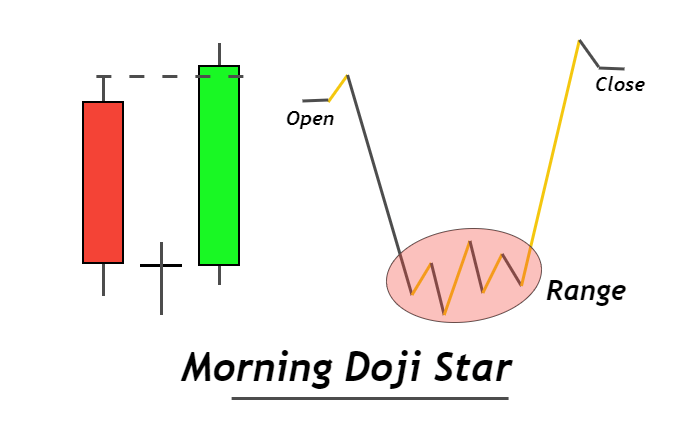
There is a complete logic behind this pattern. For example, when a bearish candlestick forms in a downtrend, it shows that sellers are continually decreasing the price, and now it is in an oversold state. A Doji candle will form then, showing that the bearish trend has been paused and the market is looking for further direction.
After trend pause, a big bullish candlestick will form, making new higher highs showing the start of a new bullish trend.
Learn Morning Doji star in detail with a strategy.
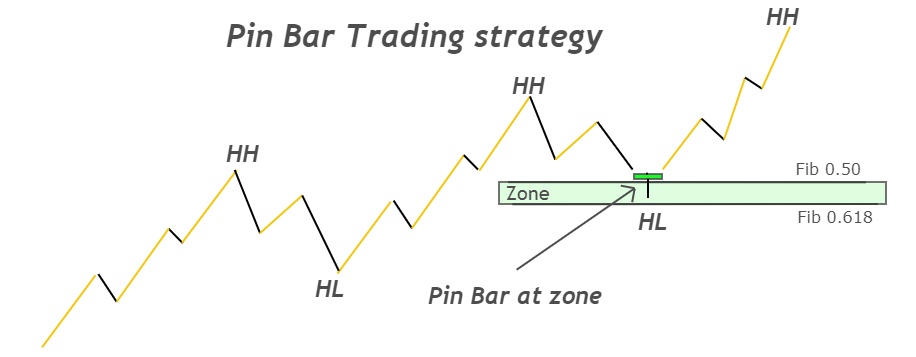
Pro Tip: A retail trader should always place a buy order at the end of the downtrend, during oversold conditions, or at the support level.
Tweezer bottom pattern
The tweezer bottom pattern consists of two candlesticks with identical structures from lower sides. In this pattern, the closing price of the first candlestick will be equal to the opening price of the second candle.
The first candlestick will be a bearish candle. The second one will be a bullish candlestick with no shadows on the lower side.
Look at the image below for a better understanding of this candlestick pattern.
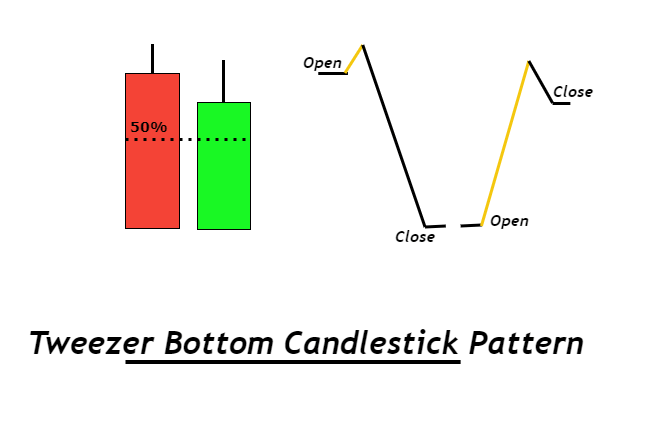
In tweezer bottom, the second candlestick should always close above the 50% level of the previous candlestick. It will form at the end of the bearish price trend. When the bullish candlestick closes above the 50% level, buyers have overcome the big hurdle one their way, and now the price will increase.
Learn Tweezer bottom in detail with a strategy.
Conclusion
The above candlestick patterns have the same trading psychology. The difference in the structure of these four candlesticks is because of the time difference.
If you analyze these patterns like a PRO trader, you will come to know that all the above four patterns will make a pin bar candle on a higher timeframe.
That’s why these are the best candlestick patterns and will work on the candlestick chart of every industry in this world.