
According to CME Group, nearly $80 billion of Crude oil is traded daily. Liquid gold is one of the most traded commodities in the world. It comes in the second spot, just behind Gold.
So, how can you get into the oil market?
One way to do that is by day trading crude oil. Fortunately, we have the best day trading strategy; a symmetrical trading pattern.
Why a symmetrical triangle pattern, you ask? It’s because the crude oil chart frequently forms a symmetrical triangle pattern, and it is highly effective.
So, stick to the end and find the crude oil day trading strategy.
Best trading pattern for crude oil
When talking about day trading strategy, one of the best ways to do it is by finding a trading pattern. One such pattern is a symmetrical triangle.
The pattern was first introduced in the 1948 Technical Analysis of Stock Trends by John Magee and Robert D. Edwards.
The symmetrical triangle pattern forms when there is market consolidation, i.e. when there is indecision. The price breaks during this time, creating lower highs and higher lows.
You can mark those higher lows and lower highs by drawing upper and lower trendlines. When the trendlines get closer, they form a triangle.
The pattern act as a continuation pattern, and whenever the price breaks the upper or lower trendlines, it presents an entry point. You need to know that the pattern does present market reversals, but mostly it’s a false breakout.
The symmetrical triangle pattern is also called the wedge pattern, and in the earlier stages, it looks like a pennant pattern.
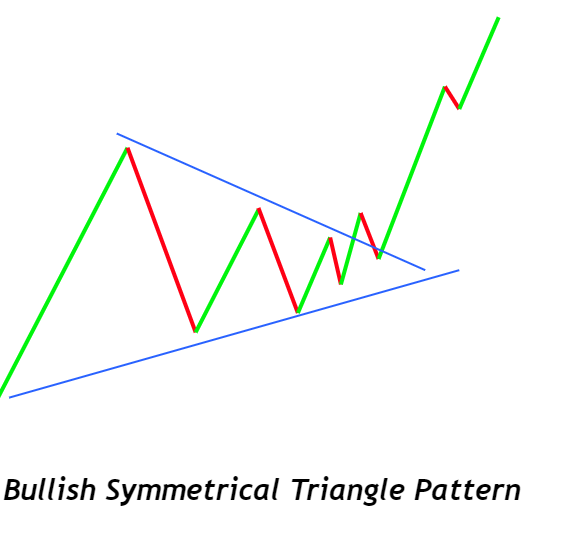
Bullish symmetrical triangle pattern
The bullish symmetrical triangle pattern is a bullish continuation pattern and forms when the price breaks through the upper trendline.
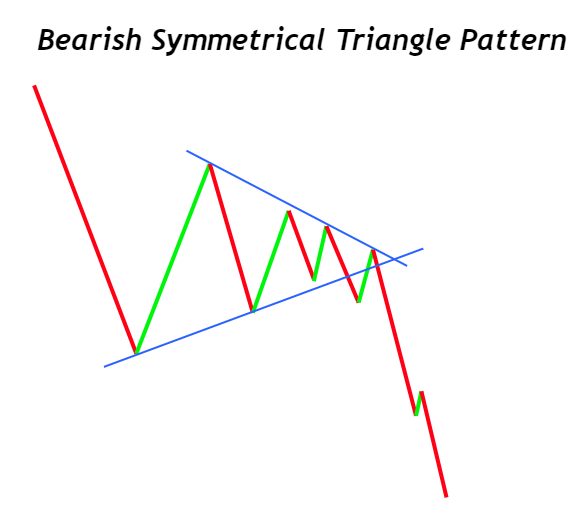
Bearish symmetrical triangle pattern
The bearish symmetrical pattern appears when the price breaks through the lower trendline and acts as a continuation pattern.
What does the symmetrical pattern tell traders in crude oil trading?
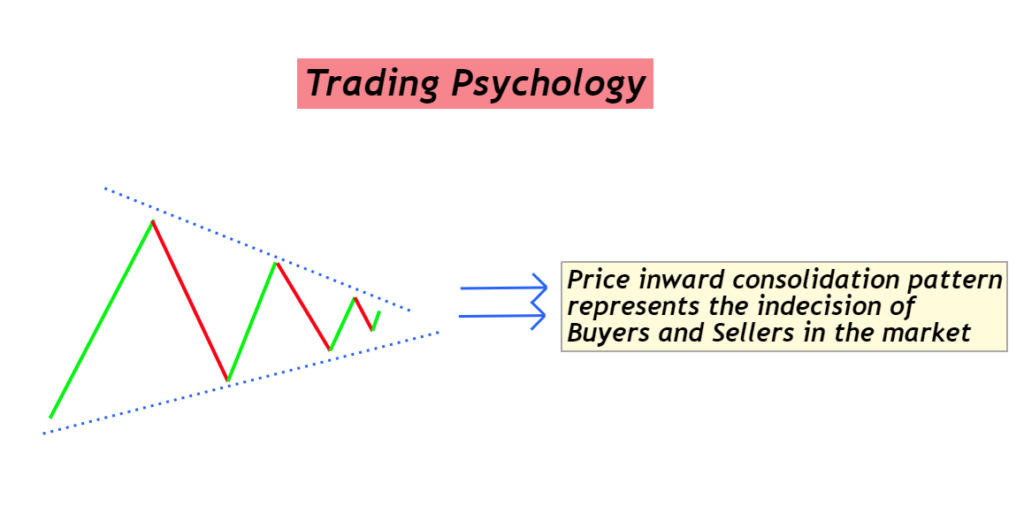
Whenever the market creates higher lows and lower highs, it signifies indecision. Neither buyers nor sellers are creating a strong trend.
Sellers create lower highs, while buyers make higher lows. The tussle between the buyers and sellers puts the trend in a stalemate. When both the trendlines (upper and lower) get closer, it suggests a breakout, and eventually, the price will break out.
When the price breakouts, you can enter long or short.
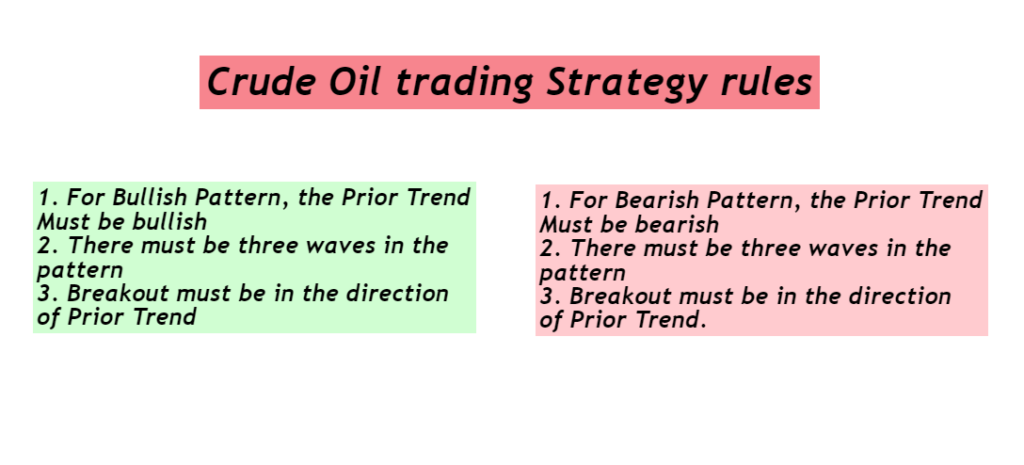
3 rules to trade crude oil
You must follow certain rules when day trading crude oil with the symmetrical triangle pattern.
You need to enter the trade only when these rules are satisfied. It’s because there is a lot of indecision, and trends can go in either direction. So, you have to wait and look for these clues.
For a bullish symmetrical pattern,
- The previous must be bullish.
- There should be three waves in the pattern.
- The price breakout must be upwards.
For a bearish symmetrical pattern,
- The previous trend must be bearish.
- There should be three waves in the pattern.
- The price breakout must be downwards.
Here’s something interesting about the pattern. If a price breaks out of the triangle but doesn’t move more than 5% and comes back to the level, you can take the new trade opposite the original breakout’s direction.
However, it doesn’t happen frequently, and the price moves in the original direction of the breakout.
Crude oil strategy
As mentioned above, you need to follow certain rules for trading with the symmetrical triangle pattern. Additionally, it is important for the break to happen. Attempting to guess the breakout’s direction is risky, so wait for the breakout to happen and then enter the trade.
Let’s give a live example and implement the crude oil strategy with a symmetrical triangle pattern.
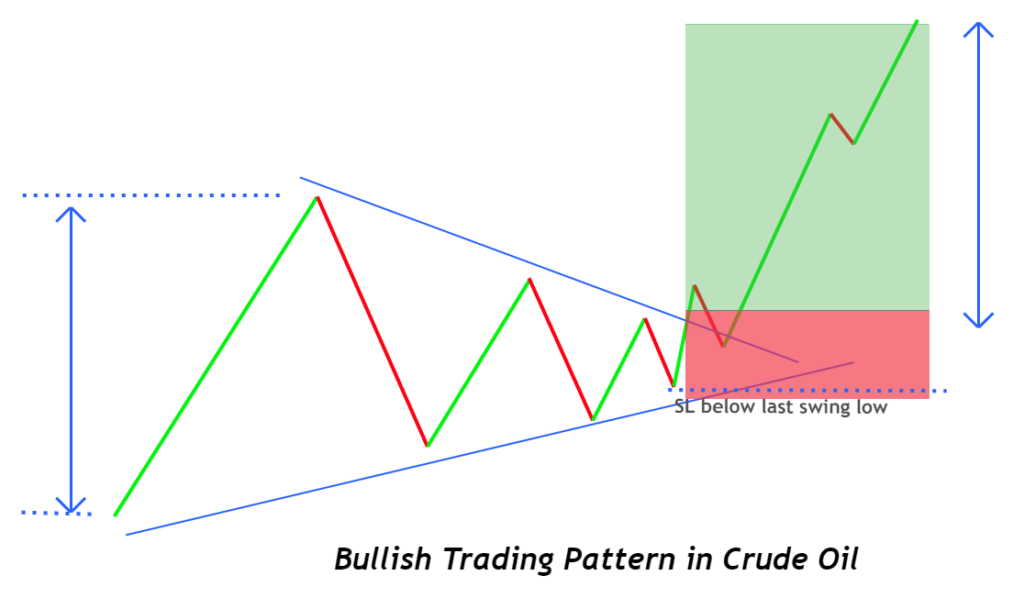
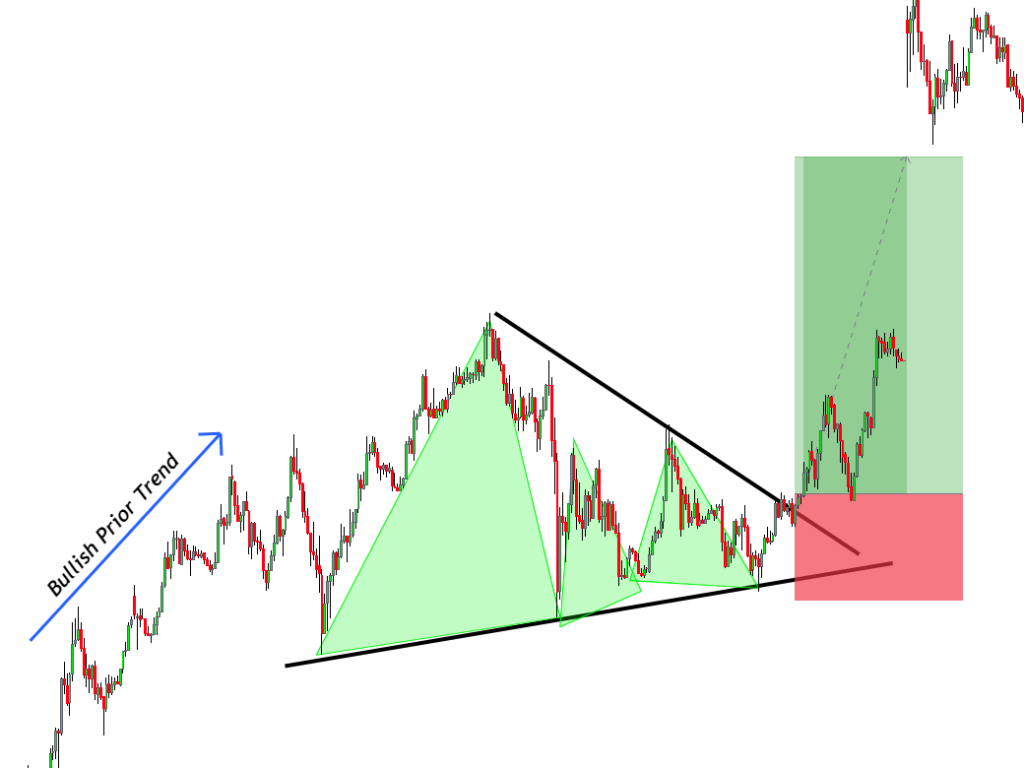
On the chart below, you can see a bullish symmetrical triangle pattern. We need to satisfy the rules first.
The prior trend is bullish, there are three waves, and the price breakout upwards. So, we can enter the trade after the price breaks above the upper trendline.
For setting take-profit, you can set it equal to the distance from the high and low of the earliest part of the pattern from the breakout point. You can place the stop-loss below the latest swing low.
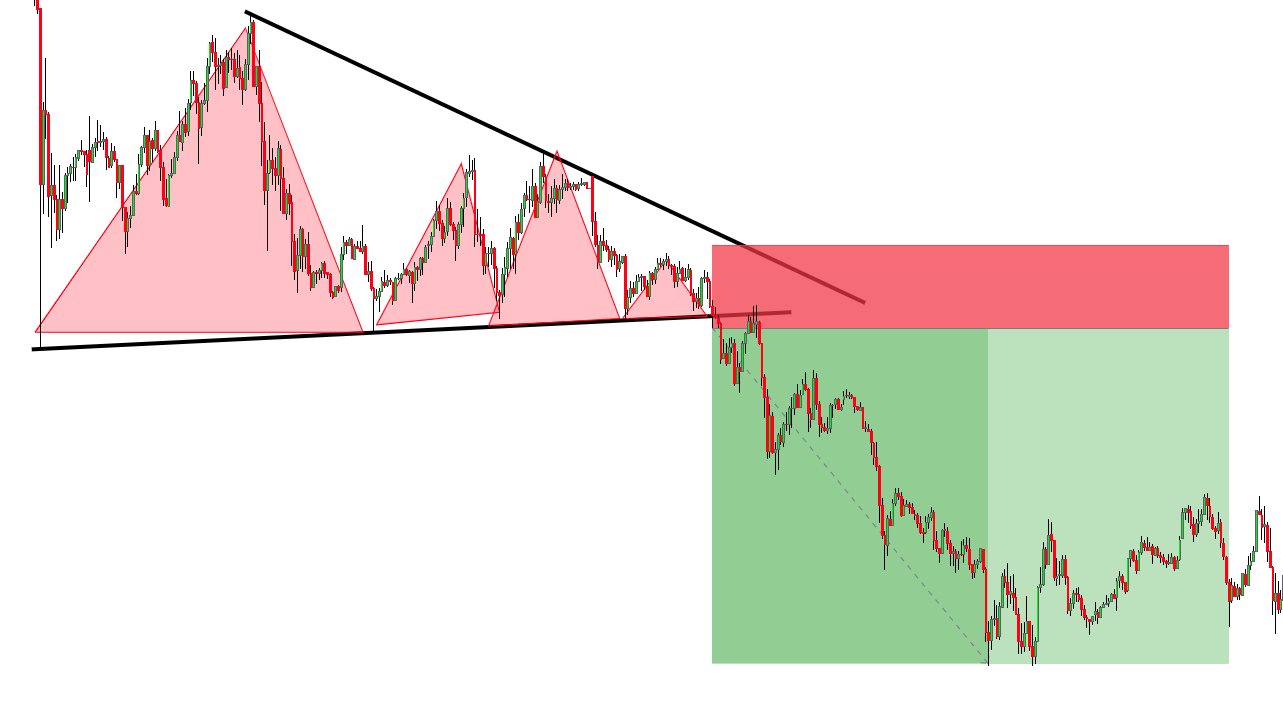
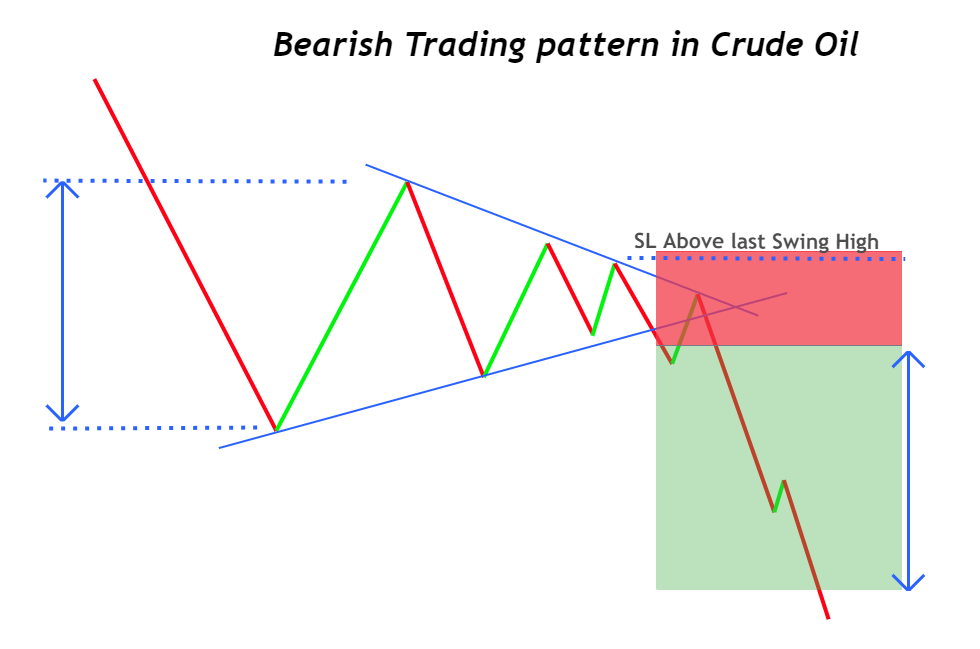
Let’s try a bearish example. On the chart below, you can see a bearish symmetrical triangle pattern.
We had satisfied the rules and entered when the price broke the lower trendline. We set our TP equal to the distance from the high and low from the breakout point and placed our SL at the recent high.
Buy signal
- Locate the symmetrical triangle pattern in an uptrend.
- Wait for the price to break above the symmetrical triangle pattern.
- Set a stop-loss at the recent swing low from the breakout point.
- Set TP equal to the distance of high and low from the breakout point.
Sell signal
- Locate the symmetrical triangle pattern in a downtrend.
- Wait for the price to break below the symmetrical triangle pattern.
- Set a stop-loss at the recent swing high from the breakout point.
- Set TP equal to the distance of high and low from the breakout point.

Conclusion
A symmetrical triangle pattern is highly effective for day trading crude oil. The pattern frequently occurs on the chart and acts as a solid continuation pattern. You just need to follow certain rules when trading with the pattern.
Frequently Asked Question
Yes, crude oil does present good trading opportunities throughout the day. When you trade with patterns like a symmetrical triangle, day trading crude oil becomes more effective.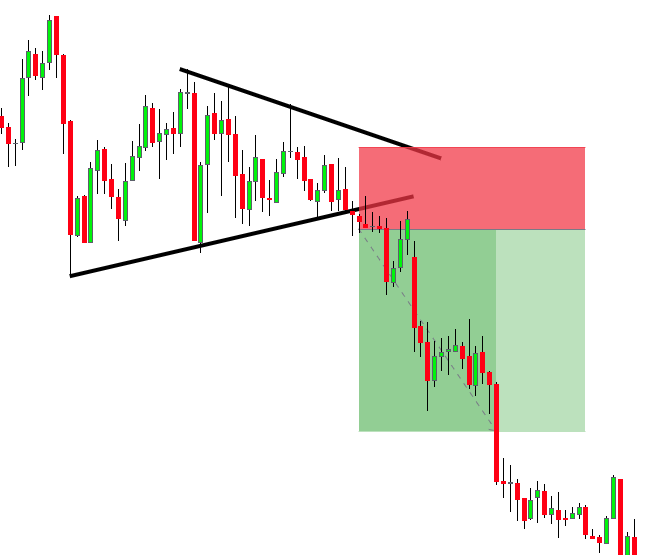
Although you can trade the crude oil on smaller timeframes, it’s best to trade on higher timeframes like daily or weekly. The pattern can extend for many weeks or even months.
You can use a symmetrical trading pattern for scalping. The best way is to locate the pattern on higher timeframes and trade.