
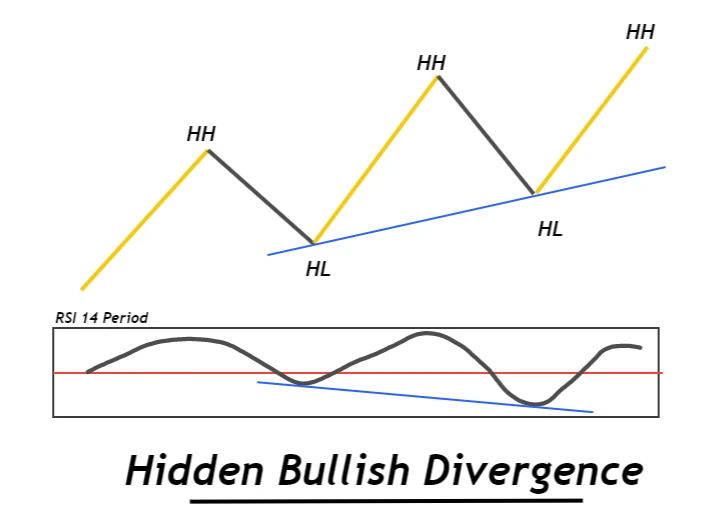
What is Hidden bullish divergence
Hidden bullish divergence refers to a bullish trend continuation signal in which the oscillator forms Lower lows but the price makes higher lows on the chart in trading.
Price and Oscillator value both shows divergence on the chart instead of convergence. Price forms a New Higher Low whereas the Oscillator value makes a lower low. This hidden divergence indicates that price will continue its bullish trend.
Why hidden divergences are more important?
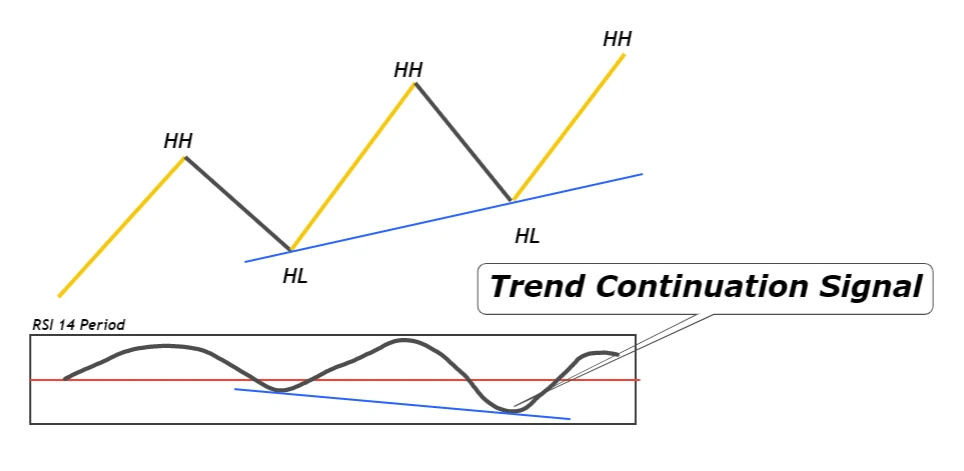
Hidden divergences in an oscillator are considered more valuable than simple divergences. Because hidden divergences show a trend continuation signal. Trading with the trend is far better than trading against the trend.
Most of the indicators and regular divergences indicates trend reversals in the price of a security. But there are many risks of losing your money in trading trend reversals. Market makers are always looking for a space to give false trend reversal signals and they hunt stop losses of retail traders by using these strategies.
So, use a hidden divergence indicator to trade with the trend in a very simple way.
How to find out hidden bullish divergence on chart?
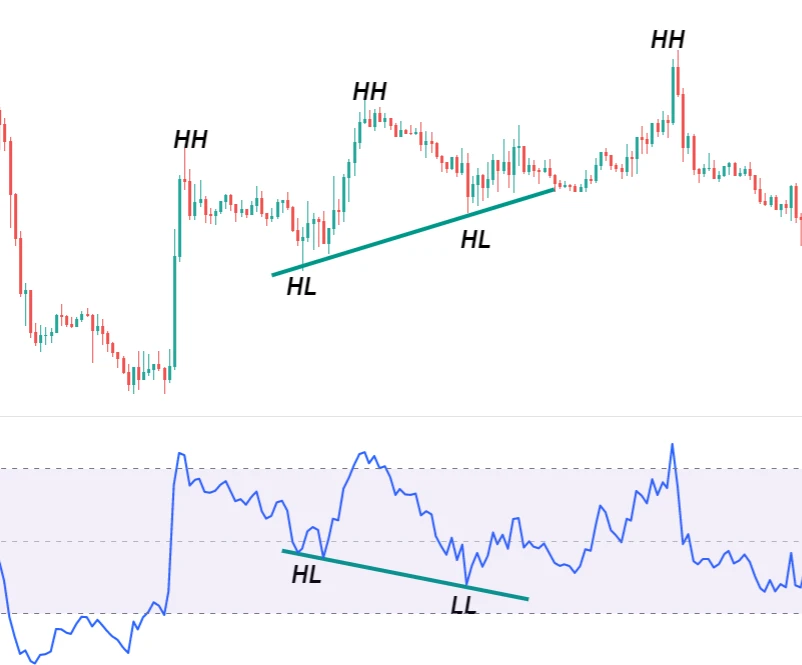
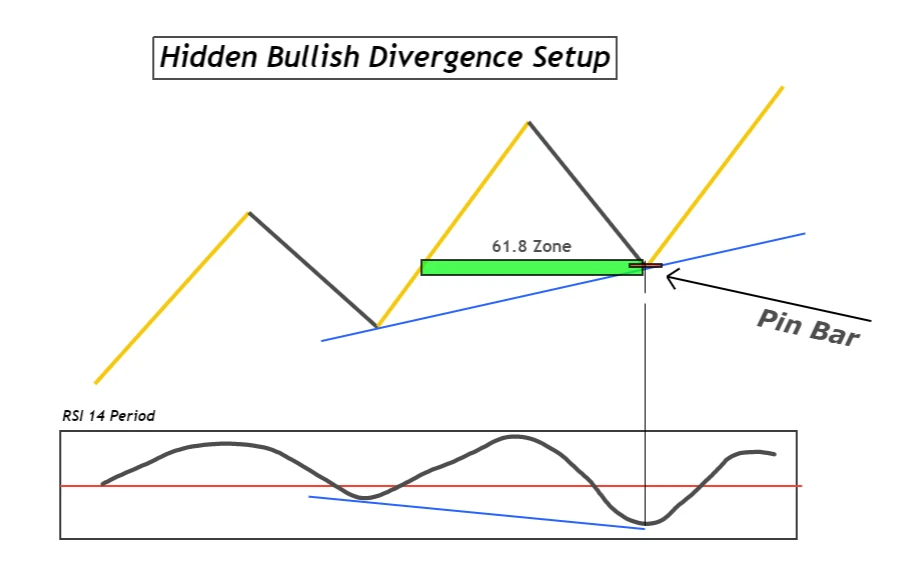
To identify hidden bullish divergence on the chart, add an oscillator to the chart of a security/currency pair. I will recommend you add the relative strength index RSI indicator to the chart and adjust the period of indicator to 14. 14 time-period is the optimum value for the RSI indicator.
Now mark the swing points on the price and oscillator. Swing points mean the formation of points after the completion of a valid swing wave. You should not include small points within a wave to identify hidden divergence. Use one complete wave on the chart and one complete wave of the oscillator to spot divergence.
The third step is to do trend analysis by marking higher highs and lower lows on the price of a security and RSI indicator
Draw one line meeting the two swing points on the price chart and the second line meeting the two points on the oscillator. This line is just to make the divergence clear. The slop of the line will show hidden divergence.
If price forms a higher low on the chart whereas the RSI indicator forms a lower low, then you spot a hidden bullish divergence
The main point here is to look for clear swing points and wait for a large divergence.
Best oscillators to identify hidden divergence
Selection of the best tool to identify hidden divergence on the chart is also important. Here is the list of the top three indicators that can be used in trading.
- Relative strength index (RSI) indicator
- MACD indicator
- Stochastic Oscillator
I will recommend you use the RSI indicator for spotting divergence. Remember that you should use only one indicator at a time. Using more than one indicator will make things more complex. I will describe a strategy to use hidden divergence with price action for trading.
How to trade Hidden bullish divergence?
In this topic, I will explain the method to trade hidden bullish divergence with price action. You will not be able to trade divergence along without any other confluence.
Why should you not trade hidden bullish divergence alone?
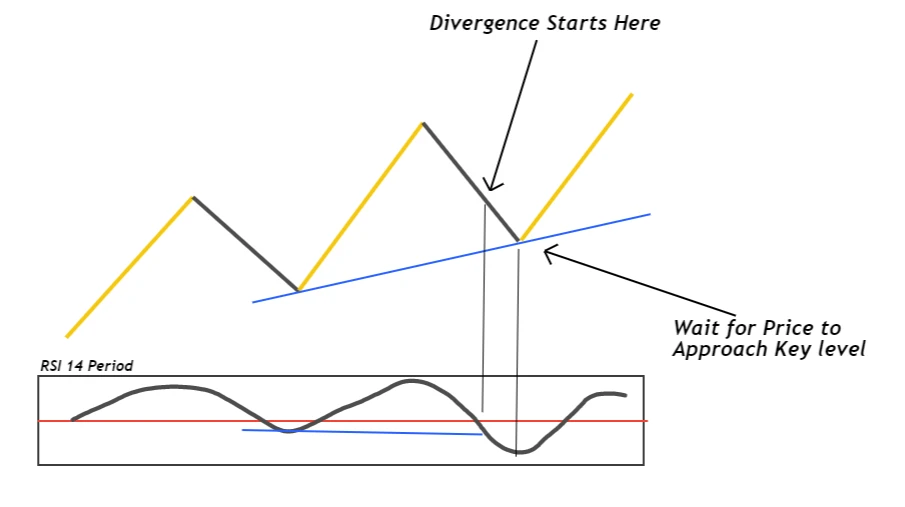
In divergence trading, you obviously don’t know how far or how large divergence will be! You don’t know. So, you will not be able to add a fixed stop loss. If you will add a wide stop loss, then it will hit the risk management.
Look in the image below for a better understanding.
So, what’s the solution to this?
The solution is to add a confluence to trade hidden bullish divergence. Confluence means the addition of price action patterns like candlesticks, chart patterns, support/resistance levels and supply and demand zones.
Hidden bullish divergence trading strategy
The confluence consists of two parameters
- Bullish candlestick patterns
- Support / Demand zone
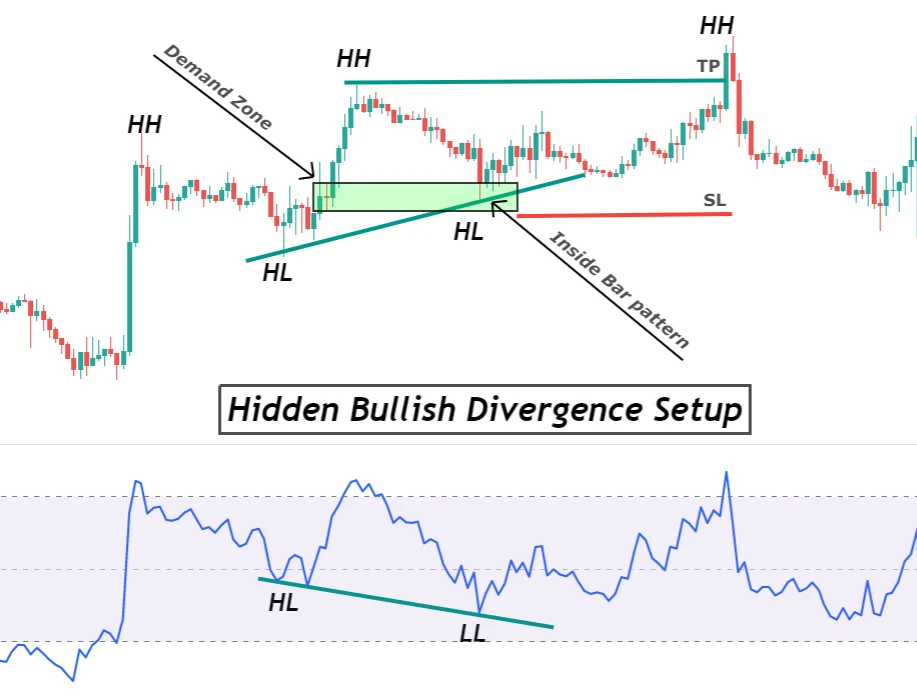
The logic behind this strategy is that when a divergence forms on the oscillator, then you will wait for the price on the chart to come to a strong support zone. There are higher chances of price reversal from the support zone that’s why I have added this as a confluence. Also, it will help us to add a fixed tight stop loss.
Follow the following steps to trade hidden bullish divergence.
- Identify hidden bullish divergence on the chart and mark it.
- On the price chart, draw strong support zones and use Fibonacci retracement tool to detect strong key levels.
- Wait for the price to come to the support zone and analyze the price action on the support zone by formation of a bullish candlestick pattern on support zone.
- After candlestick pattern confirmation, place a buy stop order above the high of candlestick and place stop loss always below the low / below the support zone.
- Take profit level will be at the last higher high made by the price. You can also extend the TP level by using Fibonacci extension tool.
This is the simple trade setup of hidden bullish divergence. It works and it will always work if you will trade divergence with a proper confluence. Trading hidden divergence alone will not make you a profitable trader but it will hit your psychology because of trading without stop loss.
Conclusion
Hidden bullish divergence is the best leading indicator after price action trading. If you will combine both leading indicators, you will get better results in trading.
This is the best and simplest way for trend trading. It is very difficult to spot trend continuation, but hidden bullish divergence makes it easy to spot.
You can use any oscillator to detect it on the chart, but my recommendation is to use the RSI indicator always.
Make sure to backtest the hidden bullish divergence strategy properly before using it for live trading.
FAQs
Hidden divergence is better than regular divergence because hidden divergence helps us to trade with the trend while regular divergence tells us about the trend reversal. As we trade with the trend only / with market makers. So hidden divergence is better.
hi,
i have a question
As you are saying, Hidden Divergences are a Trend Continuation.
is there a difference if a BULLISH HIDDEN DIVERGENCE happens in an Downtrend or Uptrend ?
Will a Bullish Hidden Divergence in an Downtrend lead to Trend Continuation (=further Downtrend)
Or will only a Bearish Hidden Divergence in an Downtrend lead to a continuation in the Downtrend ?
Thank you so much
regards
Andre