
Introduction
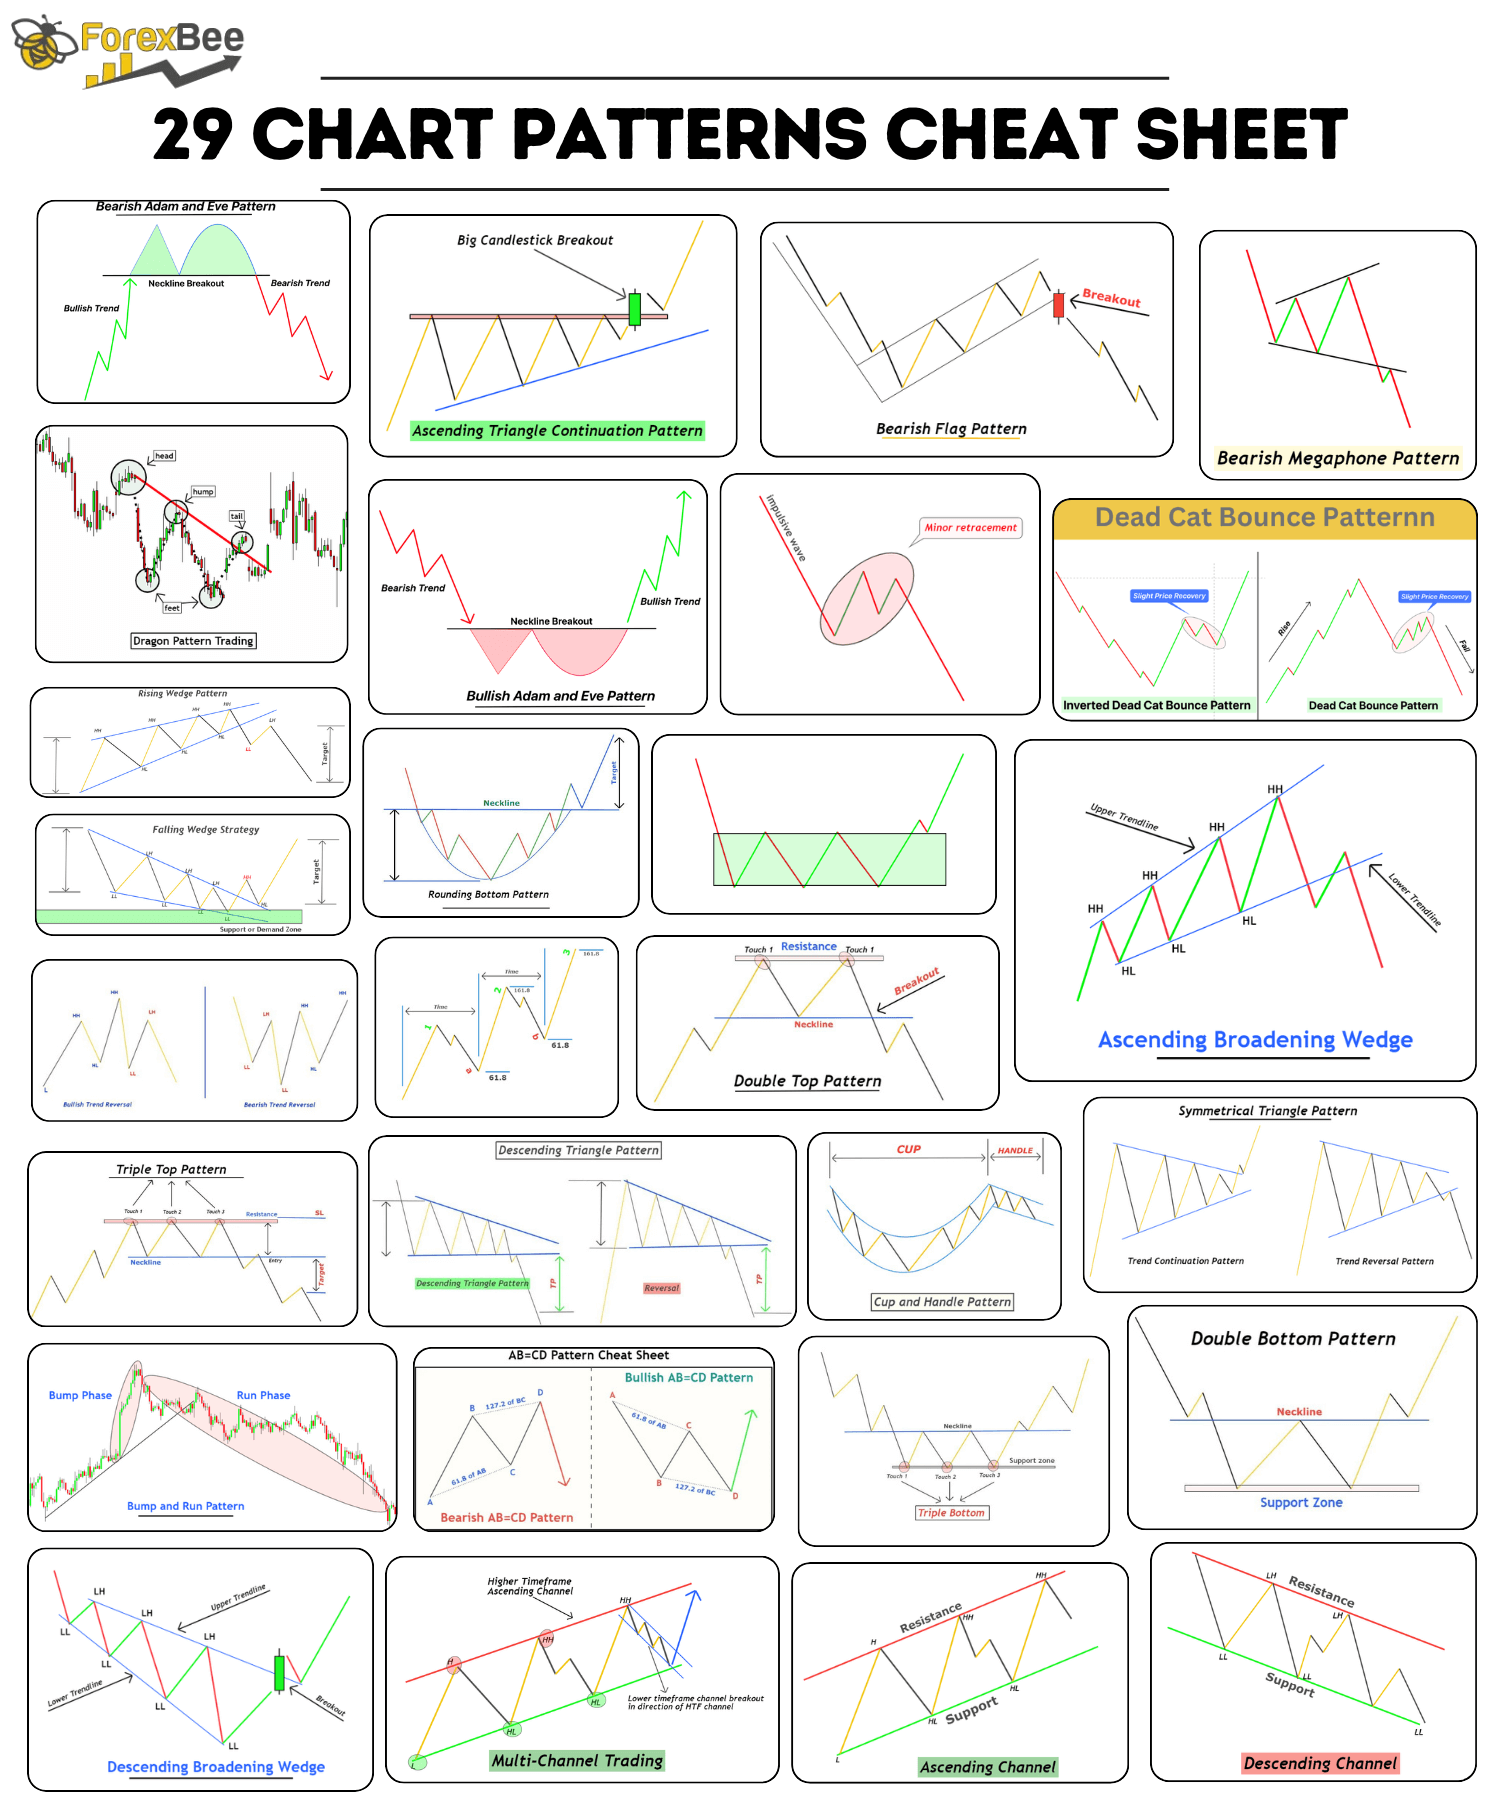
In the chart patterns cheat sheet, 29 chart patterns have been explained by expert trader. These patterns have a high winning ratio because we have added proper confluences to each pattern to increase the probability of winning in trading.
You can also learn each pattern in detail by clicking the learn more button below each chart pattern.
What are chart patterns?
Chart patterns1 are visual representations of price movements in financial markets, like stocks, currencies (forex), or commodities. These patterns are formed when prices on a price chart create recognizable shapes or formations. Traders and analysts use these patterns to predict future price movements and make trading decisions.
Types
Chart patterns are divided into two main categories:
- Reversal Patterns: These patterns suggest that a current trend is likely to reverse or change direction.
- Continuation Patterns: These patterns suggest that the current trend is likely to continue after a brief consolidation or pause.
List of 29 Chart Patterns
1. Megaphone Pattern
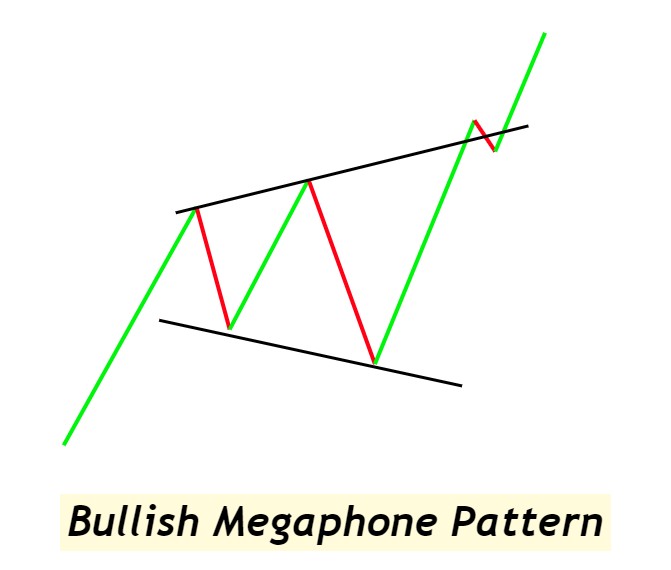
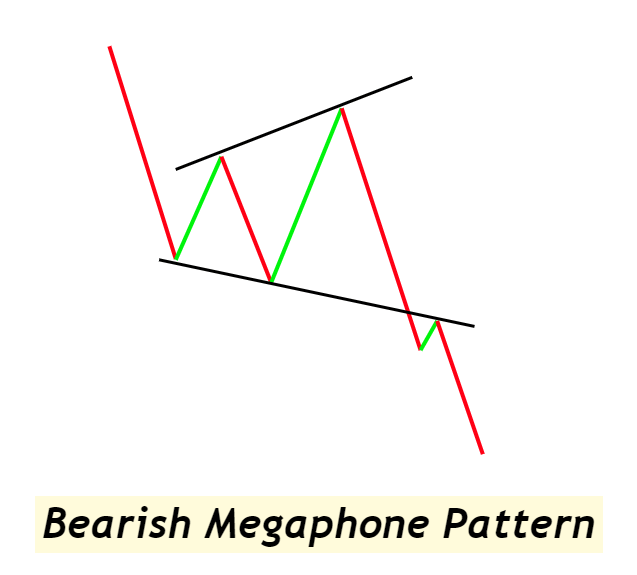
The Megaphone Pattern, also known as a broadening formation, is characterized by a series of higher highs and lower lows that expand over time, resembling the shape of a megaphone. This pattern reflects increasing volatility and can serve both as a continuation and a reversal signal in the market.
Types and Forecast:
Bullish Megaphone: This variant forms when the price action breaks above the upper boundary of the expanding channel. Traders often look for entry opportunities at the completion of the fifth swing, anticipating a continuation of the uptrend.
Bearish Megaphone: The bearish counterpart emerges when prices fall below the lower trendline of the formation, suggesting a potential downward move. This offers a cue for a short position at the breakdown point following the fifth swing.
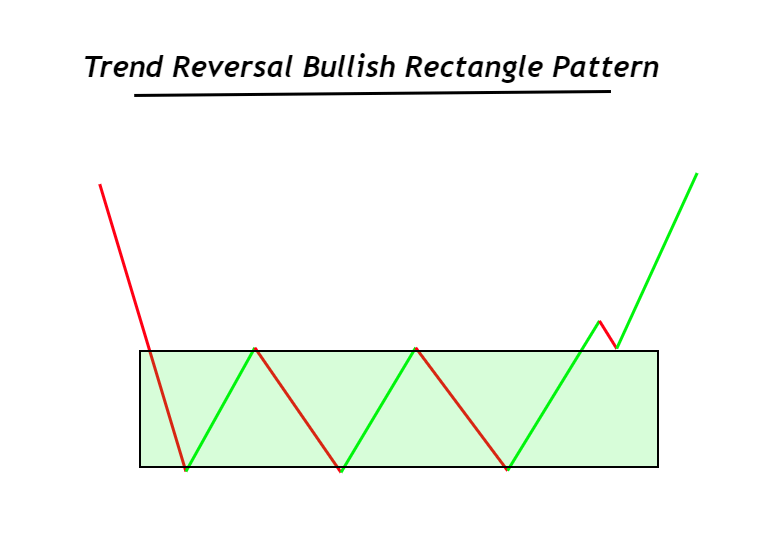
2. Bullish Rectangle Pattern
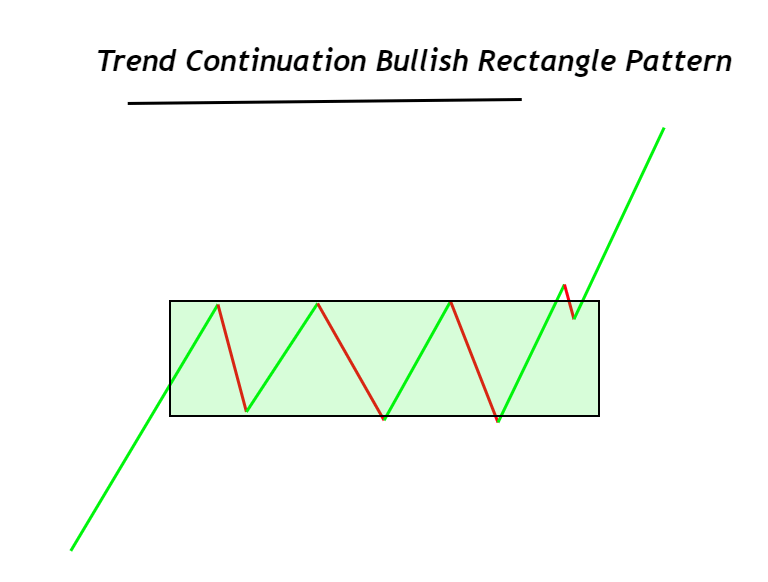
The Bullish Rectangle Pattern is identified by a price consolidation phase where the price moves sideways, bounded by parallel support and resistance levels, creating a rectangular shape on the chart. This pattern signifies a pause in the prevailing trend, with a potential bullish breakout indicating the continuation or reversal of the trend.
Types and Forecast:
Trend Continuation Rectangle: This type forms during an ongoing bullish trend and signals that the trend is likely to resume after a period of consolidation. It is characterized by a series of equal highs and lows. Traders consider this a high-probability setup due to its alignment with the existing bullish momentum.
Trend Reversal Rectangle: Occurs after a downtrend and suggests a potential reversal to an upward trend. This pattern can be more challenging to trade due to the possibility of false breakouts and requires careful confirmation, typically through a significant bullish candlestick breakout, to validate the change in market sentiment.
3. Bump and Run Pattern
The Bump and Run Pattern, conceptualized by Thomas Bulkowski, is a two-phase chart pattern that signals a potential price trend reversal. It starts with a lead-in phase (the trend before the bump), followed by a bump phase (a sharp, unsustainable price move), and concludes with the run phase (a trend reversal).
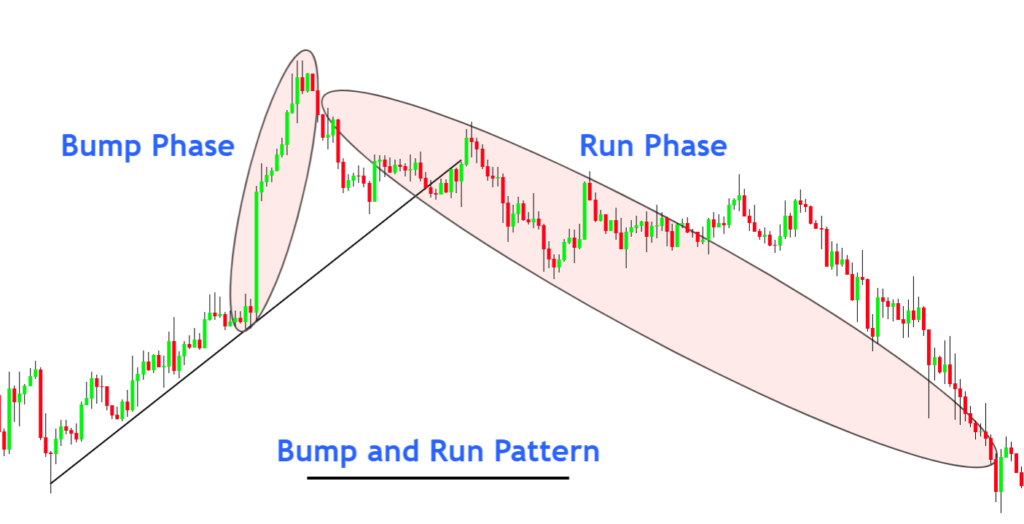
Types
Bullish Bump and Run: Occurs after a bearish bump phase, indicating a bullish trend reversal. The price breaks above the trendline established during the bump phase, signaling the start of a new upward trend.
Bearish Bump and Run: Follows a bullish bump phase and signals a bearish trend reversal. The price breaks below the trendline, suggesting a downward price movement is imminent.
4. Ascending Broadening Wedge Pattern
The Ascending Broadening Wedge is a bearish trend reversal pattern characterized by expanding trendlines that diverge in an upward direction. The pattern consists of a series of higher highs and higher lows, with the upper trendline serving as resistance and the lower trendline acting as support. This pattern is indicative of increasing volatility and uncertainty, leading to a potential downward reversal in price.
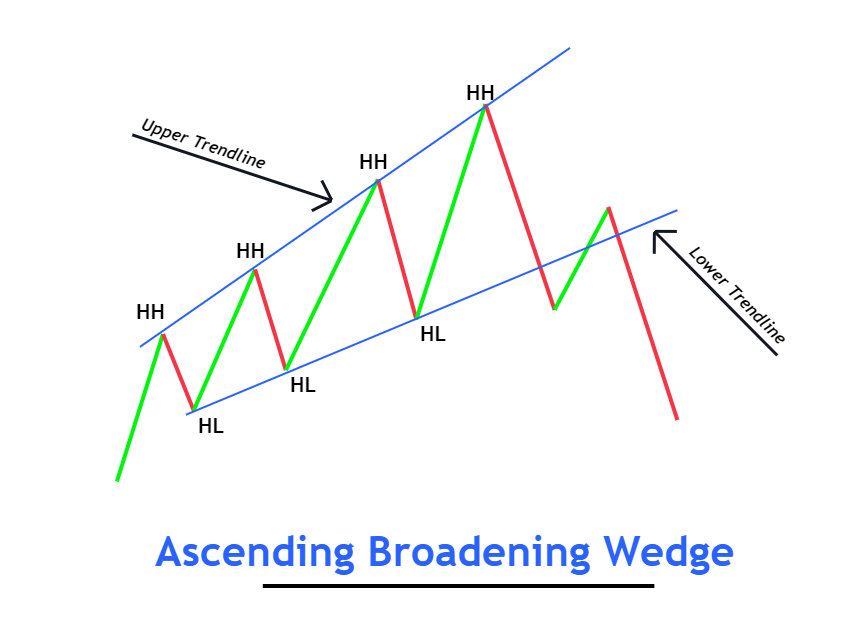
Identification:
- Starting Point: Begin by identifying a bullish trend that leads into the pattern, setting the stage for a potential reversal.
- Higher Highs and Higher Lows: Look for price action making progressively higher highs and higher lows, indicative of an expanding wedge.
- Trendlines: Draw two diverging trendlines that connect the series of higher highs (resistance) and higher lows (support), outlining the broadening structure of the wedge.
- Wave Size: Each successive wave within the pattern should be larger than the previous, emphasizing the expanding nature of the wedge.
- Minimum Waves: Ensure that there are at least three identifiable waves within the pattern to confirm its validity.
5. Descending Broadening Wedge Pattern
The Descending Broadening Wedge is a bullish trend reversal pattern characterized by an expanding wave during a downward trend. This pattern signals a potential reversal to an upward trend, highlighting a period of increasing market volatility and uncertainty as the price makes progressively lower lows and lower highs.
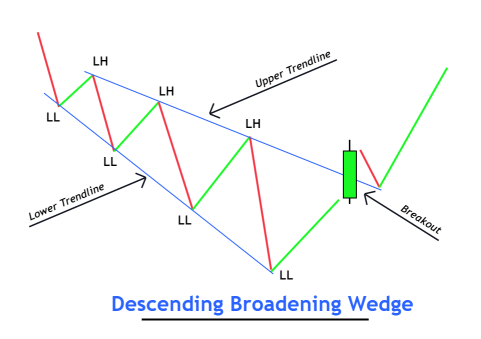
Identification:
- Starting Point: Look for a bearish trend leading into the pattern, which sets the context for the potential bullish reversal.
- Lower Lows and Lower Highs: Identify a series of lower lows and lower highs, which indicate the expanding nature of the wedge.
- Trendlines: Draw two diverging trendlines that connect the lower highs (resistance) and the lower lows (support), creating the broadening wedge shape.
- Wave Expansion: Each successive wave should be larger than the one before, emphasizing the broadening aspect of the pattern.
- Wave Count: Verify that there are at least three distinct waves within the pattern to confirm its presence on the chart.
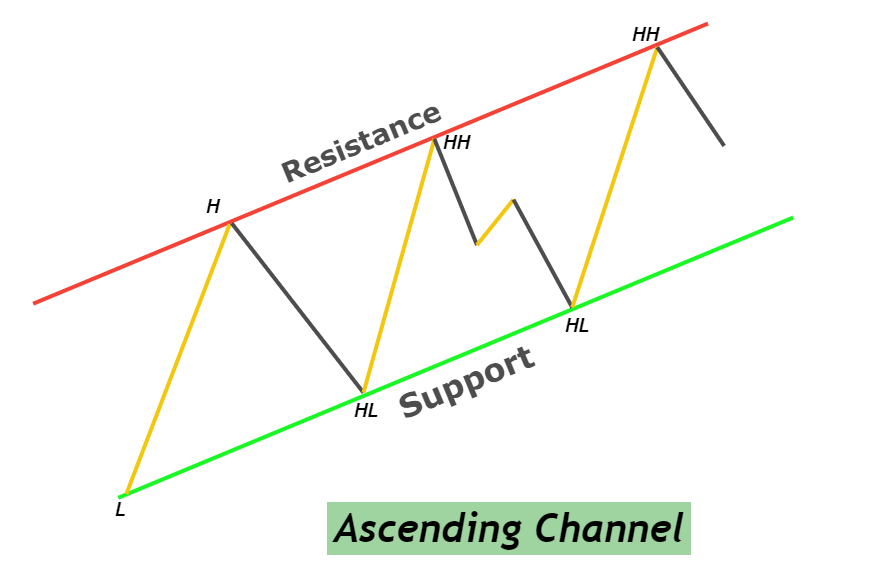
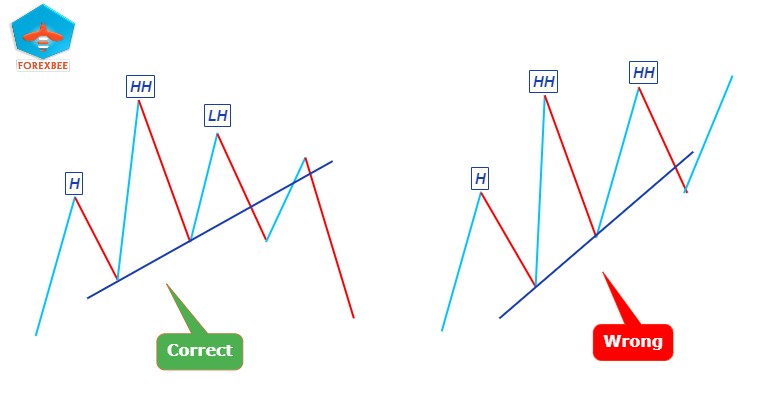
6. Ascending Channel Pattern
An Ascending Channel is a bullish chart pattern formed by two parallel upward-sloping trendlines that encapsulate the price action. This pattern indicates a consistent bullish trend in the market, where the lower trendline serves as support and the upper trendline acts as resistance.
Identification:
- Higher Lows: Start by identifying at least three consecutive higher lows, which form the basis of the ascending channel’s support line.
- Parallel Trendlines: Draw a trendline connecting these higher lows, then clone this trendline and place it at the level of the higher highs to create the channel’s resistance line.
- Trendline Touches: The reliability of an ascending channel increases with the number of touches or interactions price has with the trendlines. More touches typically signify a stronger and more significant channel.
- Swing Points: To accurately draw the channel, it’s crucial to pinpoint the correct swing highs and lows. These points are where the trendlines should be anchored.
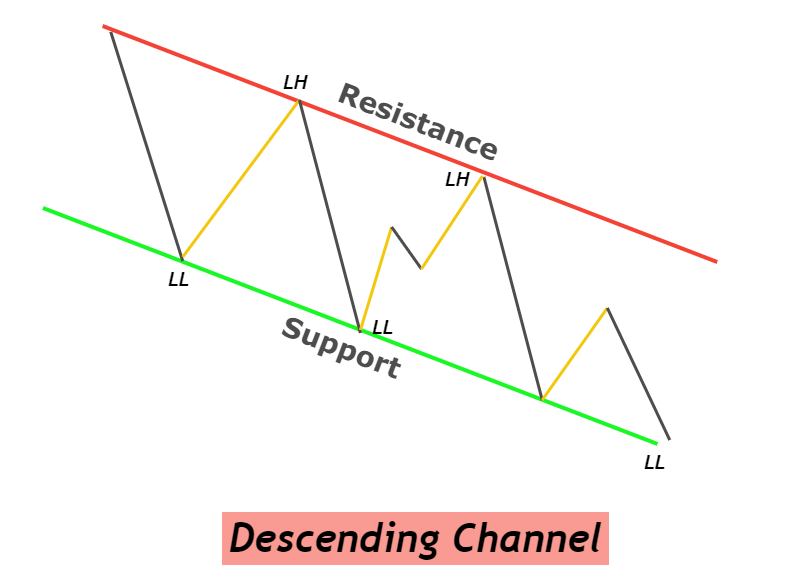
7. Descending Channel Pattern
The Descending Channel pattern is a bearish formation in trading, identified by two parallel downward-sloping trendlines that connect the series of lower highs and lower lows. This pattern indicates a prevailing bearish trend and can be utilized to identify both trend continuations and reversals.
Identification:
- Lower Lows: Begin by identifying at least three successive lower lows on the chart, which will form the basis of the descending channel’s support line.
- Parallel Trendlines: Draw a trendline through these lower lows, then replicate this trendline to align with the lower highs, creating the channel’s resistance line.
- Channel Integrity: Ensure that the price action remains within the confines of the channel, without significant closes outside the channel’s boundaries, to maintain its validity.
- Rejections: A robust descending channel is characterized by numerous rejections from both the support and resistance lines, indicating the channel’s strength and relevance.
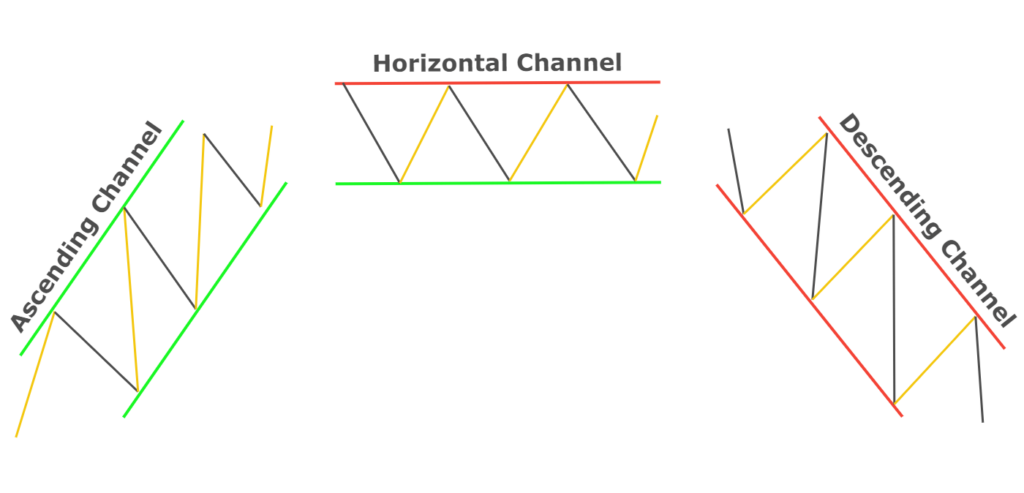
8. Trend Channels
Trend channels are graphical representations in forex trading that consist of two parallel trendlines framing the price action. These channels illustrate the direction and volatility of market trends, providing a structured view of bullish, bearish, or sideways movements.
Types of Trend Channels:
Ascending Channel (Bullish Trend):
- Formed by two parallel upward-sloping lines connecting higher highs and higher lows.
- Indicates a bullish market trend, with the upper line serving as resistance and the lower line as support.
- The trend is considered intact until a downward breakout occurs.
Descending Channel (Bearish Trend):
- Consists of two parallel downward-sloping lines linking lower highs and lower lows.
- Signifies a bearish trend, with the upper channel line acting as resistance and the lower line as support.
- The bearish trend is presumed to continue until an upward breakout happens.
Horizontal Channel (Sideways or Ranging):
- Characterized by two horizontal lines that connect the swing highs and lows, indicating a lack of a clear bullish or bearish trend.
- Represents a market in consolidation or a ranging phase, where the price oscillates between the two horizontal levels.
- Trading within a horizontal channel involves anticipating bounces off support and resistance levels.
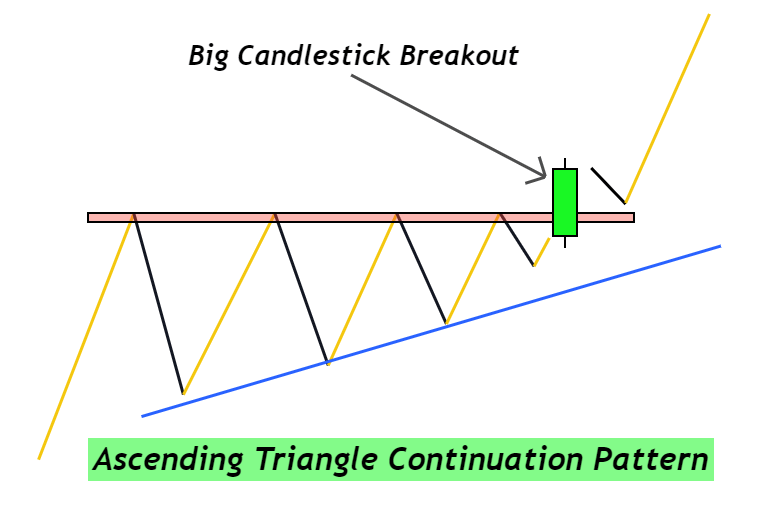
9. Ascending Triangle Pattern
The Ascending Triangle pattern is a chart formation that can signal both continuation and reversal trends, characterized by a flat upper trendline (acting as resistance) and an upward-sloping lower trendline (acting as support), which converge to form a triangle. This pattern indicates that buyers are more aggressive than sellers, as evidenced by the higher lows.
Identification:
- Base Formation: The upper side of the triangle, or the base, is formed by a horizontal resistance line that has been touched by the price at least three times without a significant breakthrough.
- Rising Trendline: The lower side of the triangle is an ascending trendline connecting at least two higher lows, indicating increasing buying interest with each price dip.
- Swing Waves: The pattern should consist of clear, discernible swing waves, with each successive low being higher than the previous one, reinforcing the ascending nature of the lower trendline.
- Wave Count: A valid Ascending Triangle pattern should have at least three swing waves to confirm its presence.
10. Symmetrical Triangle Pattern
The Symmetrical Triangle pattern is a chart formation that can serve as a continuation or reversal signal, characterized by converging trendlines connecting a series of sequentially lower peaks and higher troughs. This results in a triangle shape pointing sideways, indicating a period of consolidation where neither buyers nor sellers are in clear control, leading to a narrowing price range.
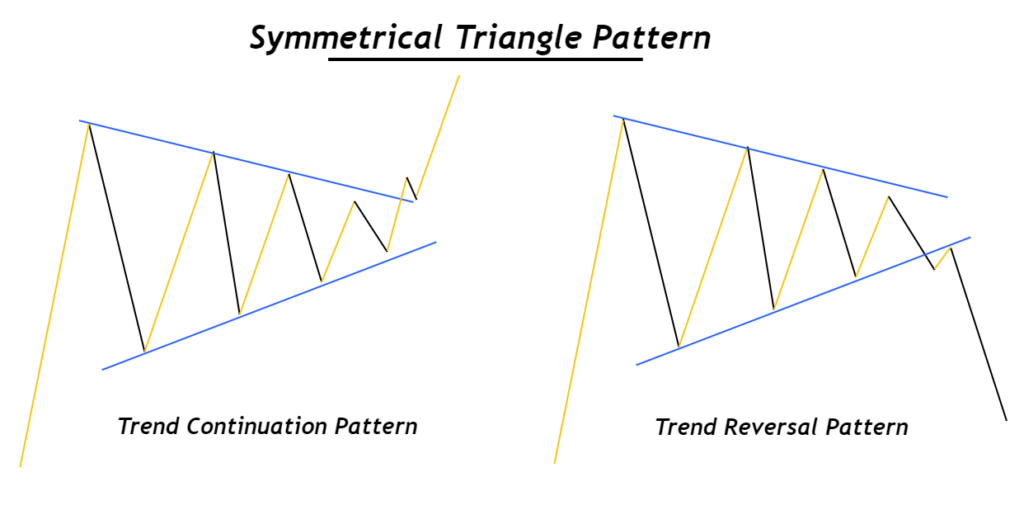
Identification:
- Wave Formation: For a pattern to be recognized as a symmetrical triangle, it must consist of at least four waves, with each subsequent wave being shorter than the previous, signifying a decrease in volatility and an impending breakout.
- Key Levels: Ideal symmetrical triangles form at significant levels of support, resistance, or within supply and demand zones, adding to the pattern’s significance.
- Converging Trendlines: Draw two trendlines – one connecting the lower highs and the other connecting the higher lows. These trendlines should converge as the pattern develops, creating a symmetrical appearance.
11. Bearish Flag Pattern
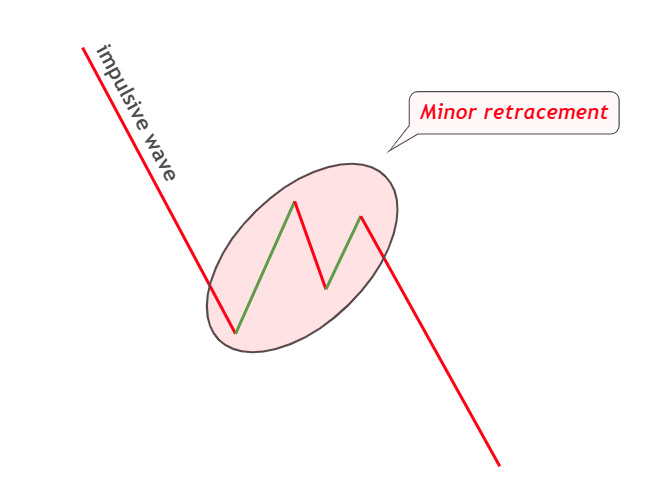
The Bearish Flag pattern is a continuation chart formation seen in forex and stock trading, characterized by a short, counter-trend consolidation phase that follows a sharp downward price movement, resembling a flag on a pole. This pattern indicates that the current downtrend is likely to continue after a brief pause.
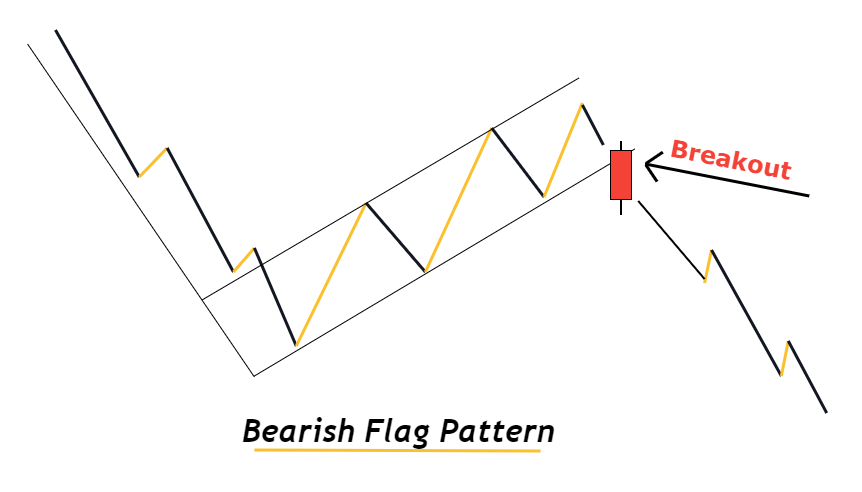
Identification:
- Pole: The pole is formed by a steep, nearly vertical drop in price, representing the initial impulsive wave of the bearish trend.
- Flag: Following the pole, the flag consists of a slight, upward-sloping consolidation phase, where prices retrace slightly within a narrow price range. This phase is typically represented by parallel trendlines that slope against the prevailing downtrend.
12. Rounding Bottom Pattern
The Rounding Bottom pattern, often likened to the shape of the letter “U”, is a bullish trend reversal pattern that gradually shifts the market sentiment from bearish to bullish. It is characterized by a slow and steady decline followed by a stabilizing period and a symmetrical recovery to its initial starting point, forming a rounded trough in the price chart.
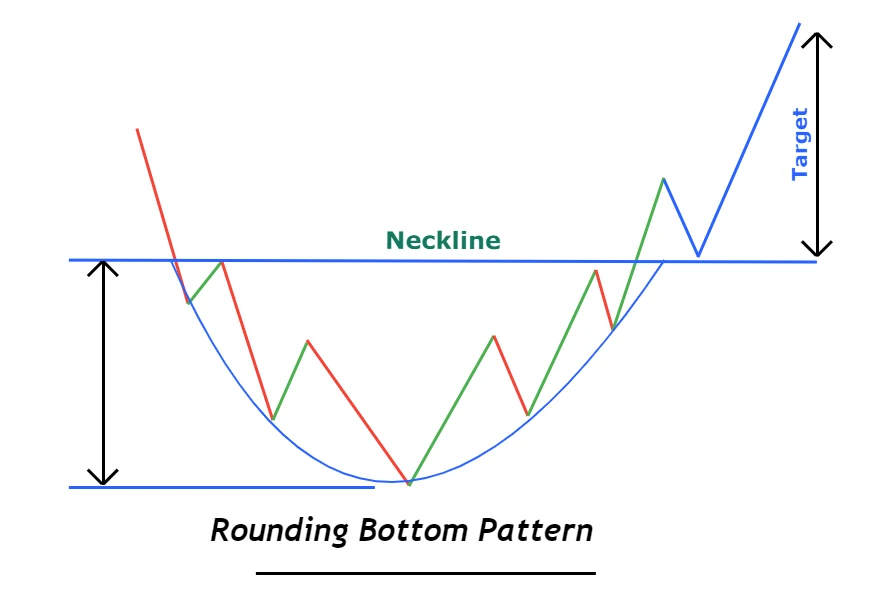
Identification:
- Location: This pattern typically forms at the bottom of a downtrend, marking a gradual shift in market dynamics.
- Shape: The ideal Rounding Bottom should have a smooth, rounded bottom that mirrors the letter “U”. Sharp and V-shaped recoveries do not qualify as Rounding Bottoms and are often indicative of different market dynamics.
- Higher High: A significant indication of a trend reversal within this pattern is the formation of a higher high following the completion of the “U” shape.
13. Bull Flag Pattern
The Bull Flag pattern is a bullish continuation chart pattern that appears during an uptrend, consisting of a strong upward price move followed by a consolidating downtrend, resembling a flag on a pole. This pattern indicates that the bullish trend is likely to continue after a brief period of consolidation.
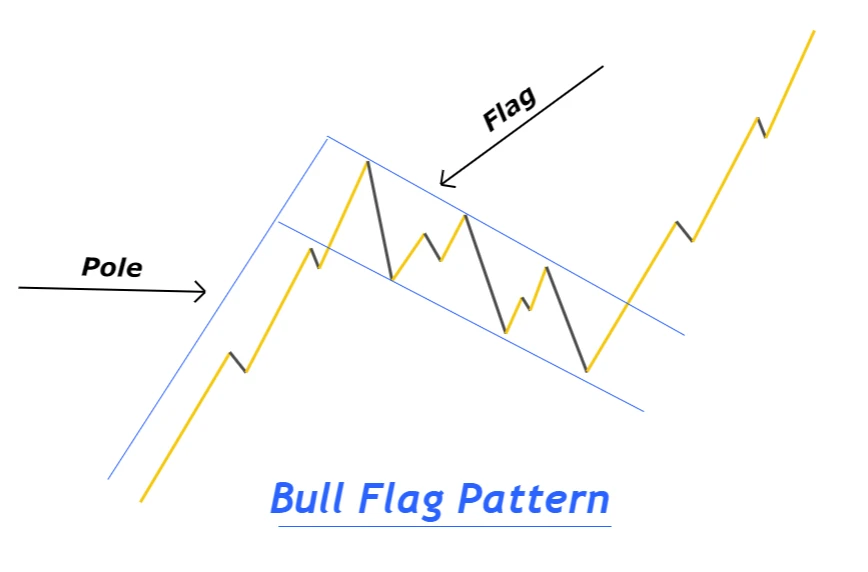
Identification:
- Pole: The pole is formed by a sharp, vertical increase in price, representing the initial impulsive wave of the bullish trend.
- Flag: The flag portion is a short, downward-sloping consolidation phase that follows the pole, often represented by a narrow channel of lower highs and lower lows.
14. Double Bottom Pattern
The Double Bottom pattern, recognized for its resemblance to the letter “W”, is a bullish reversal chart pattern that forms after a downtrend. It is characterized by two consecutive troughs at a similar level, with a moderate peak in between, indicating potential reversal from bearish to bullish momentum.
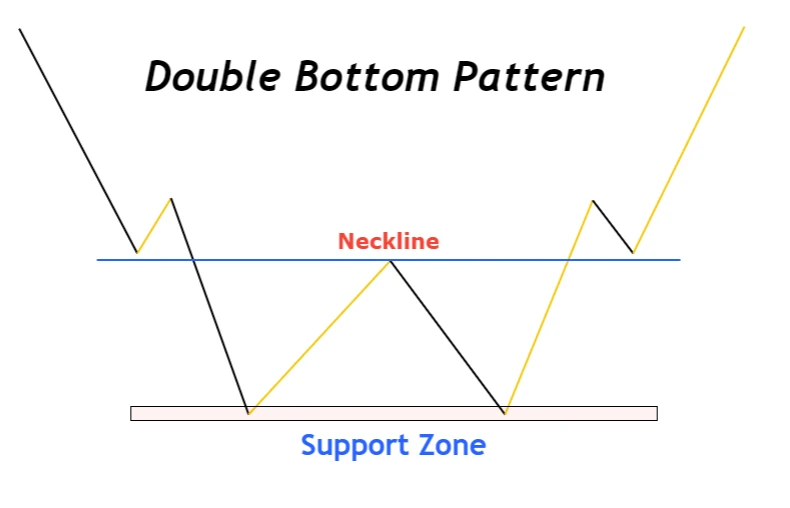
Identification:
- Preceding Trend: The pattern typically follows a noticeable bearish trend, establishing the context for a potential reversal. This initial downtrend is crucial for the pattern’s validity.
- Support Zone: The two troughs of the pattern are formed at a support zone, where buying interest is strong enough to prevent the price from falling further, indicating potential accumulation by bulls.
- Neckline: The peak between the two troughs forms a resistance level known as the neckline. A breakout above this level is often required to confirm the reversal pattern.
- Neckline Breakout: The confirmation of the Double Bottom pattern comes with the price breaking above the neckline, ideally on increased volume or strong bullish momentum, signaling a shift in market sentiment from bearish to bullish.
15. Double Top Pattern
The Double Top pattern, often referred to as the “M Pattern” due to its resemblance to the alphabet “M”, is a bearish reversal chart pattern. It is characterized by the formation of two consecutive peaks at approximately the same level, indicating a potential reversal from a bullish to a bearish trend.
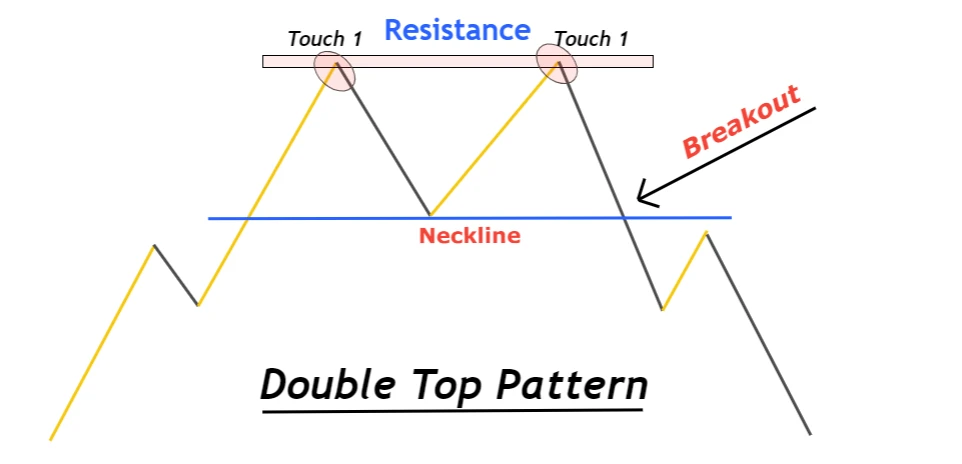
Identification:
- Preceding Trend: A significant bullish trend should precede the formation of the Double Top pattern. This establishes the context for a potential trend reversal.
- Resistance Zone: The two peaks are formed at a resistance level, where selling pressure overcomes buying pressure, preventing the price from advancing further.
- Confirmation: The pattern is confirmed when the price drops below the support level, often identified as the neckline, which is drawn at the lowest point between the two peaks.
16. Triple Top Pattern
The Triple Top pattern is a bearish reversal chart formation characterized by three distinct peaks at approximately the same level, followed by a neckline breakout that shifts the market trend from bullish to bearish. This pattern is one of the classic chart patterns used in technical analysis to signal a potential change in market direction.
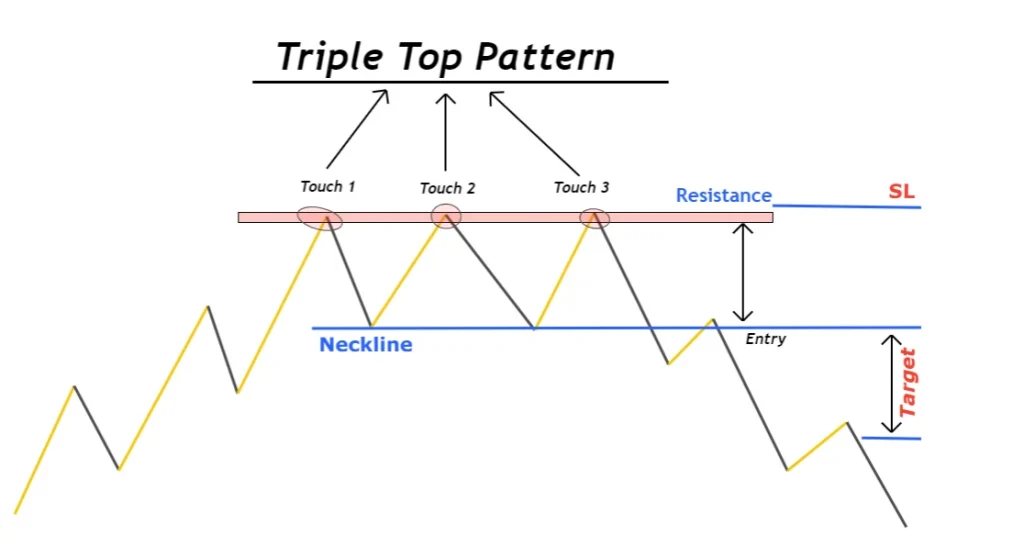
Identification:
- Preceding Trend: A Triple Top pattern typically forms after a prolonged bullish trend, providing the context for a potential reversal.
- Equal Peaks: The pattern is defined by three almost equal tops, with each peak reaching a similar resistance level, indicating strong selling pressure at this price point.
- Resistance Zone: The resistance zone is established by the peaks and is a critical area where the market has repeatedly failed to push prices higher.
- Neckline: The neckline is drawn by connecting the lows between the three peaks. This line acts as a support level that, once broken, confirms the pattern’s bearish reversal signal.
17. AB=CD Pattern
The AB=CD pattern is a foundational harmonic chart pattern characterized by two price legs (impulsive waves) of equal length, separated by a retracement wave. This pattern is widely recognized for its simplicity and effectiveness in predicting price reversals in technical analysis, with its structure closely tied to specific Fibonacci ratios.
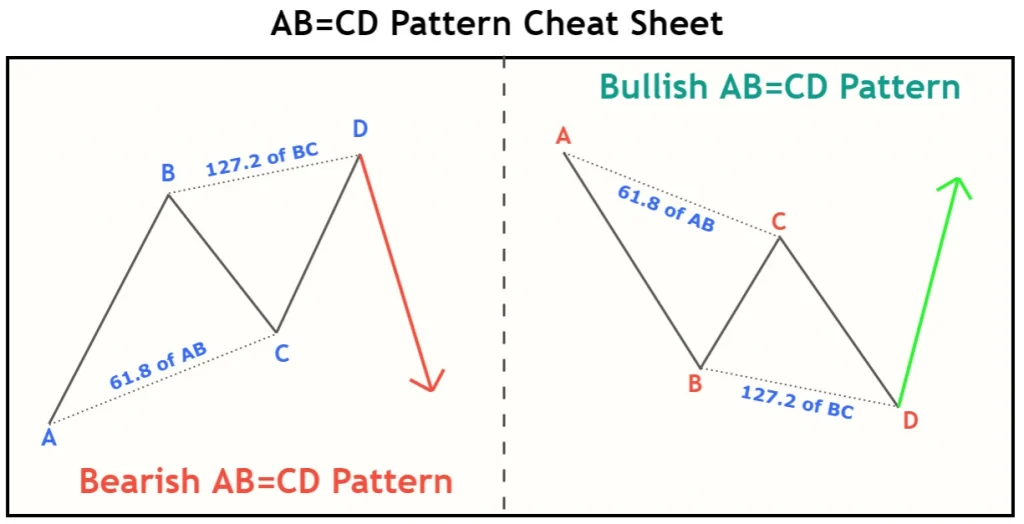
Identification:
- BC Retracement: The ‘BC’ wave should retrace to the 61.8% Fibonacci level of the ‘XA’ wave, indicating a significant pullback but not a complete reversal of the initial ‘AB’ leg.
- CD Extension: The ‘CD’ wave is expected to extend to the 127.2% Fibonacci level of the ‘BC’ wave, suggesting that the pattern completion and potential reversal area coincide with significant Fibonacci extension levels.
18. Descending Triangle Pattern
The Descending Triangle is a chart pattern characterized by a flat lower trendline that acts as support and a descending upper trendline that acts as resistance, creating a right-angled triangle. Its role as a continuation or reversal pattern depends on its placement within the broader market trend.
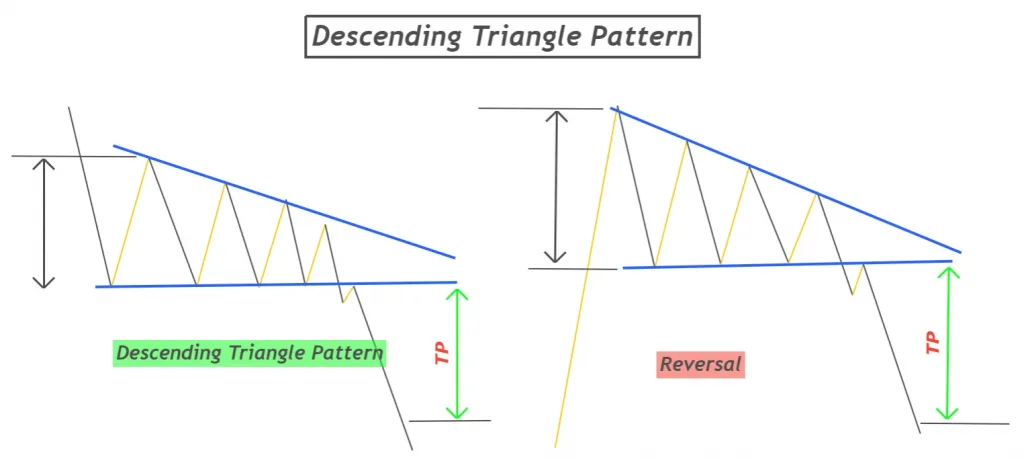
Identification:
- Formation in Downtrend: When the Descending Triangle forms during a downtrend, it is typically considered a continuation pattern, suggesting that the downward trend is likely to persist following the pattern’s completion.
- Formation in Uptrend: If the Descending Triangle appears at the peak of an uptrend, it may serve as a reversal pattern, indicating a potential shift from bullish to bearish sentiment.
19. Triple Bottom Pattern
The Triple Bottom pattern is a bullish reversal chart formation characterized by three distinct and equal lows followed by a breakout above a resistance level, often referred to as the neckline. This pattern signals a potential shift from a bearish to a bullish trend in forex or stock trading.
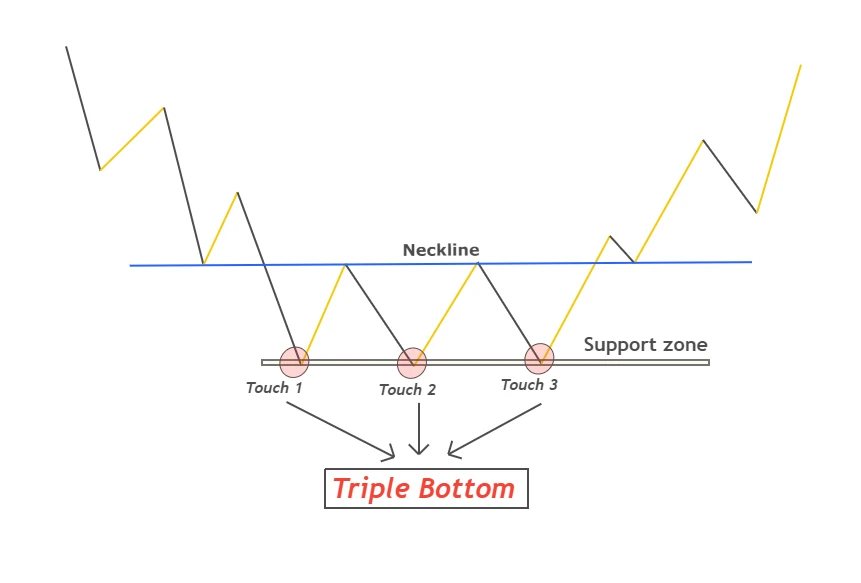
Identification:
- Preceding Bearish Trend: The pattern should be preceded by a clear bearish trend, identified by consecutive lower lows and lower highs.
- Equal Bottoms: Three distinct lows should form at approximately the same price level, indicating strong support where the price finds buyers each time it dips.
- Neckline Formation: The neckline is a resistance level formed by connecting the high points between the three bottoms. A breakout above this level confirms the reversal pattern.
- Volume: Ideally, volume should decrease with each successive bottom and increase significantly during the breakout, providing further confirmation of the pattern’s validity.
20. Diamond Pattern in Trading
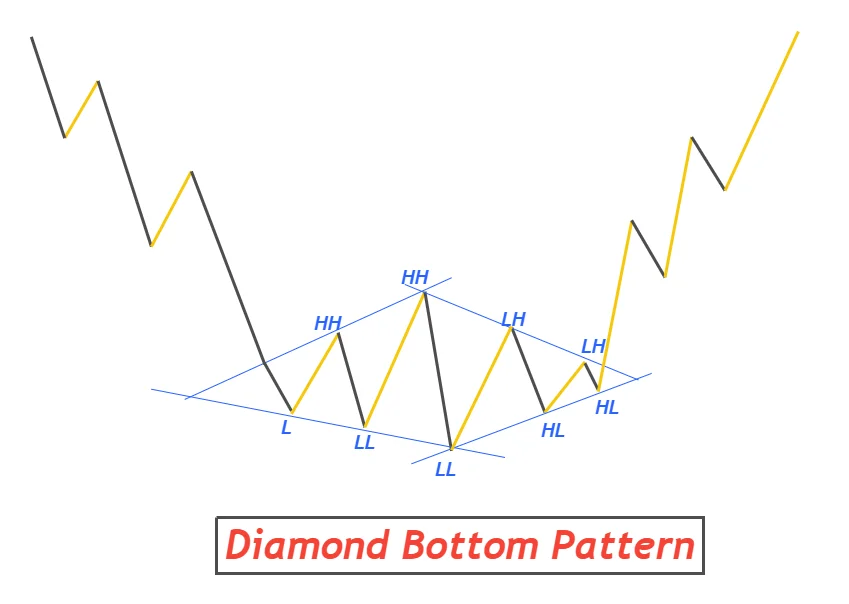
The Diamond Pattern is a complex reversal chart pattern characterized by a broadening formation followed by a narrowing price range, forming a shape akin to a diamond. This pattern signifies a potential reversal in the ongoing trend and suggests market indecision before a clear directional move emerges. It is considered a reliable formation due to its rarity and the significant shifts in supply and demand dynamics it represents.
Identification:
- Formation Stages: The pattern is formed through two distinct phases: the broadening phase (initial expansion of price range) and the narrowing phase (subsequent contraction), which together create the diamond shape.
- Broadening Pattern: Initially, the market expands with higher highs and lower lows, resembling a megaphone or a broadening pattern, indicating increasing volatility and uncertainty.
- Narrowing Pattern: Following the broadening phase, the price action contracts into a narrowing wedge or triangle, signaling a decrease in volatility and the consolidation of prices.
Types of Diamond Pattern:
Diamond Top (Bearish Diamond Pattern): Forms after a prolonged uptrend and signals a potential reversal to a downtrend. Key identifiers include formation in an overbought condition and commencement after a bullish impulsive move, without prior sideways movement.
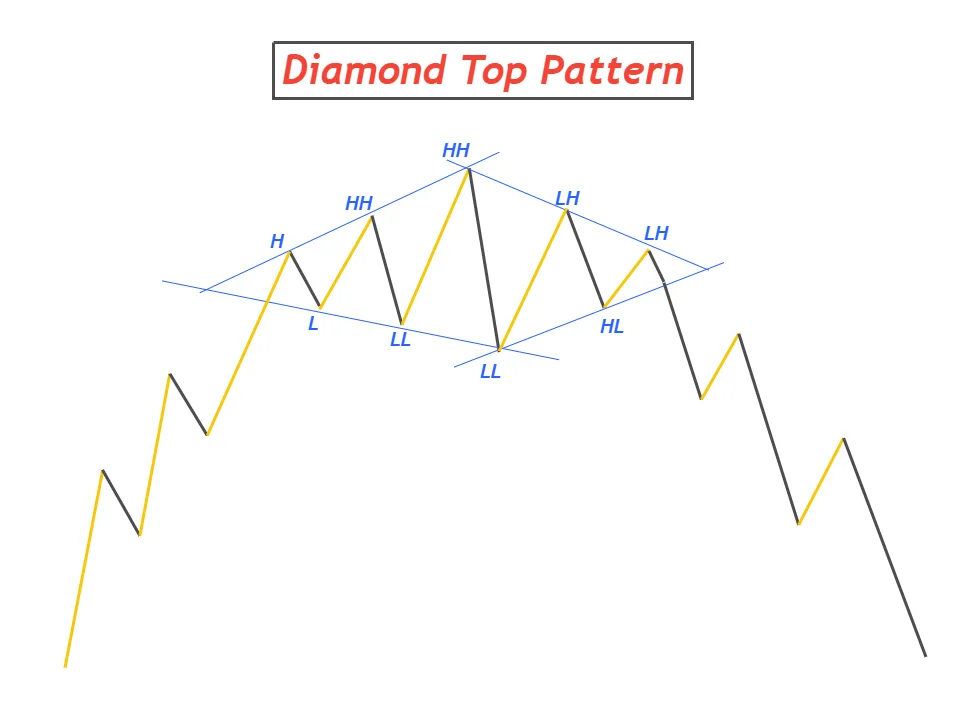
Diamond Bottom (Bullish Diamond Pattern): Develops following a downtrend and indicates a possible shift to an uptrend. Look for formation in oversold conditions, initiation after a bearish impulsive phase, and the absence of preceding sideways price action.
21. Wedge Chart Patterns in Forex
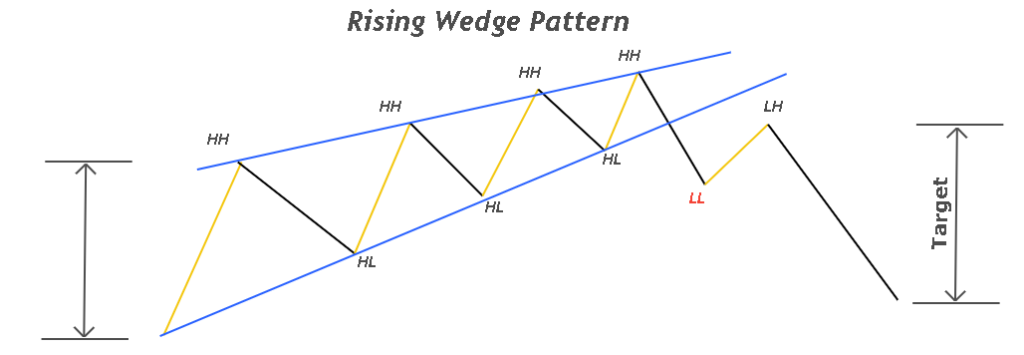
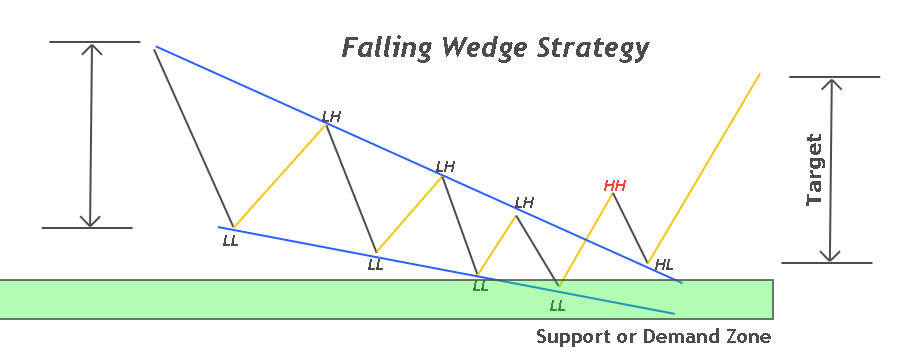
Wedge chart patterns are technical analysis tools that signal potential reversals in the market trend. Characterized by converging trend lines, they indicate a diminishing momentum in the current trend and are categorized into two types based on their formation and the expected outcome.
Types of Wedge Pattern
Rising Wedge Pattern: A Rising Wedge2 is a bearish reversal pattern that forms during an uptrend. It is characterized by higher highs and higher lows that converge towards a point, creating a narrowing, upward-sloping shape.
Falling Wedge Pattern: A Falling Wedge is a bullish reversal pattern that develops during a downtrend. It features lower highs and lower lows that converge, forming a narrowing, downward-sloping configuration.
22. Cup and Handle Pattern in Forex
The Cup and Handle pattern is a bullish trend continuation chart pattern that visually resembles a tea cup with a handle. This pattern suggests that, after a period of consolidation or minor pullback within the handle, the price is likely to continue its previous upward trend.
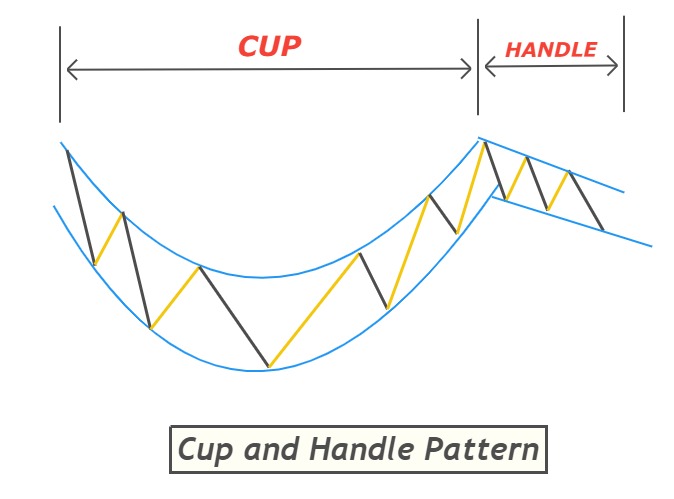
There are two types:
- Cup and handle pattern
- inverted cup and handle pattern
23. Pennant Pattern in Forex
The Pennant pattern is a trend continuation chart pattern often seen in forex trading, characterized by a small symmetrical triangle that forms after a significant price movement. The pattern resembles a pennant on a flagpole, with the initial price move forming the pole and the consolidation forming the pennant.
Types of Pennant Patterns:
Bullish Pennant Pattern:
- Forms during an uptrend.
- Wave A is a bullish impulsive move with higher highs and higher lows.
- The breakout from the pennant is expected to be upward, continuing the bullish trend.
Bearish Pennant Pattern:
- Develops during a downtrend.
- Wave A is a bearish impulsive move with lower lows and lower highs.
- The breakout from the pennant is anticipated to be downward, perpetuating the bearish trend.
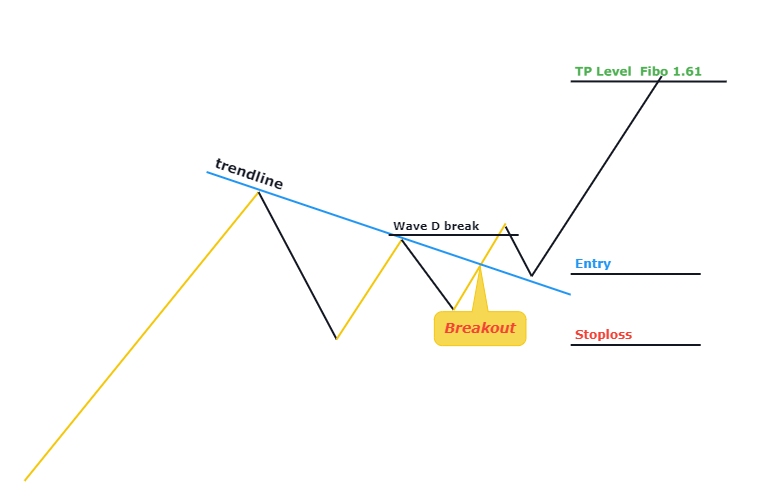
24. Three Drives Pattern in Forex
The Three Drives pattern is a highly predictive reversal chart pattern found in forex trading. It is characterized by a precise rhythm of three successive and symmetrical moves (or “drives”) in a specific direction, each followed by a moderate retracement. In a bullish trend, the pattern displays three consecutive higher highs, whereas in a bearish trend, it shows three consecutive lower lows.
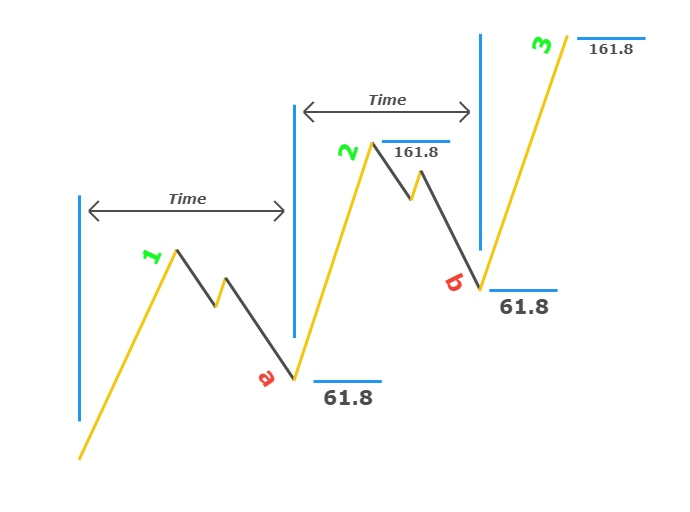
Structure:
- Drive 1: Begins the pattern with an impulsive wave, setting the direction of the pattern (upward for bullish, downward for bearish).
- Retracement of Drive 1: A partial pullback from the initial drive, typically adhering to specific Fibonacci levels, often around 61.8%.
- Drive 2: Mirrors the first drive in magnitude and direction, followed by a similar retracement.
- Drive 3: The final drive, which also resembles the first two in size and direction, completes the pattern. This drive is often anticipated to reach a Fibonacci extension of the previous retracement.
25. Head and Shoulders Pattern
The Head and Shoulders pattern is a highly regarded reversal pattern in forex trading, characterized by two smaller price peaks (shoulders) flanking a larger peak (head). It signifies a potential reversal from a bullish to a bearish trend.
Conversely, the Inverse Head and Shoulders pattern signals a potential reversal from bearish to bullish, featuring two lower troughs surrounding a deeper central trough.
26. Quasimodo chart pattern
The Quasimodo chart pattern that is formed after the formation of higher highs and lower lows on the price chart of the currency in forex trading.
Types
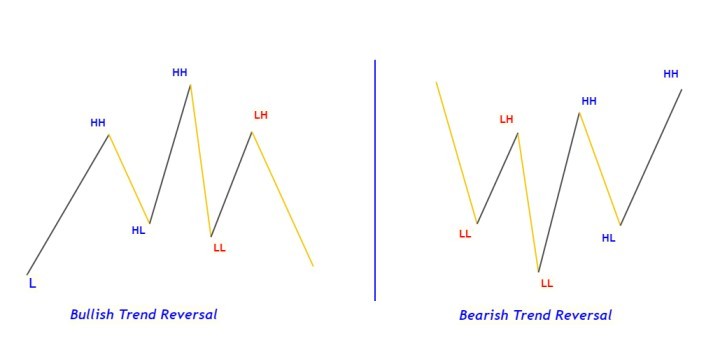
There are two types of Quasimodo or QM pattern:
Bullish QM pattern:
To identify the bullish Quasimodo pattern, follow the following guidelines:
- Formation of HH and LL.
- The last price low will act as left shoulder level.
- After a higher high, the price will retrace to the left shoulder level and then it will continue bullish trend.
Bearish QM pattern:
- Formation of HH and LL.
- The last price high will act as left shoulder level.
- After a lower low, the price will retrace upward to the left shoulder level and continue the bearish trend.
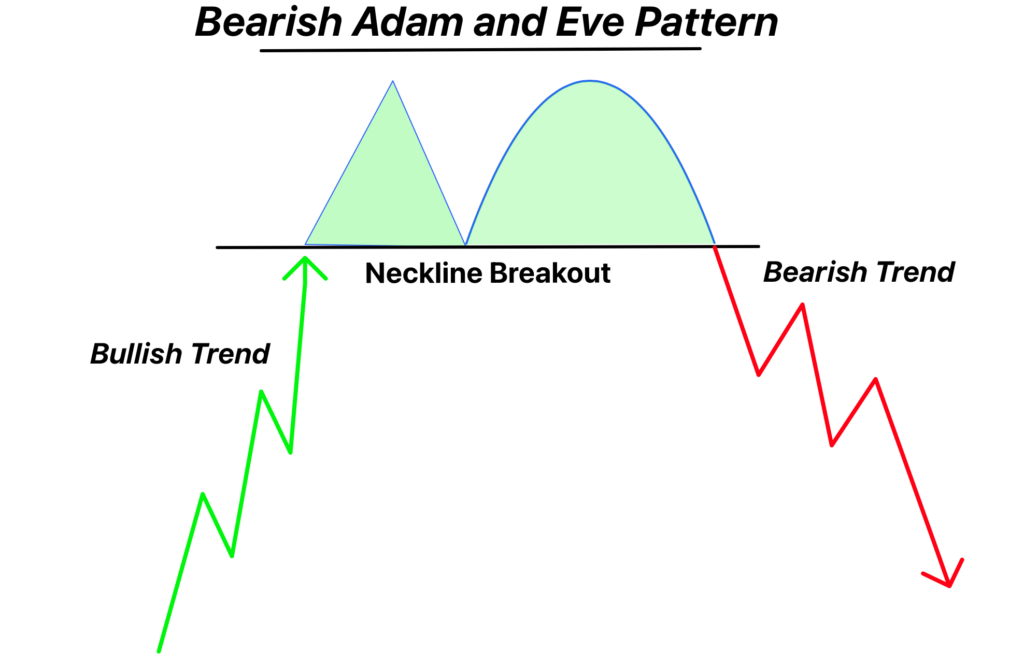
27. Adam and Eve Chart Pattern
The Adam and Eve chart pattern is a unique reversal pattern that combines V-shaped (Adam) and U-shaped (Eve) formations to signal bullish or bearish market turns. Differing from the classic double top/bottom, this pattern has a higher success rate and is identified by its distinct shapes. Adam features a sharp, quick reversal, while Eve shows a more gradual, rounded recovery or decline.
Types:
Bearish Adam and Eve Pattern:
- Structure: Comprises an inverted V (Adam) followed by an inverted U (Eve), indicating a shift from bullish to bearish sentiment.
- Forecast: Suggests an impending bearish reversal, with sellers gaining market dominance, leading to a potential bearish breakout.
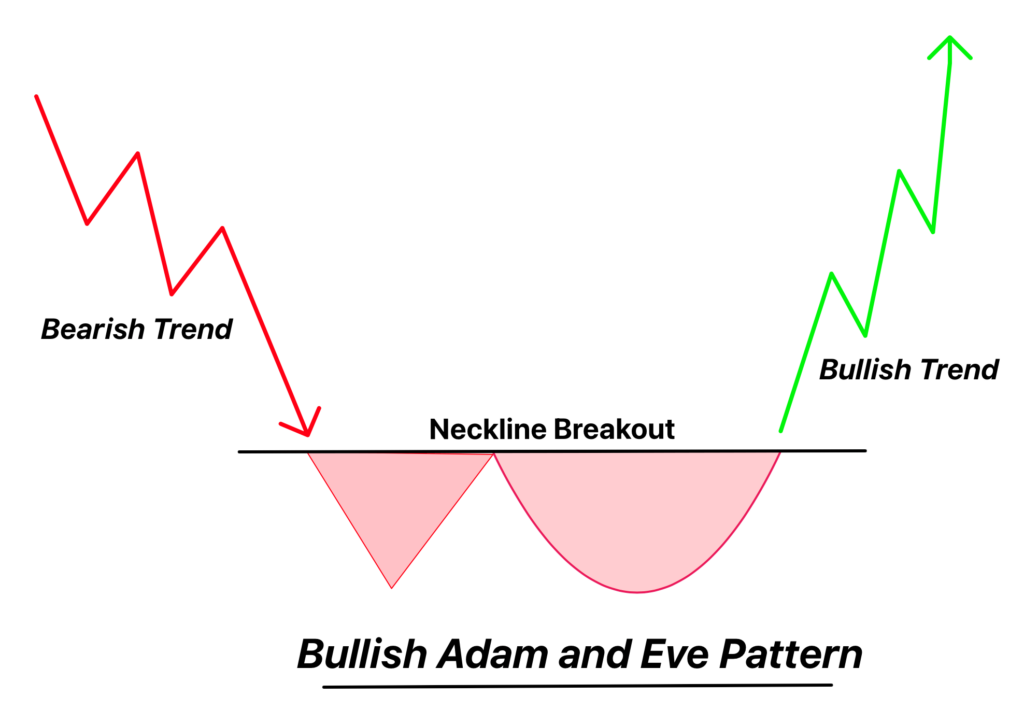
Bullish Adam and Eve Pattern:
- Structure: Features a V-shaped Adam followed by a U-shaped Eve, diverging from the classic W-shaped double bottom.
- Forecast: Signals a bullish reversal, indicating that buying pressure is overcoming selling pressure, often culminating in a bullish breakout.
28. Dragon Pattern in Trading
The Dragon pattern is a distinctive “W” or “M” shaped reversal pattern that mirrors the form of a Chinese dragon. This pattern signals a forthcoming price reversal, which can be bullish or bearish based on the dragon’s shape. It’s a valuable indicator for traders looking to anticipate market shifts.
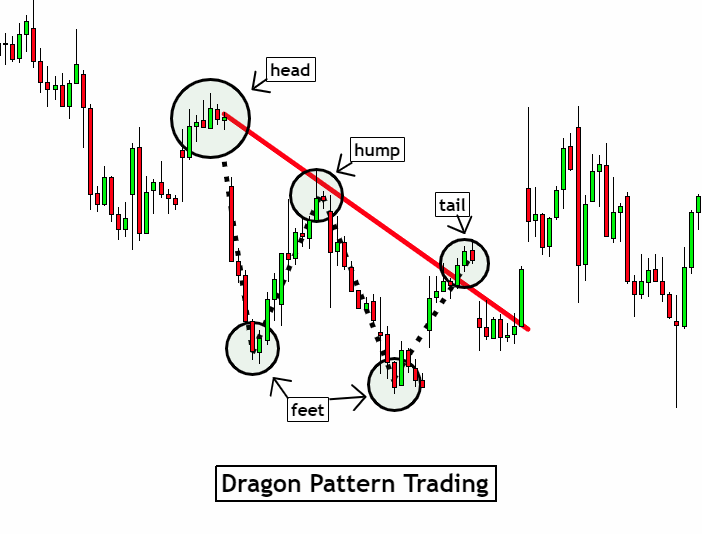
Types of Dragon Patterns:
Bullish Dragon Pattern:
- Shape: Resembles a “W”.
- Prior Trend: Bearish, indicating that the pattern forms after a downtrend.
- Market Breakout: Leads to a bullish breakout, suggesting a shift towards a bullish market sentiment.
- Forecast: Indicates an increase in buying pressure, with buyers starting to dominate the market.
Bearish Dragon Pattern:
- Shape: Mirrors an “M”.
- Prior Trend: Bullish, indicating the pattern forms after an uptrend.
- Market Breakout: Results in a bearish breakout, pointing to a growing bearish sentiment.
- Forecast: Suggests an uptick in selling pressure, with sellers gaining market control.
29. Dead Cat Bounce Pattern
The Dead Cat Bounce pattern is a temporary recovery in a declining market, resembling a small bounce in prices, before the market resumes its prior downtrend. It’s a continuation pattern that falsely hints at a reversal, making it a crucial concept for traders in both the stock and crypto markets, particularly for those involved in swing and position trading.
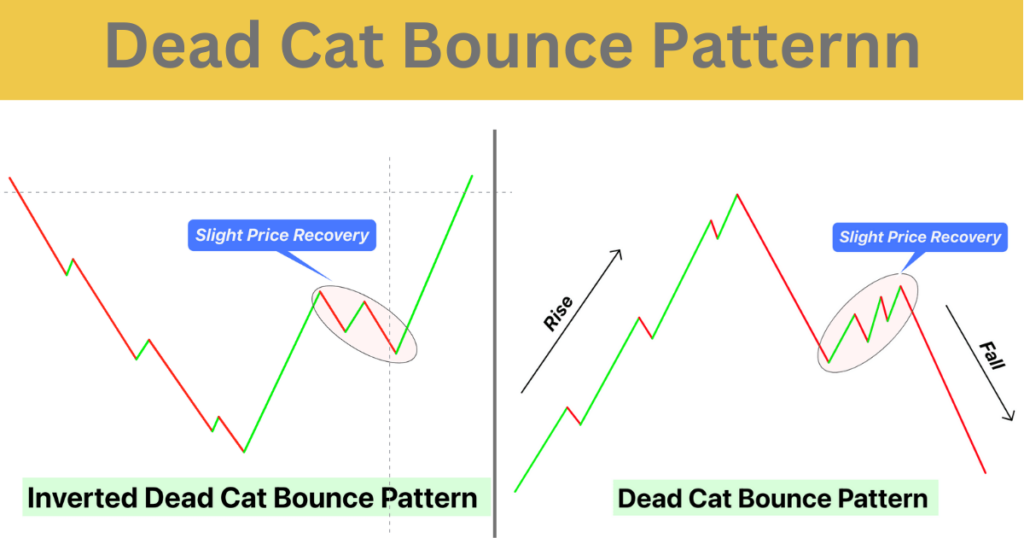
Types:
- Dead Cat Bounce: This occurs in a bearish trend where the market momentarily recovers (bounces) before continuing its downward movement.
- Inverted Dead Cat Bounce: The inverse scenario where, after a brief bearish pullback in a bullish market, prices resume their upward trajectory, though less common than the traditional dead cat bounce.
Conclusion
These chart patterns are widely used by retail traders in technical analysis.
I will highly recommend using these candlestick patterns as a confluencewith other technical tools for profitable results.
Remember to backtest a single pattern at least 50 times to become a Pro trader.