
Definition
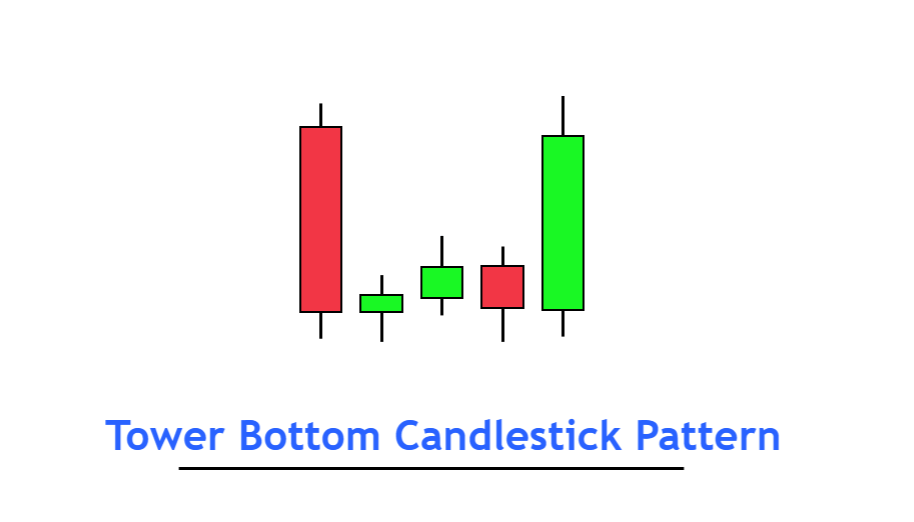
Tower bottom is a bullish trend reversal candlestick pattern of two opposite-color big candlesticks and three to five small base candlesticks.
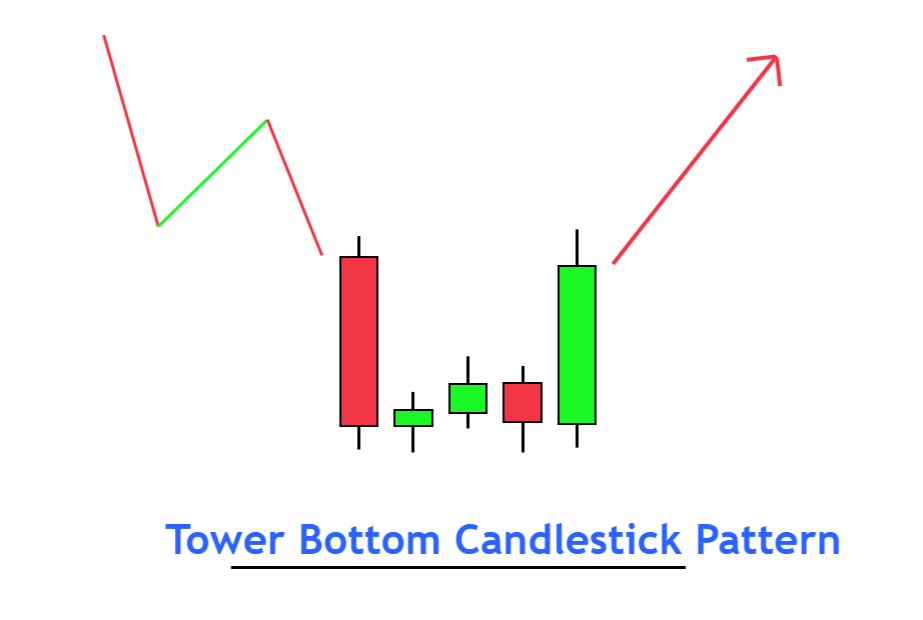
It will form at the bottom of the price chart. It indicates a slow change in price trend from a bearish to a bullish trend. Due to a similar structure to the drop base rally is a high probability trading setup and is mainly used in advanced technical analysis.
How to identify the tower bottom candlestick pattern?
To find out perfect tower bottom pattern on the price chart, you need to follow the following guidelines
- The first candlestick will be a significant bearish candlestick, and the trend before this candlestick should be bearish.
- Three to five base candlesticks will form after the first bearish candle. Base candlestick means small doji or spinning bottom candles. Candlesticks have less than a 25% body-to-wick ratio like the base. It means the body will be small, and shadows will be more significant.
- The last candlestick will be a big bearish candlestick. It should also close above the 50% Fibonacci level of the first candlestick.
These are the three requirements for the tower bottom candlestick pattern.
Tower Bottom Pattern: Information Table
| Features | Explanation |
|---|---|
| Number of Candlesticks | 5 |
| Prediction | Bullish trend reversal |
| Prior Trend | Bearish trend |
| Relevant Pattern | Evening Doji star |
What does the Tower bottom candlestick pattern tell traders?
Due to its relevance to supply and demand, it is a high probability candlestick pattern.
Let’s read the price to learn the trading psychology of this pattern.
After a bearish trend, a last big bearish candlestick will form, showing that sellers are in complete control and have used their total momentum to decrease the price.
The sellers have used their total momentum, and buyers will come into the market. Now, buyers still do not have enough momentum to beat the sellers. That’s why the price will move sideways in a ranging price structure.
After the sideways market, a big bullish candlestick will form, showing that buyers are in control and the trend has been changed.

Find High Probability Trades with this ADVANCED Candlestick Patterns Course
The Ultimate Candlestick Patterns Course That Will Help You To Trade Better
Best working conditions for tower bottom candle
To get a high probability trade setup, we add confluences of other technical tools because this step will increase the winning ratio of a trading strategy.
Here are two confluences
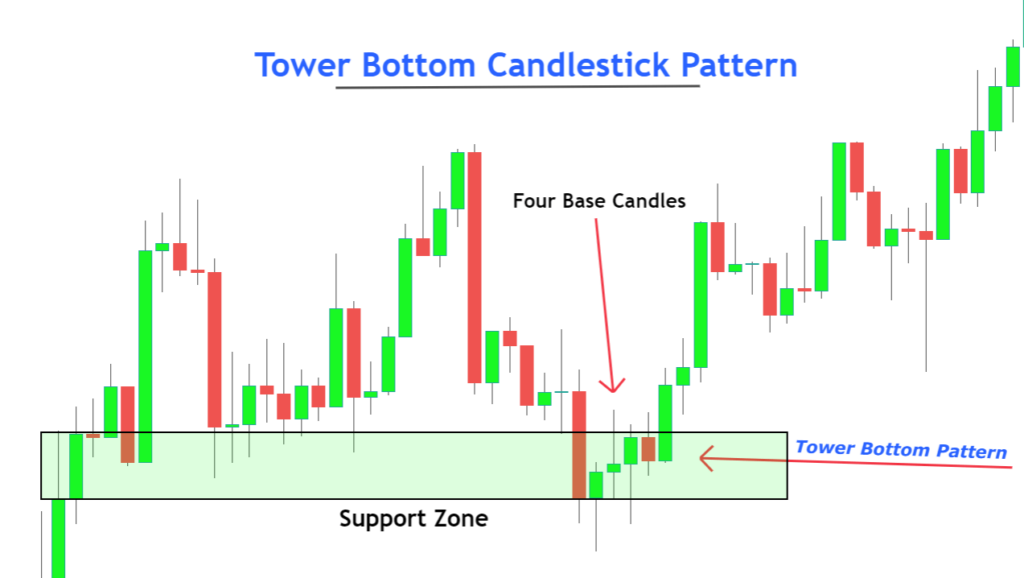
- Demand Zone or Support Zone: The confluences of these key levels with tower bottom candlestick will improve the probability of bullish trend reversal.
- Oversold Conditions: The confluence of the RSI indicator will improve the performance of the tower bottom candlestick pattern.
The Bottom Line
DBR is a supply and demand term related to the tower bottom pattern. That’s why I will recommend this candlestick pattern to all forex traders & stock traders.
It would help if you also learned supply and demand trading to broaden the concept of technical analysis.
Before trading it on a live account, make sure to backtest this pattern correctly.