
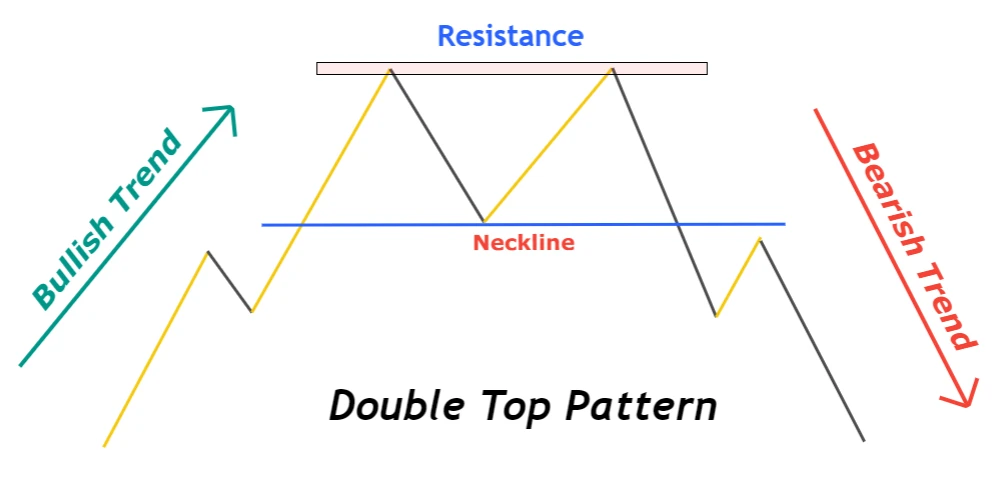
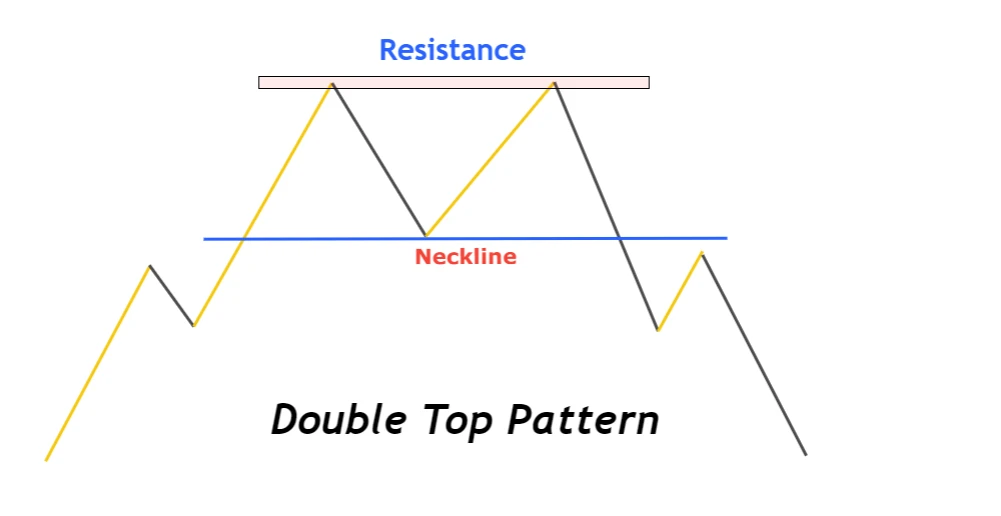
Double Top Pattern
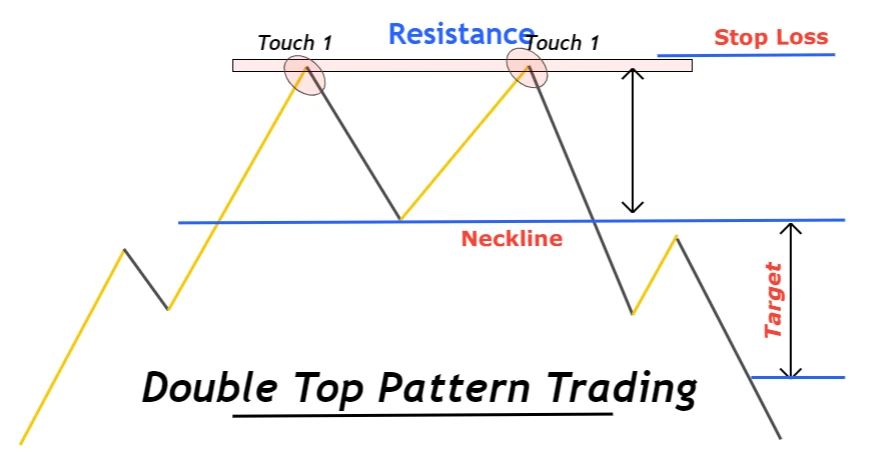
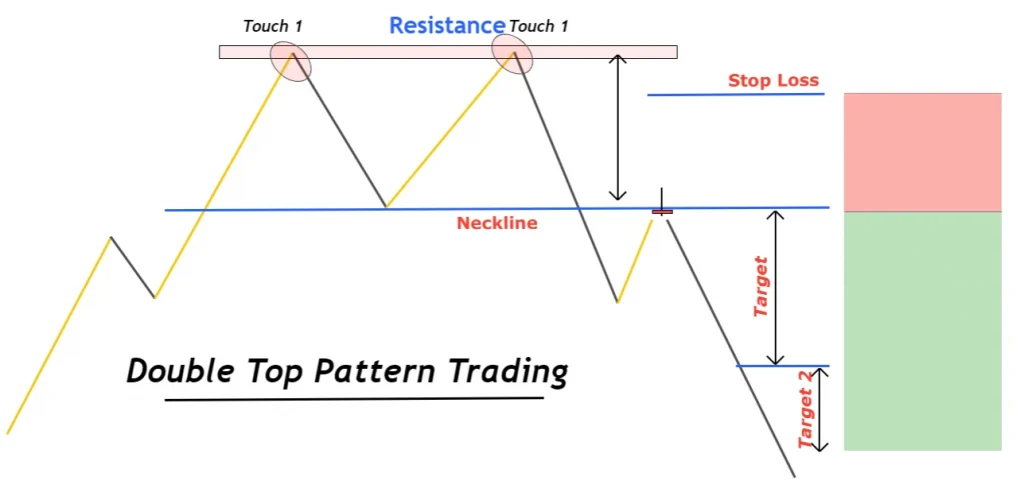
A double top is a bearish reversal chart pattern that indicates the formation of two price tops at the Resistance level. Due to resembling the shape of the alphabet “M”, the double top pattern is also known as M Pattern.
It is the most widely used chart pattern in technical analysis. Retail traders use this price pattern to forecast a change of trend from bullish into a bearish trend.
How to find out double top pattern?
To detect a double top or double touch, you need to find out a good Resistance level. When the price bounces back a second time from a Resistance Level then it is called a double price top. It means the resistance level is strong and it is not allowing the price to break the resistance level.
Follow the following steps to find a valid double top.
- There must be a bullish trend before formation of double top or M pattern on candlestick chart.
- Draw a Resistance zone at highs of double top
- Mirror that Resistance zone to the low of double top.
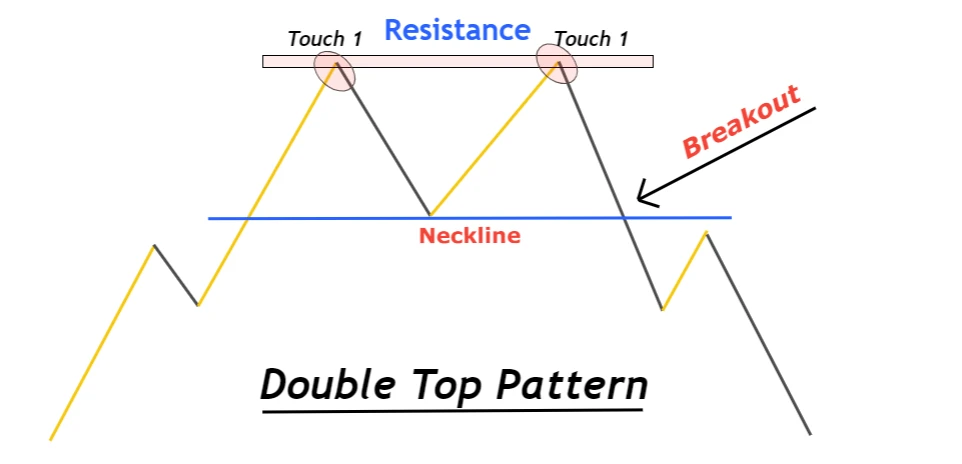
What is neckline in double top pattern?
Price always moves in the form of swing waves on the chart. The resistance zone is drawn on the highs of the swing wave that formed a double top. A support zone is drawn on the low of that swing wave. The support zone is also known as the neckline in the double top pattern.
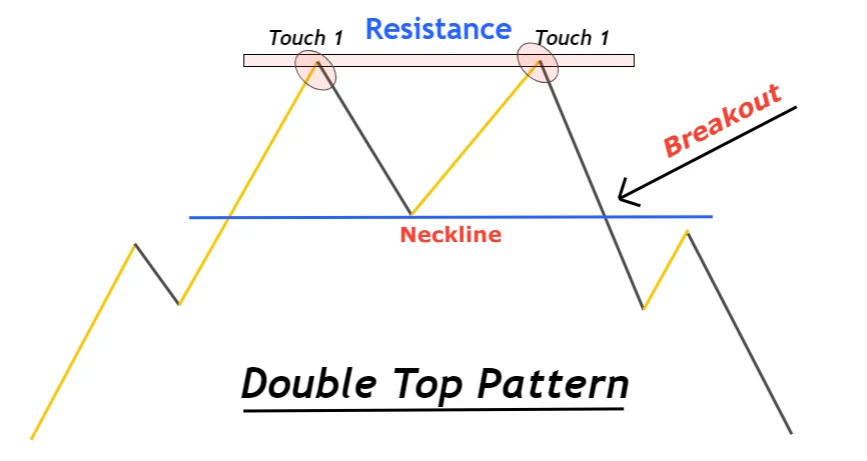
What is neckline breakout?
The double top pattern is incomplete until a valid neckline breakout happens. Because the trend will remain bullish and the price has the ability to break the resistance zone until a valid neckline or support zone breakout. When the support zone breaks, then it means buyers have lost the momentum and sellers are on hold now.
You must follow all the above steps to identify double top a trend reversal pattern.
What does M pattern tell the traders?
Before trading or choosing a chart pattern to trade on a live account, you must understand the logic of pattern formation.
A good technical analyst tries to read the price on the chart. Reading price means a trader should know about the activity happening in the market during a chart pattern formation. Reading the price means a method to predict the decision of buyers and sellers.
Let’s read the price for a double top pattern. Before double top formation, buyers were controlling the market. At a certain level, the price fulfilled the overbought condition. At that level, sellers come into play and make the price retrace downward. Due to overbought and resistance levels, the number of buyers decreased.
But due to the huge momentum of buyers, buyers again bounce upward from a support zone. But this time buyers have less momentum. Now when the price again touches the resistance level, sellers come into play and bounce back the price downward. This time number of buyers decreased again.
Now a large number of sellers come in and break the support zone created by buyers against sellers. This time Sellers are controlling the market. After eliminating the remaining few buyers by a little upward retracement, sellers will start a new bearish trend.
This is how the double top pattern reverses the trend.
Trading rules for Double Top Pattern
After identification of a double top pattern, the next step is to make a good trading plan.
When to open a Sell order
Open a sell order after the neckline breakout.
Pro Tip: The neckline breakout must be with a big body candlestick breakout. Breakout with a Doji or small candlestick does not indicate a valid breakout.
Stop-loss level
The Stop-loss level is always above the highest high of the double top pattern.
Take-profit level
It is measured by calculating the number of pips between the resistance zone and neckline.
Risk management
In the double top pattern, the risk-reward ratio should be at least 1:2. You should not risk more than 2% on each trade.
Double Top forex Trading strategy
To get the maximum benefit from trading a double top pattern, you need to make a strategy. Because trading a double top pattern is very simple. Every retail trader can follow a few above rules and start making profits. But this is not possible without a trading strategy.
A strategy is made by adding confluences to filter out the best chart patterns and leave the bad ones.
Confluences for double top strategy
- Bearish higher timeframe trend
- Candlestick pattern
- Overbought conditions
How to trade?
- Analyze higher the timeframe trend and trend must be bearish
- Use RSI indicator or Price action to identify the overbought conditions. It is a compulsory step to follow.
- Identify a valid double top pattern on the chart and a valid neckline breakout with a big bearish candlestick
- Open a sell order just after the neckline breakout or wait for the price to retrace upward with a bearish candlestick pattern at the neckline. Here you have to decide yourself by considering the risk-reward ratio.
- Draw the Fibonacci retracement tool between the resistance and neckline, then place a stop loss above the 78.6% Fibonacci level.
- Take profit level can also be increased by multiplying take profit 1 with 1.6. 1.618 is a Fibonacci golden number.
Conclusion
Nowadays, to trade a chart pattern successfully, you need to make a strategy with the addition of filters.
Without a strategy, a chart pattern will not make you a profitable trader.
Backtest a currency pair and try to add filters to your trading setup to become a profitable trader.
FAQs
M pattern is the second name of the double top pattern because this chart pattern resembles the shape of the alphabet “M”. That’s why it is also called the M pattern.
No, it is a bearish reversal pattern. it turns the bullish trend into a bearish trend.