
In this post, I will explain the difference between the two major concepts in technical analysis (Supply and demand & support and resistance). Most of the beginners thought of both of them as the same concept because of many similarities but these are two different concepts. At the end of this article, you will learn the best trading setup using supply & demand and Support & resistance. We will represent Support and Resistance with SnR whereas SnD for Supply and Demand.
Supply and demand in forex
Supply and demand represent an imbalance in price. Everything in this universe wants to balance. The same rules will apply here. When the price is in an imbalance state then it is always trying to come to a balanced state. This natural behavior of price will be called supply and demand. Remember after an imbalanced state, a balanced state will also come. So we will use these terms in technical analysis as a supply and demand and this is the main concept of supply and demand trading in forex. That’s why supply and demand is the base of technical analysis in forex trading.
How to draw supply and demand zones in forex?
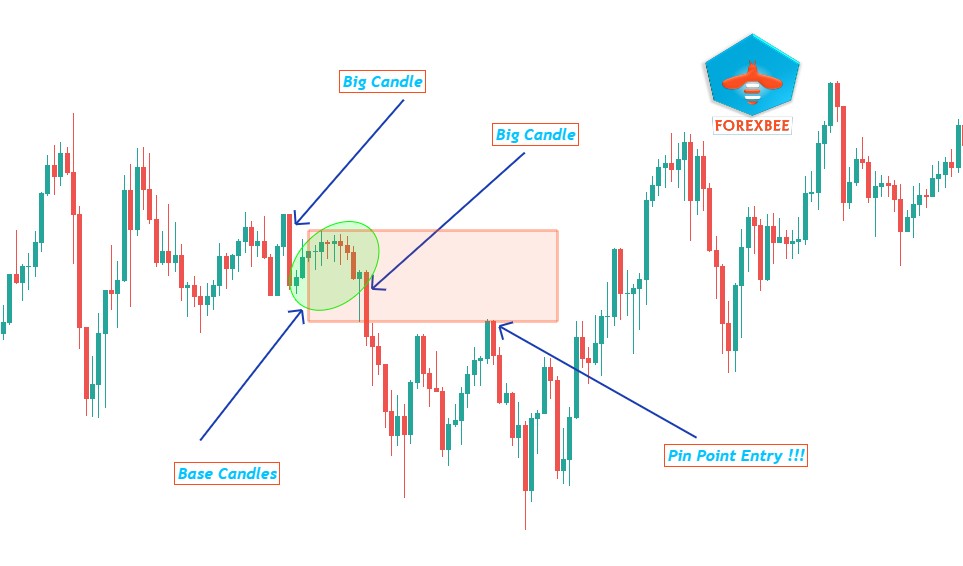
The supply and demand trading method is used to capture pinpoint entries while trading forex and to meet the needs of high-risk reward ratio. The main benefit is that we can increase our risk-reward using a tight stop loss or an open take profit with a breakeven. There are four basic concepts of supply and demand.
Simple Formula = Big candle + base candle + Big Candle
Click here to visit another article within a detailed guide about drawing a supply and demand zone.
How Supply and Demand Zone is created?
A significant imbalance in price is created when a large number of orders are filled. Like a big marubozu candle after a ranging price represents an imbalance in price. For example, big candle formation after base candle represents an imbalance in price. Now a lot of orders have been filled but there are still unfilled institutional orders left in the base zone and price will again come back to the base zone to pick those unfilled orders and we will use this opportunity and will trade with institutions using this supply and demand trading methods.
Support and resistance in forex
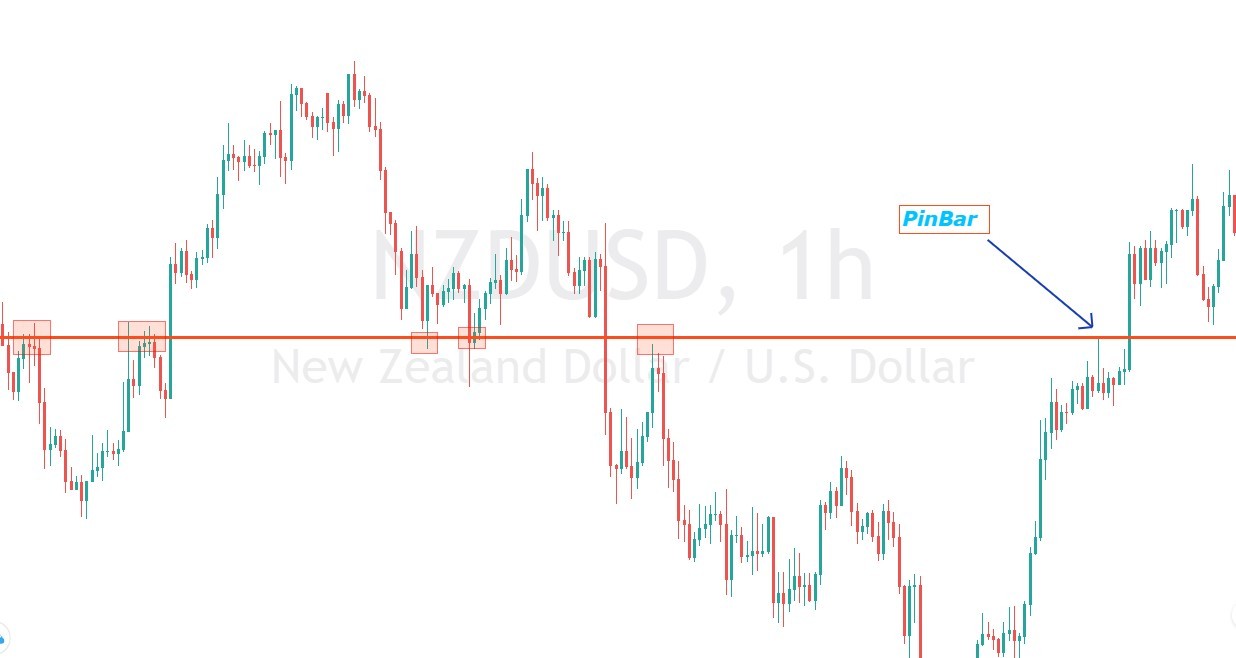
Support and resistance levels are the areas of attraction for buyers and sellers. Like Fibonacci number and round numbers are psychological levels that act as support and resistance levels. Buyers prefer to buy from the support level and Sellers prefer to sell from the resistance level. Think like a trader, for example, a trader will prefer to buy a forex pair from round number 1.5000 instead of 1.56473. So 1.5000 will also act as support or resistance level. The same like Fibonacci 0.618 level also act as support or resistance level. There are many other proven techniques to draw a valid support and resistance level using a pin bar and engulfing bar candle. in the image below, we have shown clearly that how to use a pin bar to draw support and resistance level. Click here to learn.
Best timeframe to draw support and resistance level
Swing Trader:
- Higher Timeframe: Daily, H4
- Lower Timeframe: H1
Intraday Trader:
- Higher Timeframe: H4, H1
- Lower Timeframe: M30, M15
Scalper:
- Higher Timeframe: M15, M30
- Lower Timeframe: M1, M5
Supply and demand the same as support and resistance?
No. Supply and demand are quite different from support and resistance. Supply and demand zones show unfilled orders of institutional traders and we can trade only fresh zones because institutions are not going to hold pending orders for a long time. Whereas support and resistance are levels of attraction and the history of the chart is used to draw a valid support or resistance level. Price level which has more rejections in past will act as a strong level in future too. This is support and resistance. Similarities and differences between supply & demand and support & resistance have also been explained below.
Similarities
First, let’s discuss similarities so later you can distinguish between both of them easily. There are two clear similarities I have pointed out below.
- SnR and SnD both indicate a reversal in price
- Both cover a valid zone area
Differences
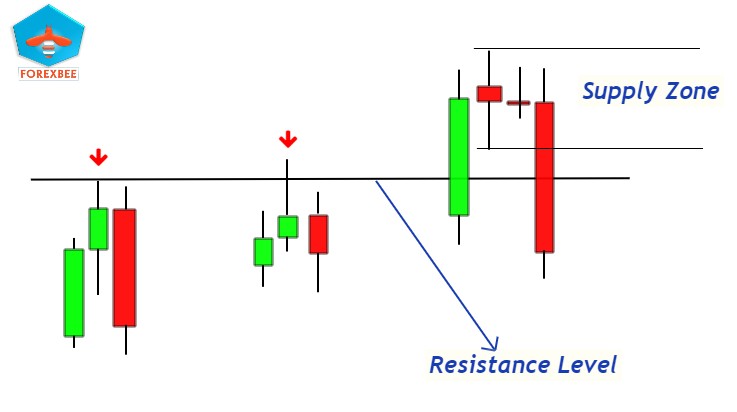
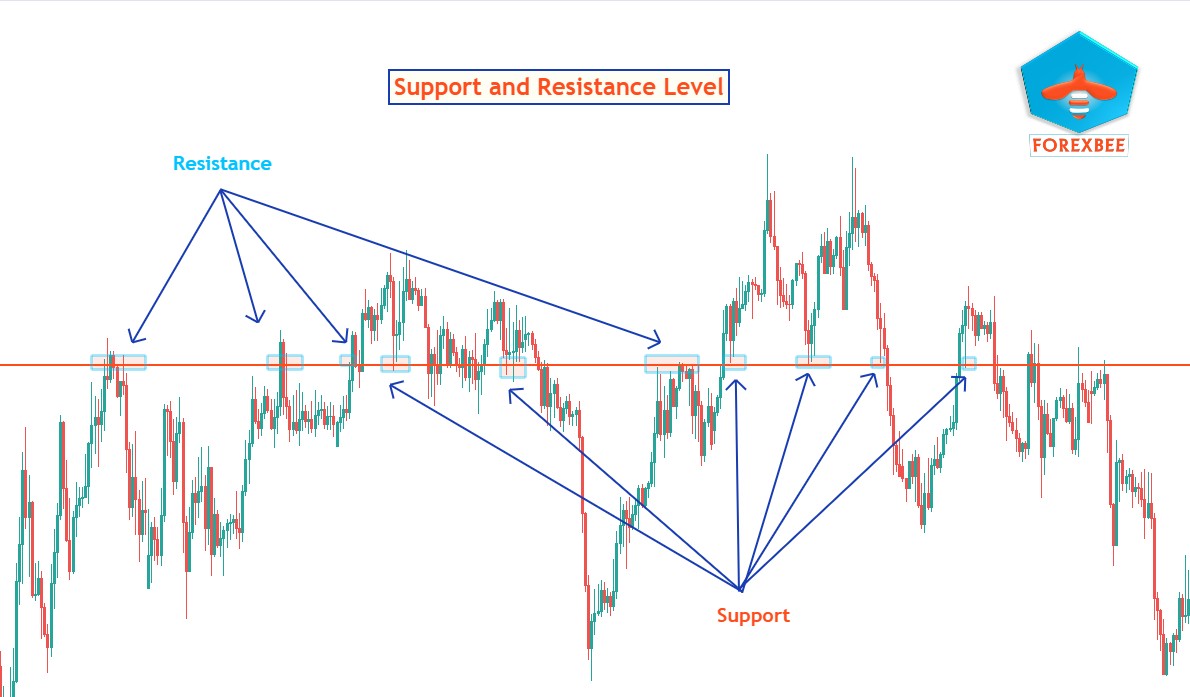
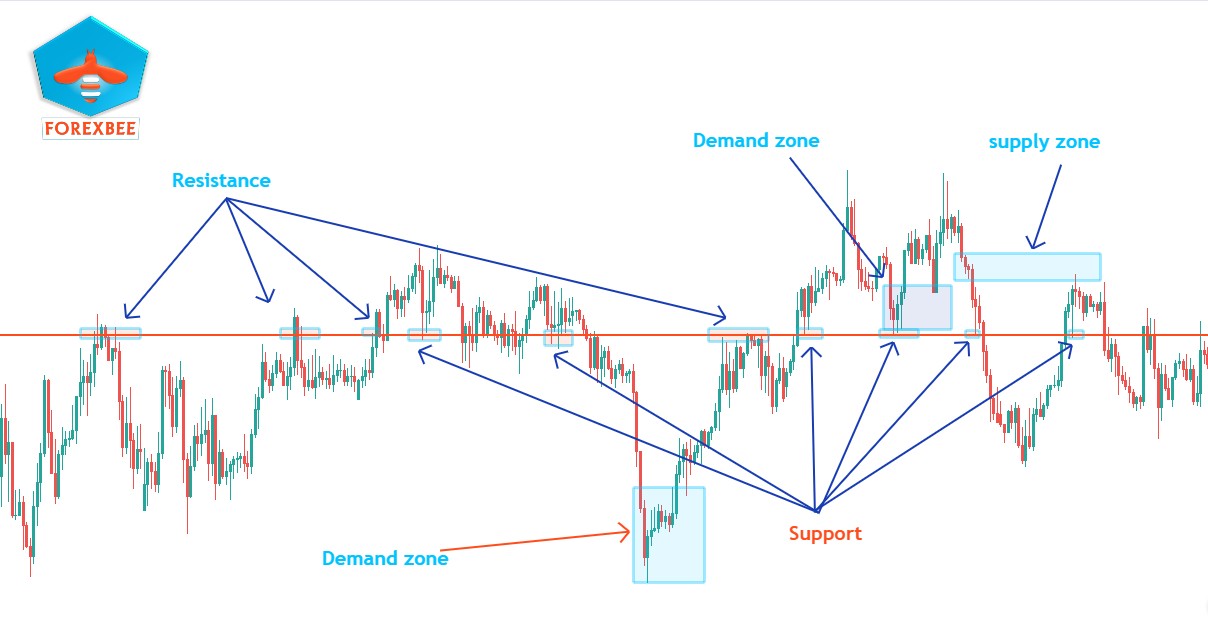
Now we will come to our main point of discussion here. Support and Resistance are the areas of attraction to buyers and sellers. For example, Round numbers, Fibonacci levels, Key levels are areas of attraction and price reversal areas. Price spent much time at these levels/ zones. Every time price comes to these levels it tends to take a reversal or breakout. We will zoom out the chart and confirm a valid level using history. On every reversal, the Level/zone will become stronger and the price will break it forcefully later. On the other hand, if Price will break the support zone then support will become resistance and vice versa. See the chart below for a clear view of support and resistance.
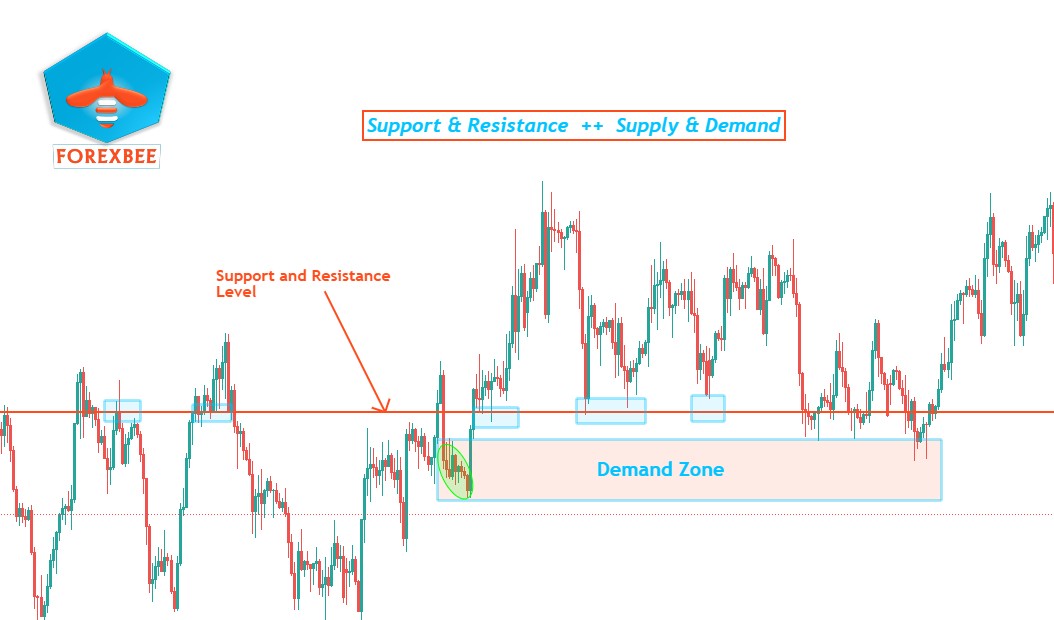
The supply and demand zone is a fresh untouched area where price spent much less time. We don’t watch in the history of a currency pair for the validity of this zone. Two big candles and one base candles make an SnD zone.
See the chart below. I will use the same chart as used above for your better understanding.
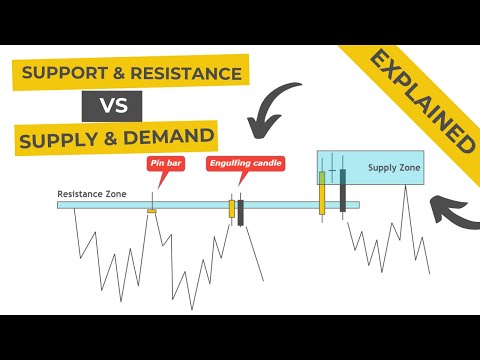
SnD + SnR Trading Setup
After reading this article, I hope you are now able to distinguish between SnD and SnR zone. Not only this, you can combine both zones to make a high probability setup. Supply and Demand zone at support and resistance level works best. See in the chart below
This is a complete setup. By adding more confluences to this setup one can become a profitable trader but it’s not so easy.
Practice Makes a Man Perfect.
I hope you will like this Article. For any Questions Comment below, also share by below links. Use Tradingview for technical analysis instead of mt4. Join Telegram to get trade ideas free.
Thanks
Note: All the viewpoints here are according to the rules of technical analysis. we are not responsible for any type of loss in forex trading.
I like to work with forever
Greetings from Florida! I’m bored to tears at work so I decided to check out your website on my iphone during lunch break. I really like the knowledge you present here and can’t wait to take a look when I get home. I’m shocked at how fast your blog loaded on my cell phone .. I’m not even using WIFI, just 3G .. Anyways, excellent site!
Thanks
How to know the candlestick do breakout and confirmation..?
Candle must be a big candle. confirmation can be done using correlation
Will you please share the screen shot of the Fibonacci settings for plotting demand and supply zones for intraday trading