
When you’re trading in Forex, it’s super important to understand what the big guys in the market are doing. These big guys include the large institutions, banks, and really experienced traders. They have certain strategies and patterns they follow, which we call smart money concepts. These are kind of like the secret game plans that guide big market moves and help them decide when to buy, sell, or just wait.
Here’s the cool part: there are special indicators out there that are all about these smart money concepts. These indicators help us get a sneak peek into what these major players might be up to. When you use these smart money indicators, you’re doing more than just reacting to what the market is doing; you’re actually getting ahead of it, thinking and acting like those big market players.
Next, we’re going to look at each of these smart money indicators. You’ll learn what they are, how they work, and how you can use them in your trading to stay one step ahead.
What Are Smart Money Indicators?
Smart money indicators are special tools in Forex trading that show us what the market’s biggest players are doing. These big players are usually large financial institutions or experienced traders with a lot of influence on the market.
These indicators are super helpful because they give us hints about where the market might be heading. They can tell us if these big players are buying, selling, or waiting. By using these indicators, we can make smarter decisions about when to enter or exit trades, follow the trends set by these influential traders, and avoid common trading mistakes. Essentially, they help us trade smarter by following the footsteps of the most successful players in the market.
List of Smart Money Indicators
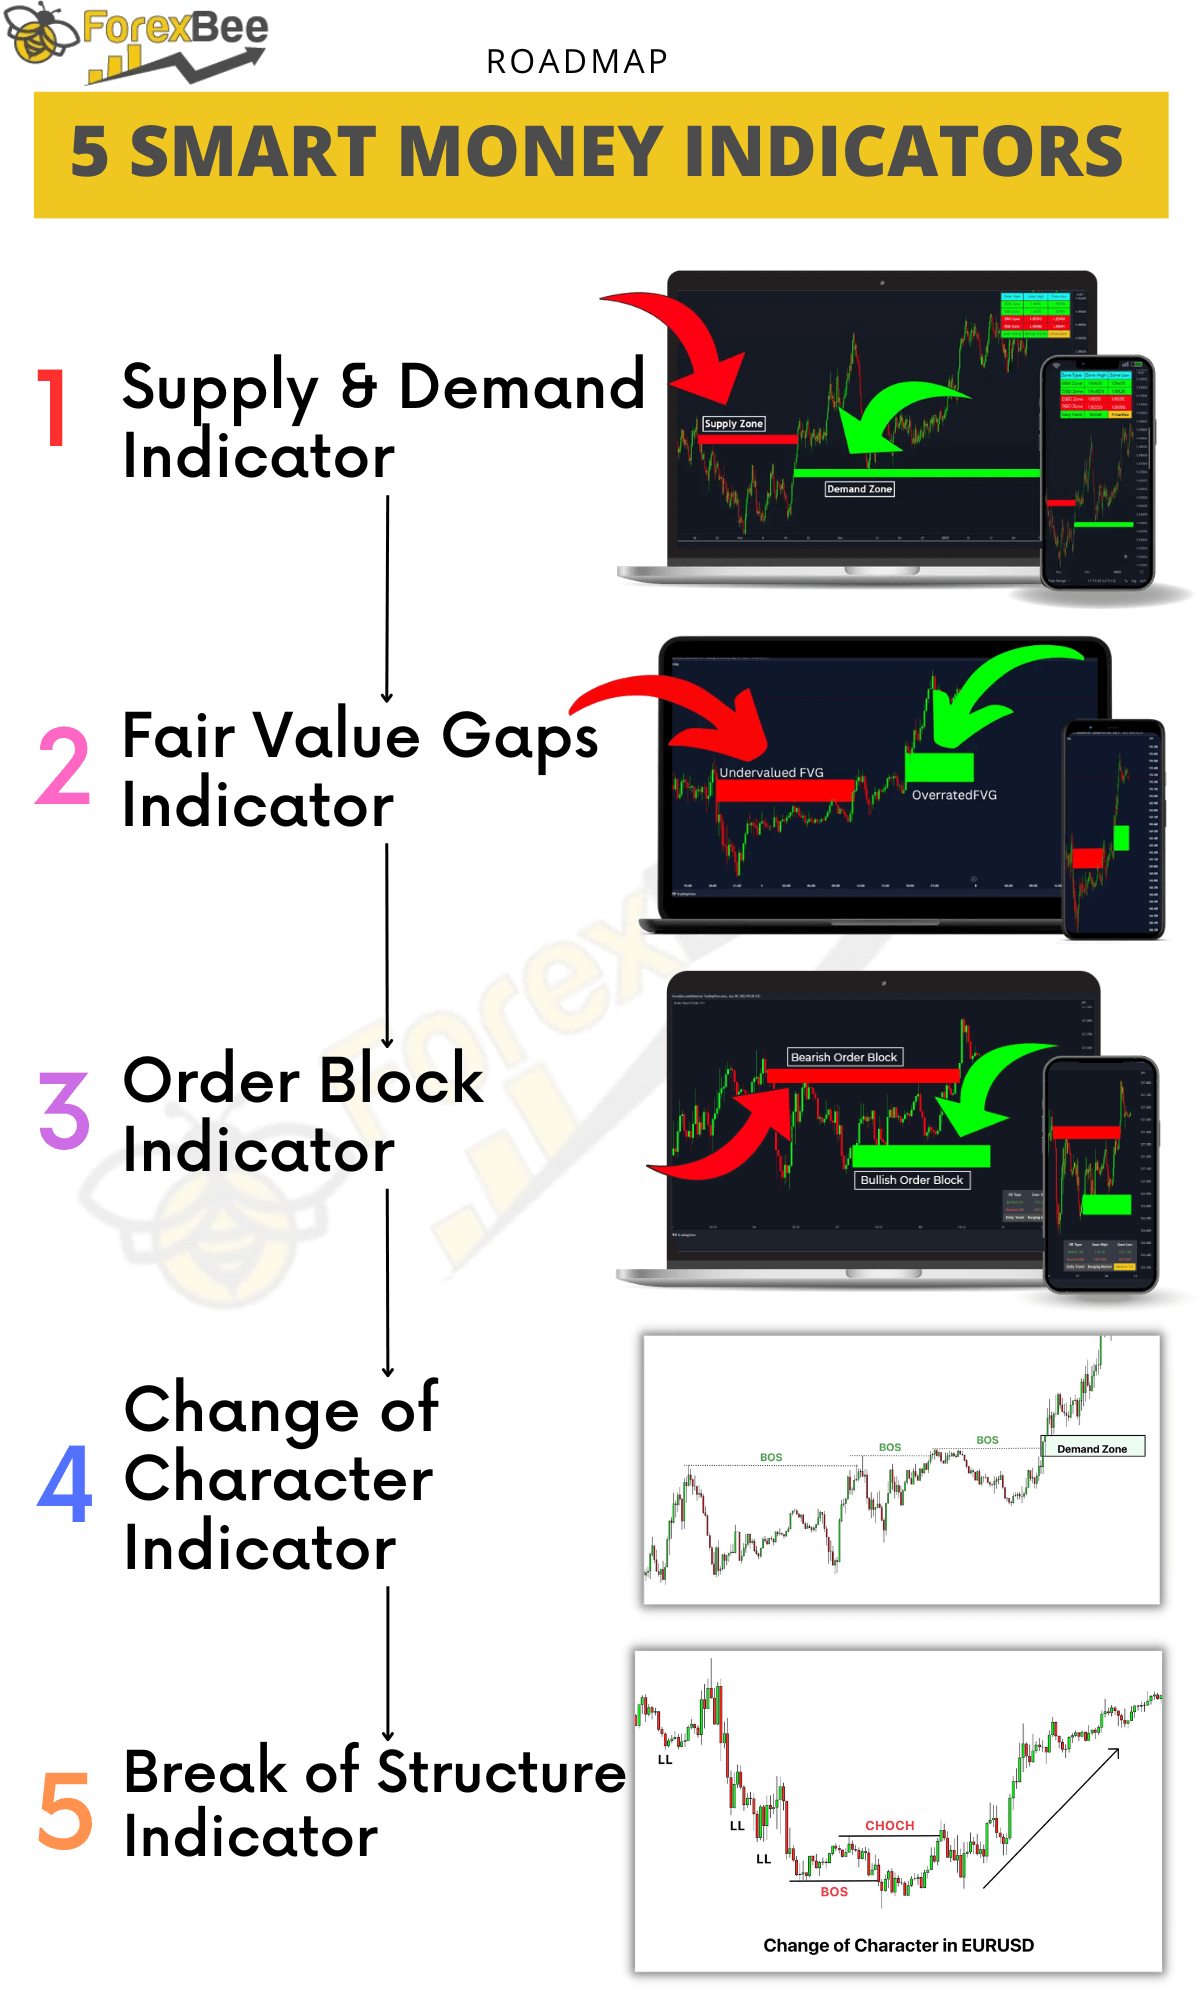
Here’s a brief overview of some key smart money indicators in Forex trading, each offering unique insights into market dynamics:
| Indicator | Function |
|---|---|
| Supply and Demand | Identifies zones for pin point entry. |
| Fair Value Gap | Shows price gaps as potential targets. |
| Order Block | Pinpoints where big orders are placed. |
| Change of Character (CHoCH) | Signals a shift in market trends. |
| Break of Structure (BoS) | Indicates continuation of previous trend. |
Indicator 1: Supply and Demand Indicator
Definition:
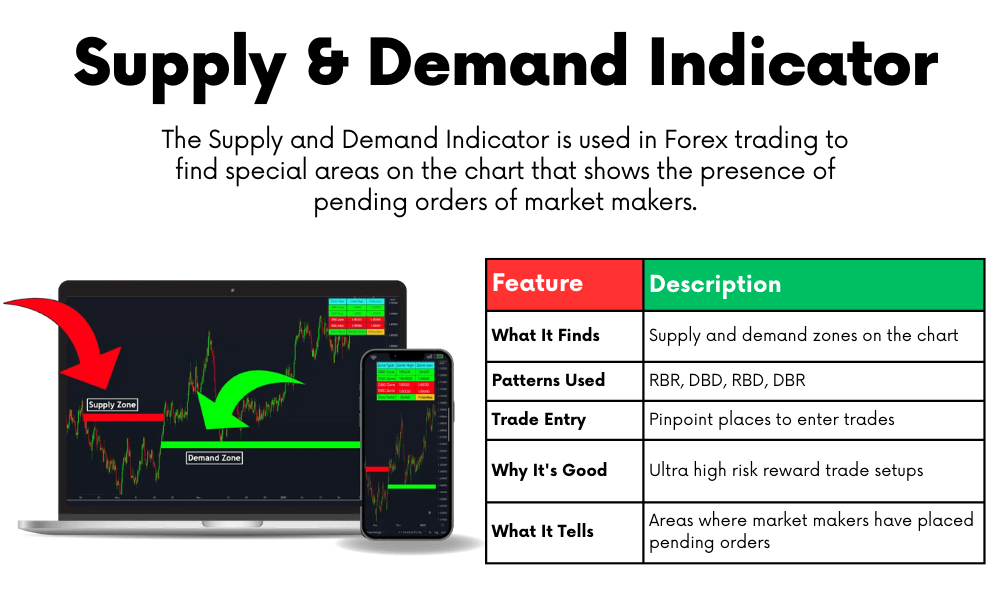
The Supply and Demand Indicator is used in Forex trading to find special areas on the chart that shows the presence of pending orders of market makers.
How It Works:
This indicator looks for specific patterns on the chart, like Rally Base Rally (RBR), Drop Base Drop (DBD), Rally Base Drop (RBD), and Drop Base Rally (DBR). These patterns help to spot where big traders might have set orders to buy or sell a lot. When the price comes back to these areas, it often starts a big move up or down. This is because the big traders’ orders are getting filled. This indicator is great for finding really good spots to enter a trade with a chance of making a lot of profit compared to the risk.
Here’s a simple table about the Supply and Demand Indicator:
| Feature | Description |
|---|---|
| What It Finds | Supply and demand zones on the chart |
| Patterns Used | RBR, DBD, RBD, DBR |
| Trade Entry | Pinpoint places to enter trades |
| Why It’s Good | Ultra high risk reward trade setups |
| What It Tells | Areas where market makers have placed pending orders |
Indicator 2: Fair Value Gap Indicator
Definition:
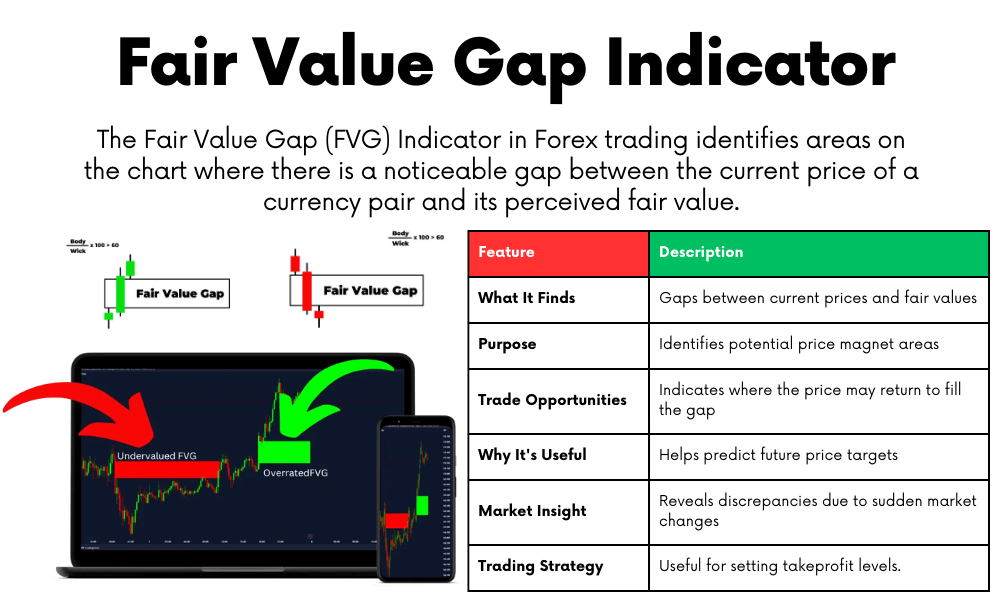
The Fair Value Gap (FVG) Indicator in Forex trading identifies areas on the chart where there is a noticeable gap between the current price of a currency pair and its perceived fair value. These gaps often act as magnets for price movements.
How It Works:
The FVG Indicator works by pinpointing areas on the chart where the price rapidly moved up or down, leaving a gap. These gaps suggest a discrepancy between the asset’s current price and its fair value, often due to sudden market movements or reactions to news events. When identified, these gaps can be strategic areas for traders to watch. The price is likely to move back to these gaps to ‘fill’ them, creating potential opportunities for entry or exit.
Here’s a simple table about the Fair Value Gap Indicator:
| Feature | Description |
|---|---|
| What It Finds | Gaps between current prices and fair values |
| Purpose | Identifies potential price magnet areas |
| Trade Opportunities | Indicates where the price may return to fill the gap |
| Why It’s Useful | Helps predict future price targets |
| Market Insight | Reveals discrepancies due to sudden market changes |
| Trading Strategy | Useful for setting takeprofit levels. |
Indicator 3: Order Block Indicator
Definition:
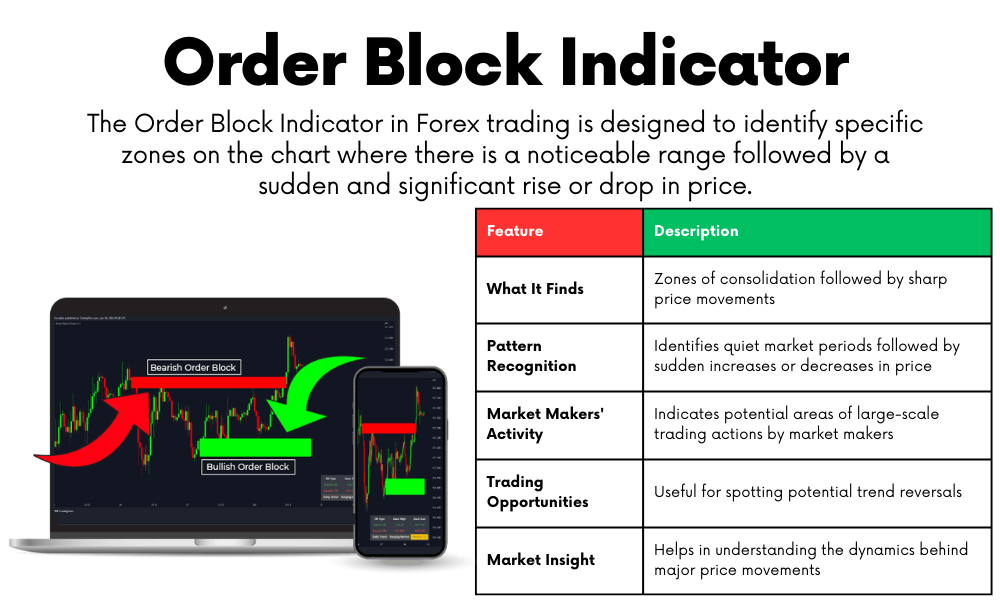
The Order Block Indicator in Forex trading is designed to identify specific zones on the chart where there is a noticeable range followed by a sudden and significant rise or drop in price. This pattern reflects the activity of market makers, indicating areas of potential large-scale trading actions.
How It Works:
The Order Block Indicator focuses on areas where the market shows a period of consolidation or ‘quiet’ trading, followed by a sharp movement either upwards or downwards. These areas are significant because they often represent points where market makers and large institutional traders have placed substantial orders. The sudden price movement indicates the filling of these orders, making these zones critical for identifying potential trend reversals or continuations.
Here’s a simple table about the Order Block Indicator:
| Feature | Description |
|---|---|
| What It Finds | Zones of consolidation followed by sharp price movements |
| Pattern Recognition | Identifies quiet market periods followed by sudden increases or decreases in price |
| Market Makers’ Activity | Indicates potential areas of large-scale trading actions by market makers |
| Trading Opportunities | Useful for spotting potential trend reversals |
| Market Insight | Helps in understanding the dynamics behind major price movements |
Indicator 4: Change of Character (CHoCH) Indicator
Definition:
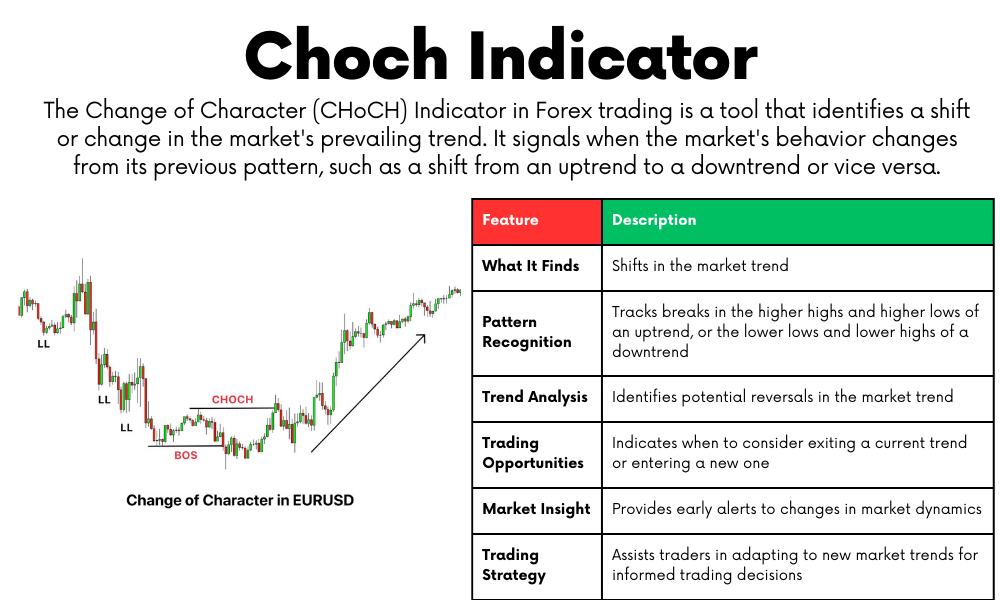
The Change of Character (CHoCH) Indicator in Forex trading is a tool that identifies a shift or change in the market’s prevailing trend. It signals when the market’s behavior changes from its previous pattern, such as a shift from an uptrend to a downtrend or vice versa.
How It Works:
This indicator focuses on the sequence of highs and lows that form a trend. In an uptrend, for instance, the market typically forms higher highs and higher lows. The CHoCH Indicator comes into play when this pattern is disrupted – for example, if after a series of higher highs and higher lows, the market suddenly drops and forms a lower low, it indicates a potential change in trend, suggesting that the uptrend may be shifting to a downtrend. Similarly, in a downtrend characterized by lower lows and lower highs, if the market unexpectedly rises and forms a higher high, it may signal a change to an uptrend.
Here’s a simple table about the Change of Character (CHoCH) Indicator:
| Feature | Description |
|---|---|
| What It Finds | Shifts in the market trend |
| Pattern Recognition | Tracks breaks in the higher highs and higher lows of an uptrend, or the lower lows and lower highs of a downtrend |
| Trend Analysis | Identifies potential reversals in the market trend |
| Trading Opportunities | Indicates when to consider exiting a current trend or entering a new one |
| Market Insight | Provides early alerts to changes in market dynamics |
| Trading Strategy | Assists traders in adapting to new market trends for informed trading decisions |
Indicator 5: Break of Structure (BoS) Indicator
Definition:
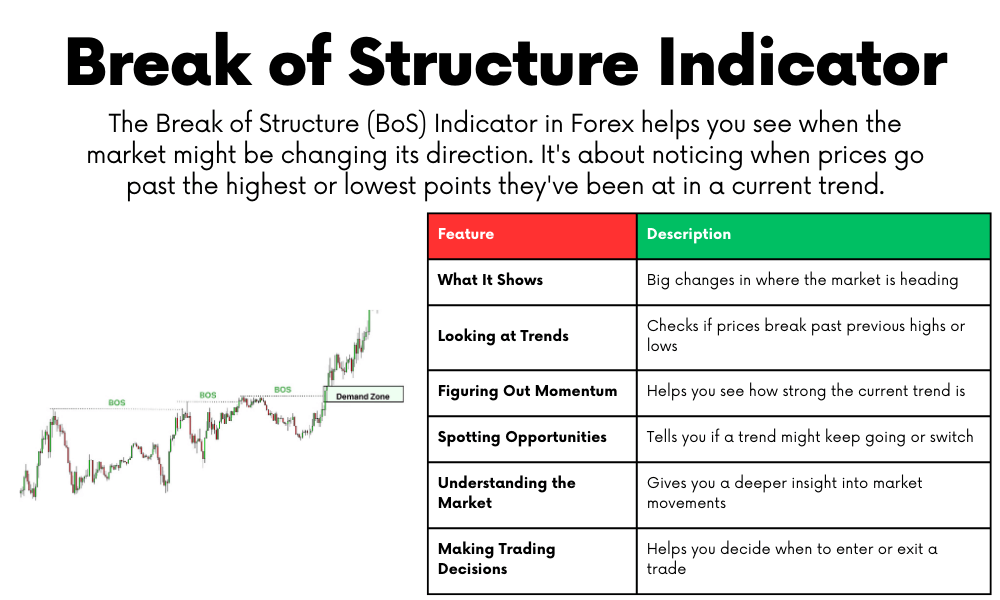
The Break of Structure (BoS) Indicator in Forex helps you see when the market might be changing its direction. It’s about noticing when prices go past the highest or lowest points they’ve been at in a current trend. This means the trend will keep going or start to change.
How It Works:
- In an uptrend (when prices are generally going up), a Break of Structure happens if the price drops below where it had been low before. This might mean the upward trend is slowing down or stopping.
- In a downtrend (when prices are generally going down), a Break of Structure happens if the price goes higher than where it had been high before. This might signal the downtrend is losing steam and possibly reversing to an uptrend.
This indicator is really useful to understand what’s happening in the market now and what might happen next.
Here’s a simple table about the Break of Structure (BoS) Indicator:
| Feature | Description |
|---|---|
| What It Shows | Big changes in where the market is heading |
| Looking at Trends | Checks if prices break past previous highs or lows |
| Figuring Out Momentum | Helps you see how strong the current trend is |
| Spotting Opportunities | Tells you if a trend might keep going or switch |
| Understanding the Market | Gives you a deeper insight into market movements |
| Making Trading Decisions | Helps you decide when to enter or exit a trade |
Supply, Demand, and Fair Value Gap Combo Strategy
This strategy in Forex trading combines the Supply and Demand Indicator with the Fair Value Gap Indicator to help make better trading decisions.
Using Supply and Demand Indicator for Entry and Stoploss:
- The Supply and Demand Indicator draws zones on your chart using patterns like Rally Base Rally (RBR), Drop Base Drop (DBD), Rally Base Drop (RBD), and Drop Base Rally (DBR).
- For Buying: Use demand zones (where the market might go up) to place buy limit orders just above the zone, with a stoploss set just below the zone.
- For Selling: Use supply zones (where the market might go down) to place sell limit orders just below the zone, with a stoploss set just above the zone’s high.
Using Fair Value Gap Indicator for Take Profit:
- The Fair Value Gap Indicator shows two types of gaps: undervalued and overvalued.
- Undervalued Gaps: When the price is lower than its fair value, it’s likely to rise to fill the gap. Set your take profit for buy orders around these gaps.
- Overvalued Gaps: When the price is higher than its fair value, it’s likely to fall to fill the gap. Set your take profit for sell orders around these gaps.
- Why It Works: The market tends to move to fill these fair value gaps, making them reliable targets for your take profit levels.
Here is the buy and sell strategy using the Supply and Demand Indicator combined with the Fair Value Gap Indicator:
| Order Type | Entry Point | Stoploss | Take Profit Target |
|---|---|---|---|
| Buy | Above Demand Zone | Below Demand Zone | Near Undervalued FVG |
| Sell | Below Supply Zone | Above Supply Zone | Near Overvalued FVG |
By using supply and demand zones for entry and stoploss, and fair value gaps for take profit, this strategy helps you enter the market at high-probability points and exit with a good profit, all based on how big traders are likely to act.
Conclusion
We’ve covered a lot about smart money indicators in Forex trading. These tools, like the Supply and Demand Indicator, Fair Value Gap Indicator, Order Block Indicator, Change of Character Indicator, and Break of Structure Indicator, are key to understanding the market movements influenced by the big players.
Remember, the Supply and Demand Indicator helps you find the right spots to enter trades and set stoplosses, while the Fair Value Gap Indicator is great for figuring out where to take your profits. Using these indicators together can really boost your trading strategy, giving you a better chance of catching profitable trades.
Forex trading can be complex, but with these indicators, you’re getting insights that can help simplify your decisions. Happy Trading!