
Definition
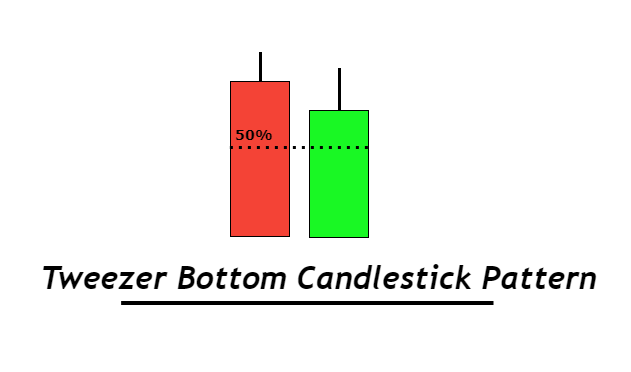
The tweezer bottom is a reversal candlestick pattern that consists of two opposite colour candlesticks and the closing price of the first bearish candlestick will be equal to the opening price of the second bullish candlestick. Both candlesticks do not have wicks/shadows on the lower side. This is a major indication of the tweezer candlestick that both candlesticks have almost identical shapes.
It represents the price trend reversal from bearish into a bullish trend. Due to the high winning ratio, it is widely used for technical analysis in trading.
The tweezer top is the opposite of the tweezer bottom candlestick pattern.

Find High Probability Trades with this ADVANCED Candlestick Patterns Course
The Ultimate Candlestick Patterns Course That Will Help You To Trade Better
How to identify tweezer bottom candlestick on price chart?
To find out the Tweezer bottom pattern on the candlestick chart perfectly, follow the following steps
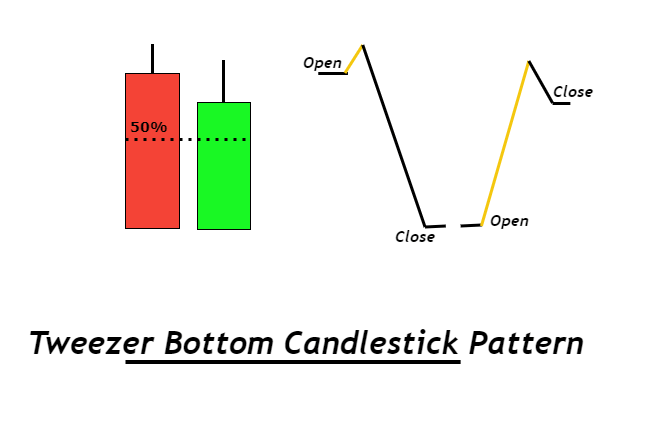
- The first and second candlestick should have a large body to wick ratio. It should be greater than 60%. Because the body of candlestick indicates the strength of buyers/sellers.
- Closing price of first bearish candlestick and the opening price of the second bullish candlestick should be same.
- The second bullish candlestick must close above the 50% price level of previous candlestick.
Look at the image below for a better understanding of the price pattern.
The third step is mandatory because closing above the 50% level is a direct indication of a trend reversal.
How does tweezer bottom is related to pin bar candlestick?
By analyzing the opening and closing prices of candlesticks, you will come to know that a tweezer top pattern on a lower timeframe will make a pin bar on a higher timeframe.
Still confused ‼
Two lower timeframe(15 minutes) candlesticks will make one Higher timeframe (30 minutes) candlestick. For example, the opening of the first candlestick, in the case of the tweezer pattern, and the closing price of the second candlestick will always be close to each other. There will be a small shadow at the top of candlesticks.
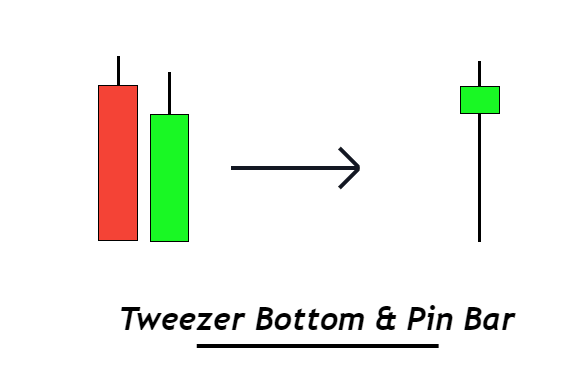
When you will combine these two candlesticks then a bullish pin bar or gravestone Doji will form resulting in a bullish trend reversal.
Tweezer bottom: Information Table
| Features | Explanation |
|---|---|
| Number of Candlesticks | 2 |
| Prediction | Bullish trend reversal |
| Prior Trend | Bearish trend |
| Counter Pattern | Tweezer top |
Trading psychology of tweezer bottom candle
In the candlestick pattern, there is a strong reason behind the formation of the different structures of each candlestick. By analyzing the structure of candlesticks, you can see the activity of professional traders on the price chart.
The first bearish candlestick has a large body to wick ratio indicates that sellers are continuously pushing the market in the downward direction. A big body of the candlestick is a representation of break of a strong support level. Whenever a large body candlestick forms on the chart then it is a direct indication of break of a strong price level.
When a strong support level breaks then retail traders prefer to sell. In case of a false breakout, institutional traders are waiting for the support level breakout. The market actually breaks the level to fill the pending buy orders of institutions. That’s why after the closing of the bearish candlestick, a new bullish candlestick opens and breaks the 50% level without any shadow below the candlestick.
This is how the price reading works.
How to trade tweezer bottom candlestick?
There are three methods to trade tweezer bottom candlestick effectively
- Tweezer bottom at support zone
- Tweezer bottom at Fibonacci golden zone
- Trading during oversold conditions
Method 1: Tweezer bottom at support zone
The support zone on the price chart has the capability of reversing the price trend from bearish into bullish. Tweezer bottom candlestick does the same. That’s why, by combining the effect of both price patterns, the probability of trend reversal will increase.
So prefer to buy an asset by confirmation of tweezer bottom candlestick at support zone
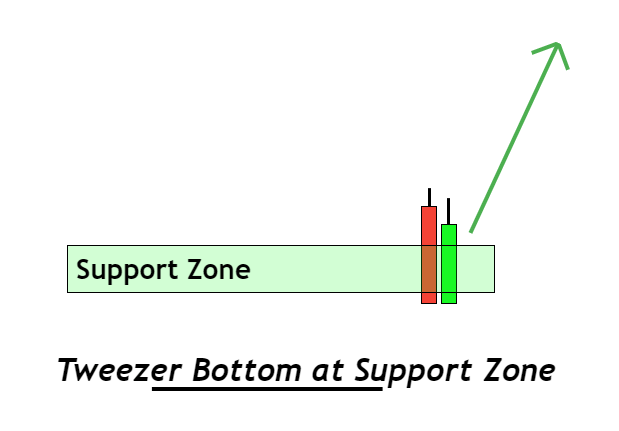
Pro tip: False breakout of support zone will also increase the probability of trend reversal
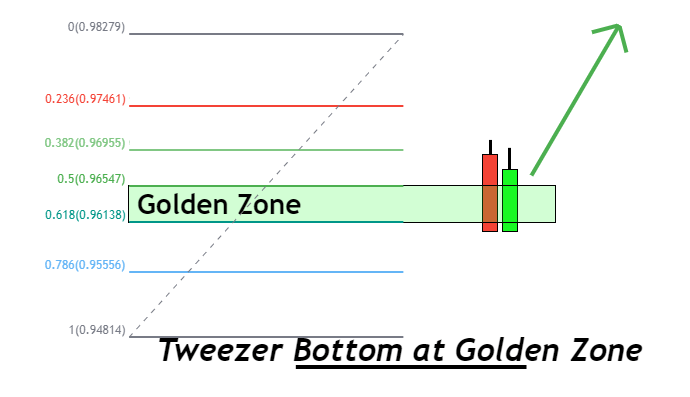
Method 2: Tweezer bottom at Golden zone
Fibonacci golden zone also acts as a strong support zone. It is used by many retail traders to refine support zones. A tweezer bottom pattern at the Golden zone will give rise to a strong trend reversal trade setup.
Method 3: During oversold conditions
Price always moves in the form of cycles because it is a natural pattern. An oversold currency has a high probability of bullish trend reversal instead of buying an already overbought currency. That’s why try to use RSI to check the oversold conditions and buy a currency pair during the oversold condition by confirmation of a tweezer bottom candlestick.
The Bottom Line
Due to the relevancy of the tweezer bottom with pin bar, it is widely used to do technical analysis for long-term and intraday trading.
But it is recommended to use candlestick patterns with the confluence of other technical tools to get profitable results. Because a candlestick pattern within a ranging market structure will not work but it will work in a trending market.