
Introduction
Order blocks in cryptocurrency represent the accumulation or distribution of orders in the crypto market. It represents the price of interest of crypto exchanges and other big market players in crypto trading.
So as a retail trader, if we come to know about the interest of crypto market players in a special price of a cryptocurrency, then we can take advantage of this and trade in the direction of the trend.
In this article, I will explain the working and trading strategy of order blocks in crypto trading. I have already explained the order blocks for forex trading, and I suggest reading that article too because technical analysis works almost identically for crypto and forex trading.
How do the order blocks work in cryptocurrency?
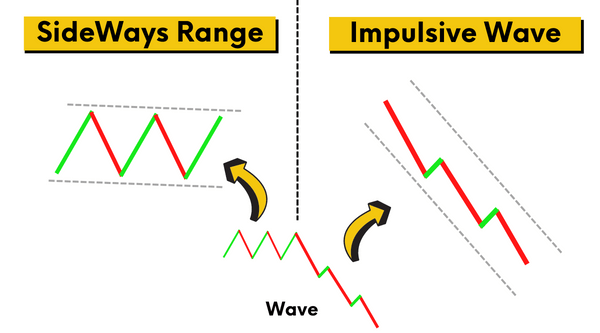
In nature, there are two most basic concepts of a price wave: impulsive wave and retracement wave.
The concept of order blocks is quite similar to this wave. I am teaching you by comparing it with this natural concept to make it easy for you to understand.
For example, in the first section, the price will make a tight range on a candlestick chart. This sideways range shows the indecision of the market. The market breaks that range and makes an impulsive move in the bullish or bearish direction depending on the decision of prominent market players in the crypto market like Binance and Coinbase.
A chunk of market orders
The big impulsive wave consists of big candlesticks showing a chunk of market orders at different price levels. Due to liquidity issues, the big players or institutions cannot buy or sell cryptocurrency at once. That’s why they convert the total amount into small orders to overcome the liquidity issue.
However, if you see a very big and colossal size candlestick, then it is because of ample liquidity available to the big players.
In conclusion, these chunks of orders and sideways price ranges represent the order blocks in cryptocurrency.
The order blocks example in BTCUSD.
In the BTCUSD, you can see several order blocks pattern in different timeframes of BTCUSD. Big institutions like Binance, coinbase and crypto.com play a vital role in forming such types of order block patterns on higher timeframes.
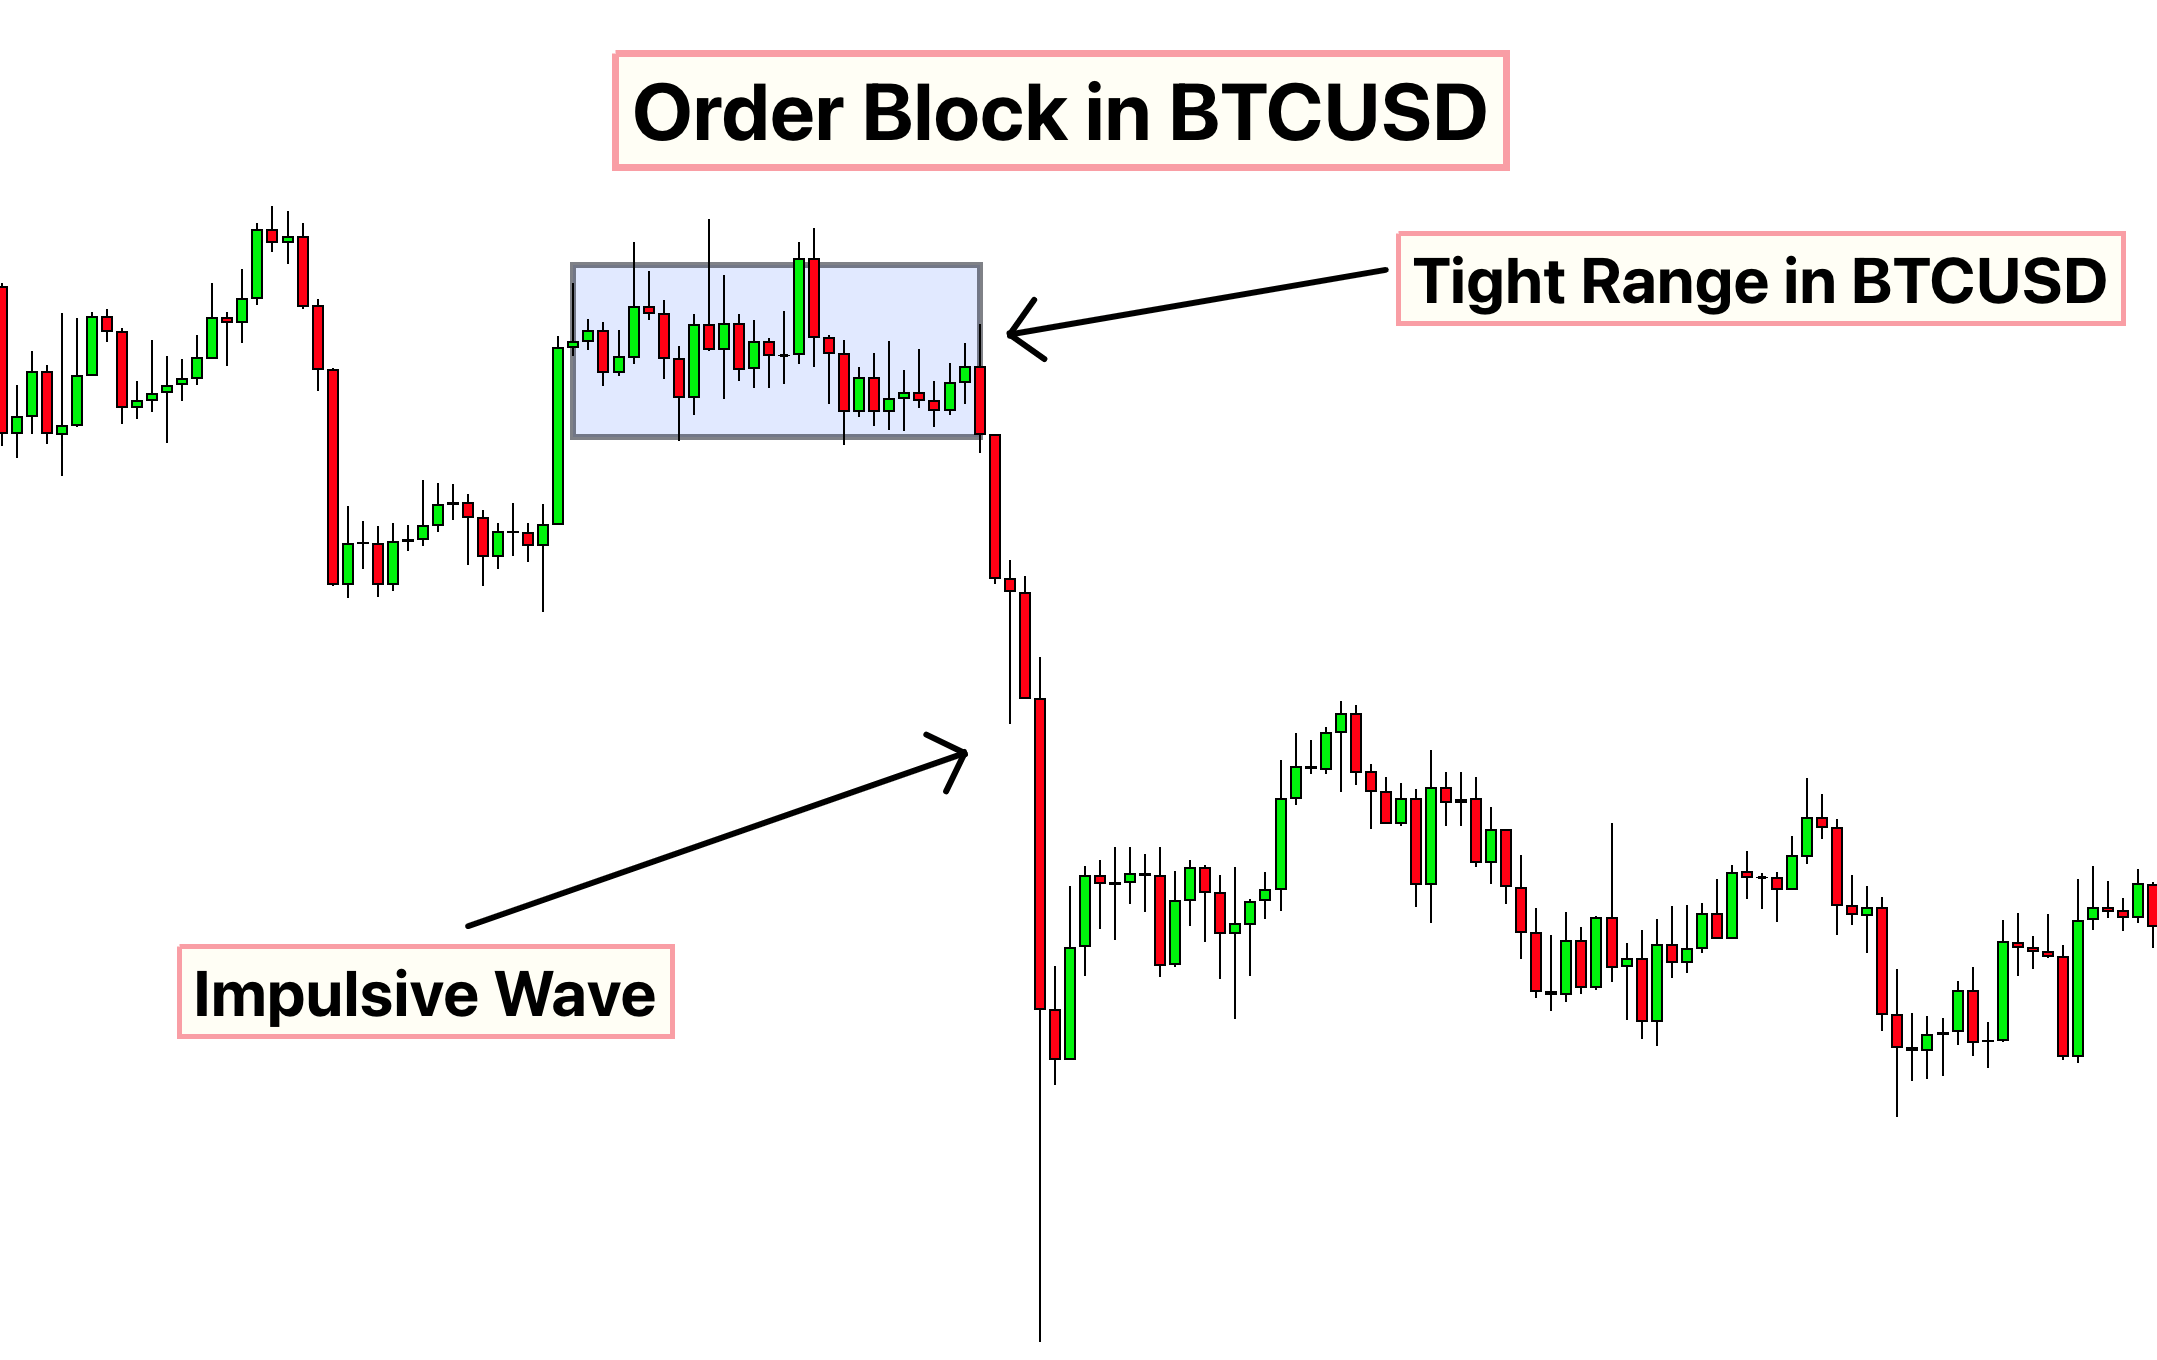
Let me explain with a live example of a daily chart in BTCUSD.
Look at the market crash in BTCUSD that happens after the formation of a tight range. The tight range formed, and the market crashed within a few hours.
This phenomenon represents the order blocks on the chart. The first market was in a decisive phase; then big market players decided the next move, and a crash happened in the crypto market.

Types of order blocks in crypto
Depending on the range breakout, the order blocks are categorised into two types.
If the tight price range in crypto breaks in a bullish direction with an impulsive wave, then a bullish order block forms. However, if the tight range breaks in the bearish direction with an impulsive wave, then a bearish order block forms.
Order block indicator
The Forexbee team has also made an order block indicator based on the price action. It is a straightforward and beginner-friendly indicator that helps traders identify the high-probability order block zones on the candlestick chart.
I highly recommend trying this indicator because it has many features like alerts, customisations, and video course of order blocks.
Click here to get access to Order Block indicator
How does the order block zone form?
It is straightforward to draw the order block zone on the chart. After determining the order block pattern on the candlestick chart, mark the high and low of the tight range. Then use the high and low to draw a rectangle and extend it to the right.
This rectangle will now act as an order block zone. Draw the red rectangle for bearish OB.
How to trade the order blocks in cryptocurrency?
After identifying the order blocks on the candlestick chart, the next step is to build a trading strategy.
There are two methods to trade the order blocks pattern.
Method 1:
We will trade the order block zone using the price retest in this method. When an impulsive waveforms, then the origin of that wave acts as a sweet spot because institutional traders have decided on that level. That’s why we will use that sweet spot to trade.
For example, if a bearish order blocks form, we will wait for the price to return to the Bearish OB zone and open a sell order after confirming bearish candlestick patterns.
If bearish engulfing forms at the bearish OB zone, open a sell order and place stop loss above the zone’s high.
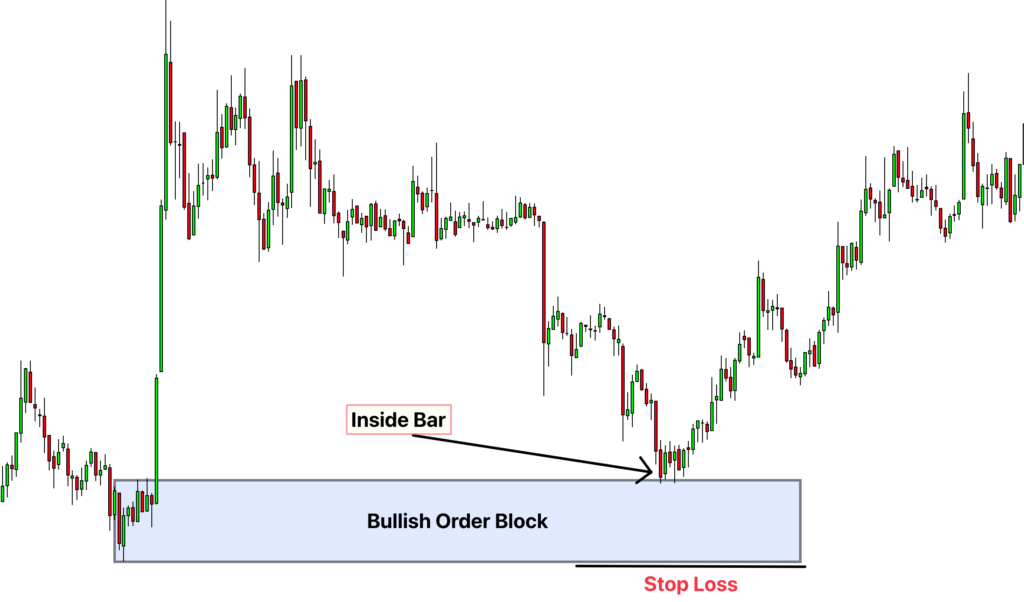
In the same way, if a bullish OB zone forms, we will wait for the price to retrace to that zone. At the zone, we will confirm the zone by forming bullish candlestick patterns like pin bars or inside bar candlesticks. Then we will open a buy order and place a stop loss below the zone’s low.
Like the example of XRPUSD.
We will use the combination of supertrend indicator or ATR or Fibonacci tool to take profit levels.
Method 2:
This method consists of an aggressive trading strategy, and I will not recommend this to beginner crypto traders. This method will capture the impulsive move after the ranging price structure. Because it is a natural process that after the ranging market, the trend will start, and after the trending market, the price range will form.
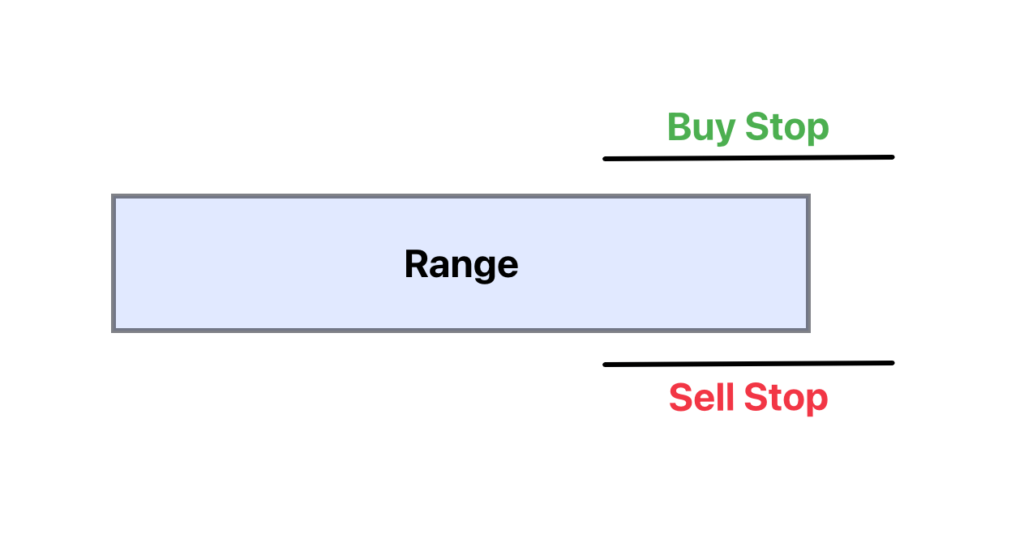
So after the ranging market, if we look at the breakout of the range and open buy/sell trade accordingly, we can make quick and more significant profits. For example, in case of a breakout of a high range, open buy orders or open sell orders on a breakout of a low the range.
But this is more complex than it looks. Market makers mostly form broadening patterns before making a big impulsive wave, and broadening pattern traps many retail buyers and sellers. This also creates liquidity in the market.
Look at the image below for a better understanding of this pattern.
Due to this broadening pattern, I will not recommend this method to beginner traders, and you should stick to the first method.
The conclusion
Technical analysis is successful if you relate the market patterns to nature. Because our universe follows a set of rules and patterns, those patterns also work everywhere and in the trading markets.
I have taught you the order block pattern for the crypto market. I recommend you backtest this pattern at least 100 times to master it, and don’t forget to check the order block indicator.
If you have any questions about the order blocks, comment below.