
Introduction
Supply and demand trading is a key concept in technical analysis that helps traders find precise entry points. This approach often leads to trades with a high risk-reward ratio, meaning you can achieve bigger wins while keeping your risk small. However, it’s important to remember that no strategy in technical analysis is 100% accurate.
To increase the chances of success, it’s a good idea to use supply and demand trading in combination with other price action patterns. In this article, I’m going to show you how to combine supply and demand with trendline strategies. This combination can lead to a very accurate and effective trading strategy.
Make sure to read the whole article without skipping any steps. Each part is crucial to understanding how to make the most of this trading strategy.
Understanding the Supply Demand and Trendline Basics
Before learning the strategy, it’s essential to grasp the concepts of supply and demand zones and trendlines. These foundational elements are necessary in developing a complete understanding of our trading approach.
Supply and Demand Zones
Supply and demand zones are critical areas on a chart that not only indicate where the price has made a significant move but also help in pinpointing where institutional pending orders are likely present. These zones provide traders with insights into potential market turning points and are essential for strategizing trades.
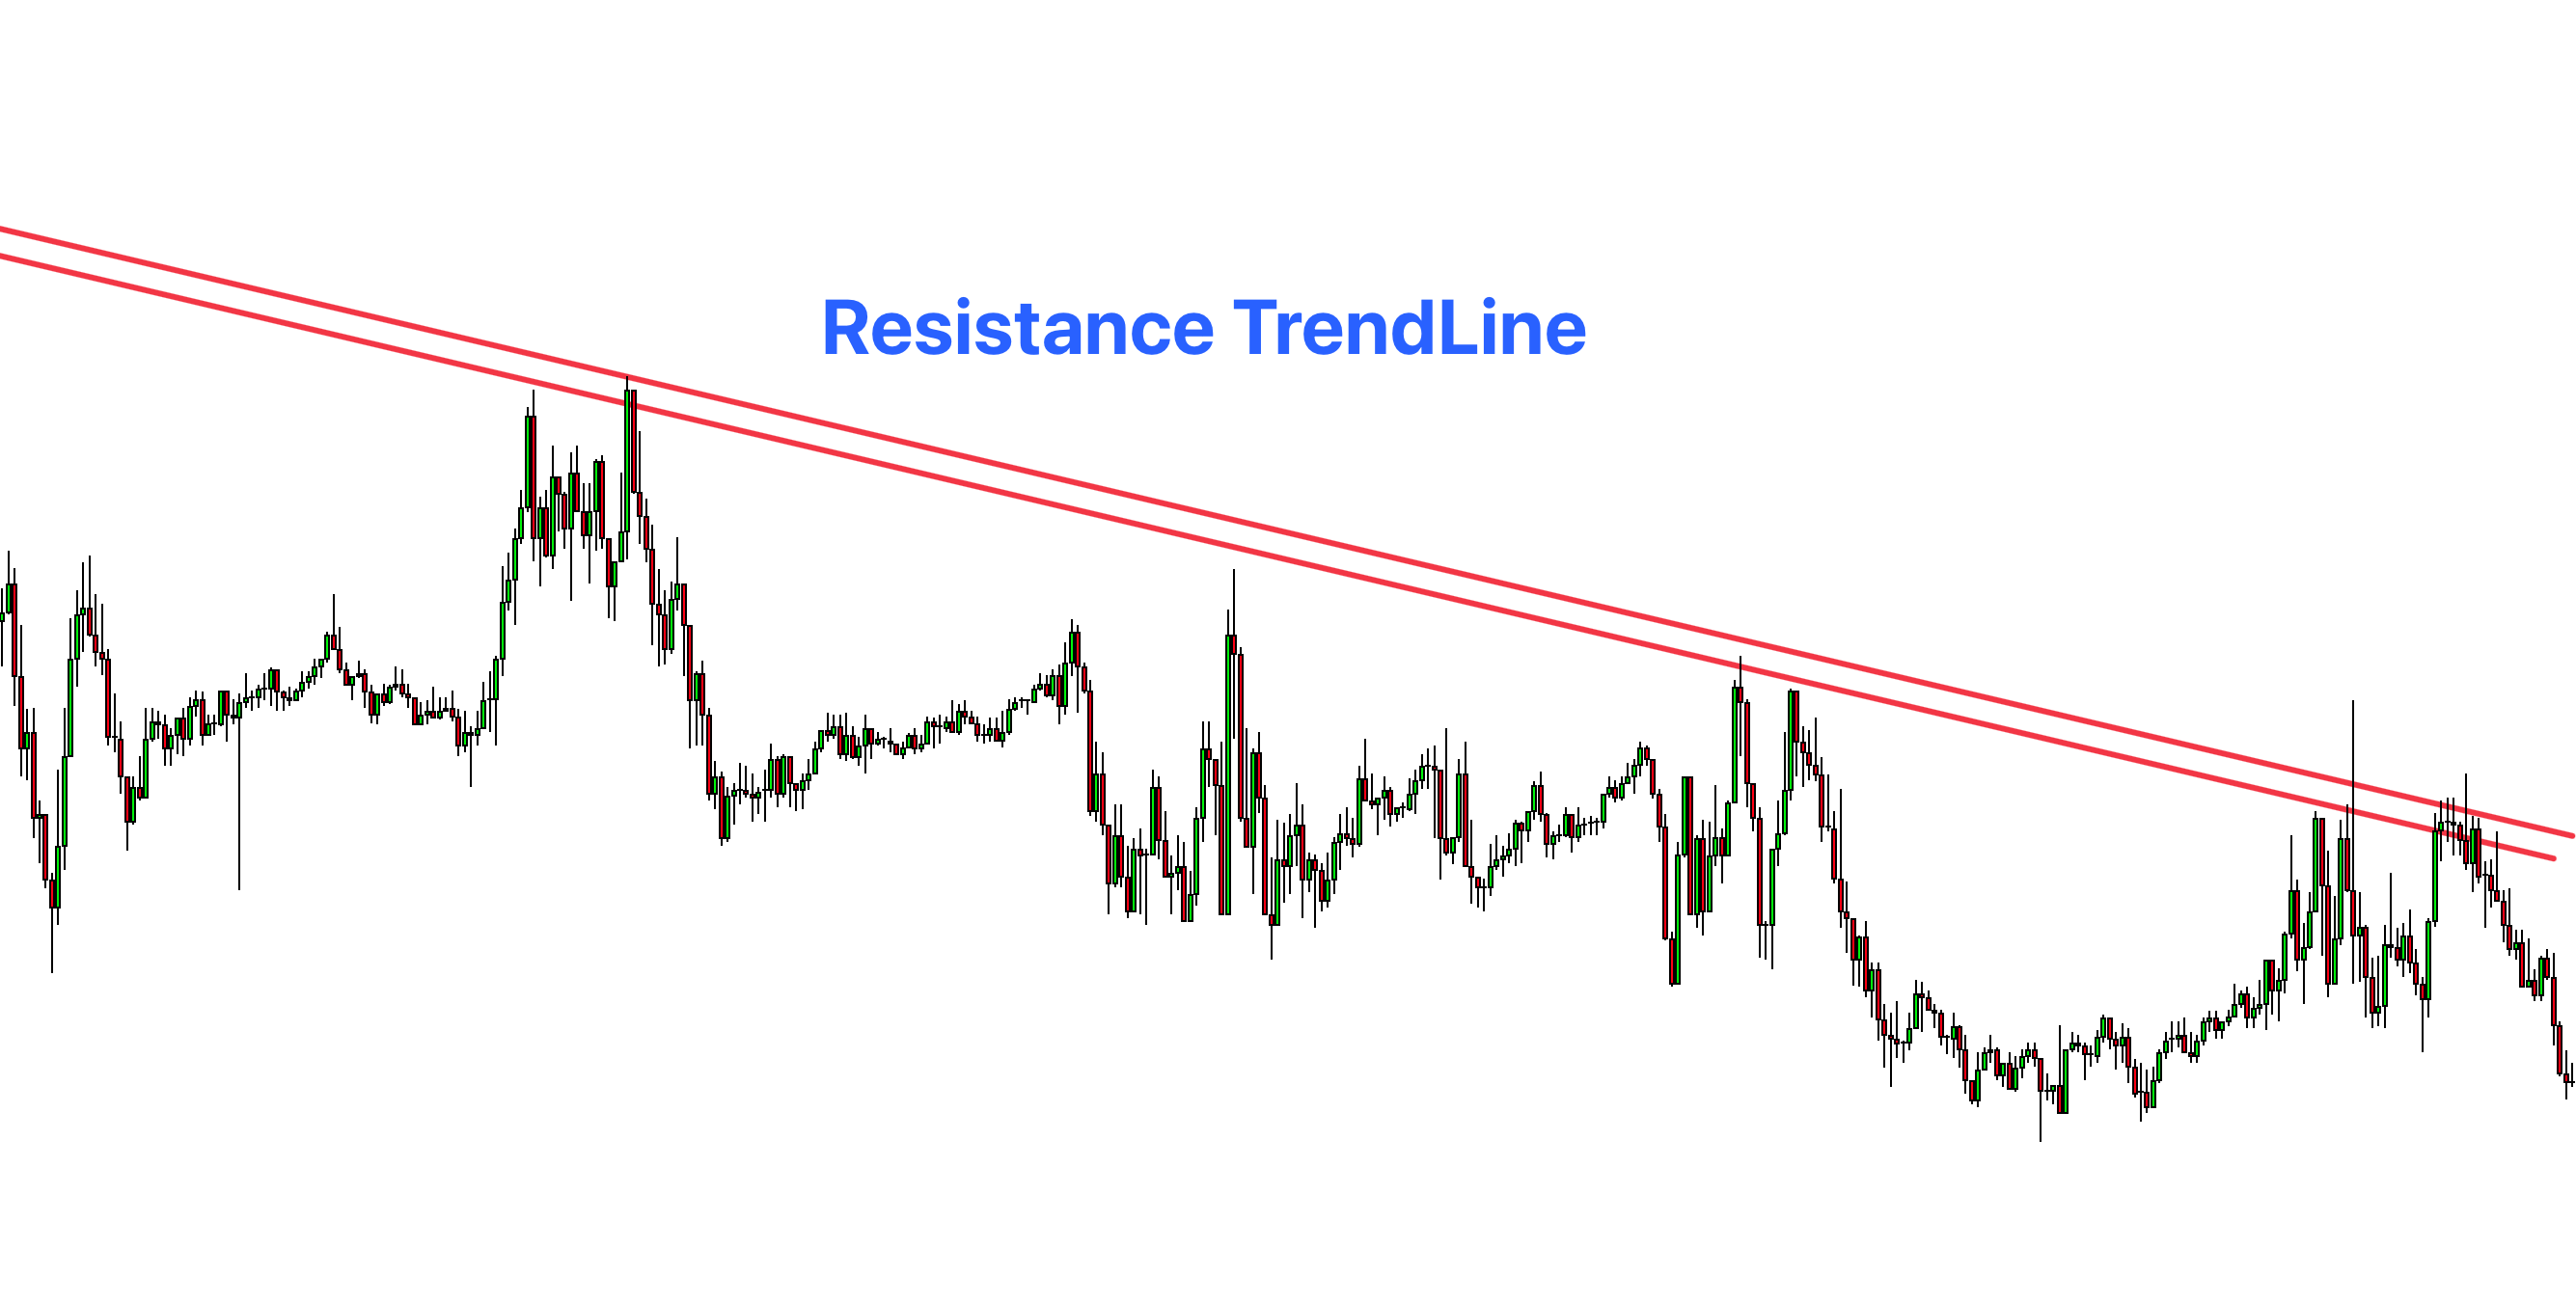
To define these zones, we look at the high and low of the base region, a consolidation phase in the market where the price stabilizes before making a significant move. Key patterns to recognize within these zones include:
- Rally-Base-Rally (RBR): This pattern indicates a demand zone. It’s formed when the price rallies (goes up), forms a base (consolidates), and then rallies again.
- Drop-Base-Drop (DBD): The opposite of RBR, DBD signifies a supply zone. Here, the price drops, forms a base, and then drops again.
- Drop-Base-Rally (DBR): This pattern shows a price drop, followed by consolidation (base), and then a rally, highlighting a potential reversal area.
- Rally-Base-Drop (RBD): In RBD, the price rallies, forms a base, and then drops, indicating a change in trend direction.
For complete understanding of supply and demand zones, Read here.
Trendlines
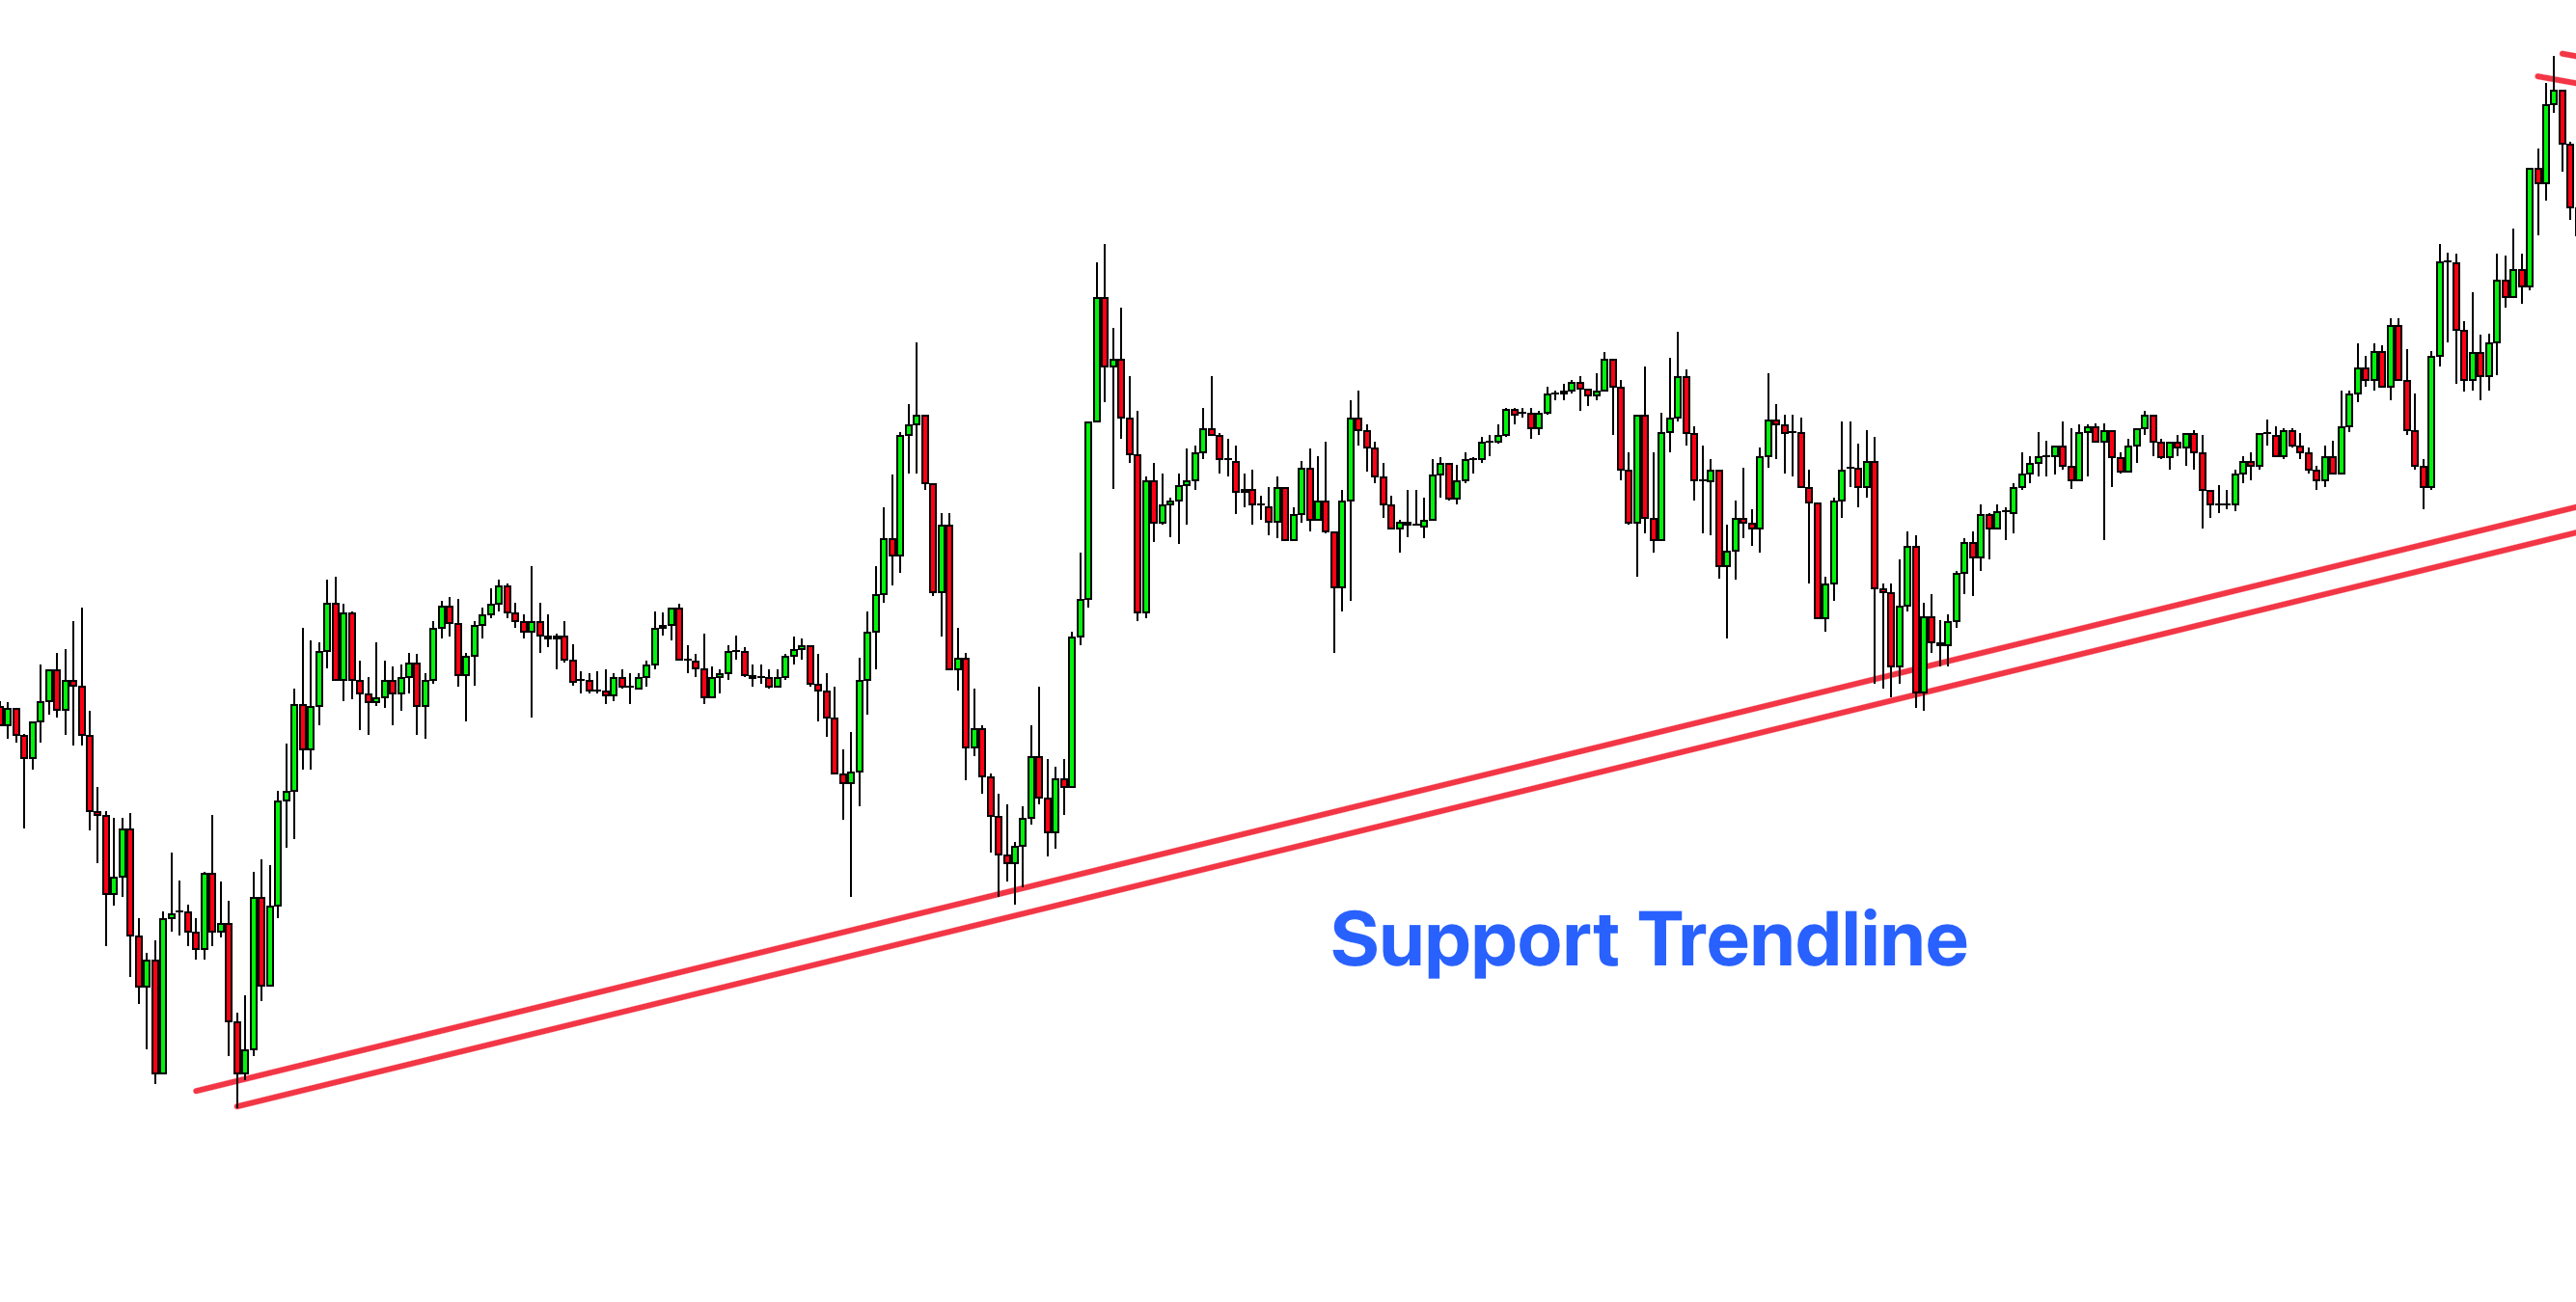
Trendlines are a visual representation of support and resistance in price movements. They are drawn on charts to connect price highs or lows, forming a line of resistance or support.
- Resistance Trendline: Formed by connecting the highs in a downward trend. It acts as a ceiling, showing where the price might find resistance and potentially reverse.
- Support Trendline: Created by connecting the lows in an upward trend. It acts like a floor, indicating where the price could find support and possibly bounce back.
For a trendline to be considered valid, it should have an angle of 45 degrees or lower. Moreover, there should be at least 2 to 3 touches of the trendlines. A complete price swing is also necessary to confirm a trendline’s validity. This means the price must touch the line, move away, and then return to it. Understanding these characteristics ensures we are working with reliable trendlines in our analysis.
Learn in detail to draw the trendline here.
Confluence of Trendline and Supply Demand Zones
In trading, price often bounces off both supply and demand zones and trendlines. If these two factors – a trendline and a supply or demand zone – meet at the same price level, that point has a higher chance of being where the price will bounce. This is because, while prices don’t always respect supply and demand zones or trendlines alone, combining these two elements increases the likelihood of a successful trade.
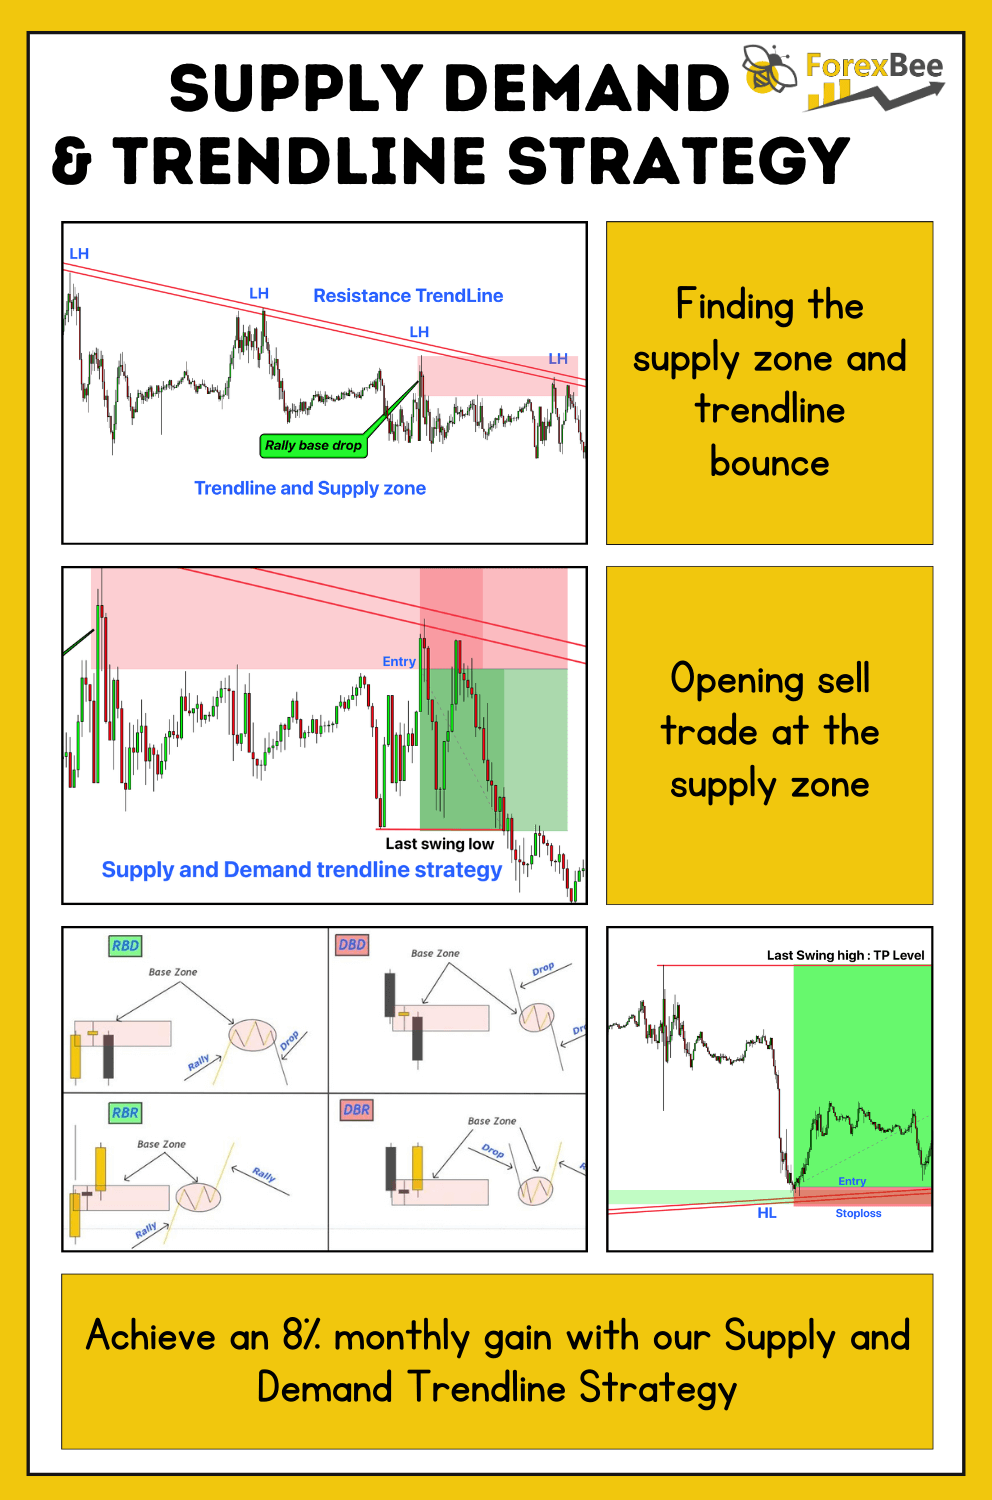
Resistance Trendline with Supply Zone
To find sell trade opportunities, we will trade by adding confluence of resistance trendline with the supply zones.
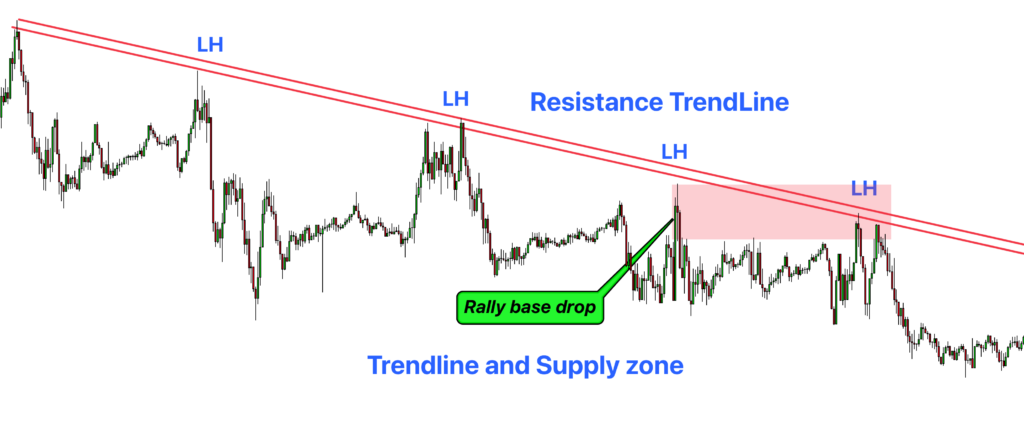
Here is the step by step guide:
- Step 1: Draw a trendline during a downtrend, connecting lower price highs.
- Step 2: Identify supply zones, where the price previously fell sharply after consolidation.
- Trading Signal: A sell signal is generated when the supply zone and the downtrend trendline converge at a single point.
- Analysis: High probability of price rejection at this confluence point, making it an ideal spot for a sell trade.
Demand Zone with Support Trendline
Now, let’s talk about the confluence of a demand zone with a support trendline to find the buy trade opportunities on the price chart.
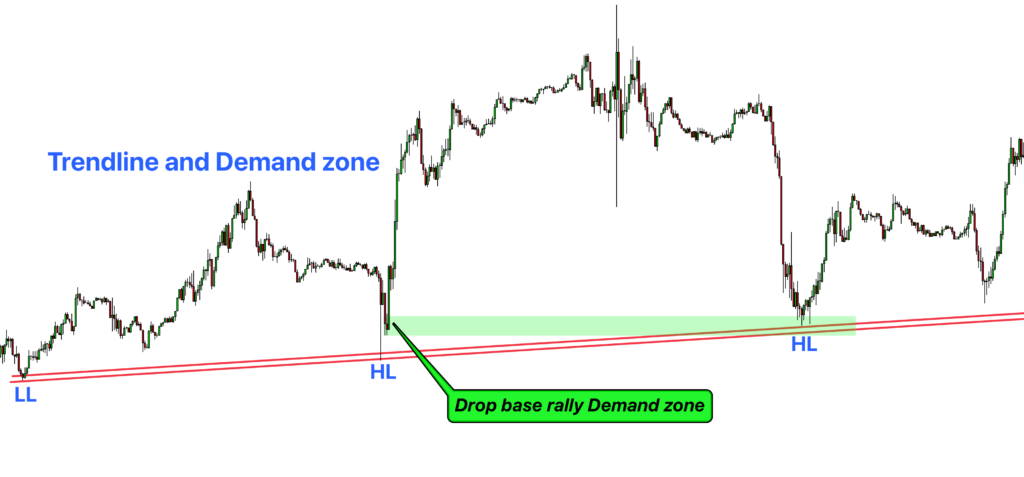
Here is the step by step guide:
- Step 1: Draw a support trendline in an uptrend by connecting higher price lows.
- Step 2: Locate demand zones, marked by areas where the price rallied after consolidating.
- Trading Signal: A buy signal is present when the demand zone intersects with the support trendline.
- Analysis: This intersection is likely a point where the price will bounce upwards, presenting a good opportunity for a buy trade.
Supply and Demand Trendline Trading Strategy
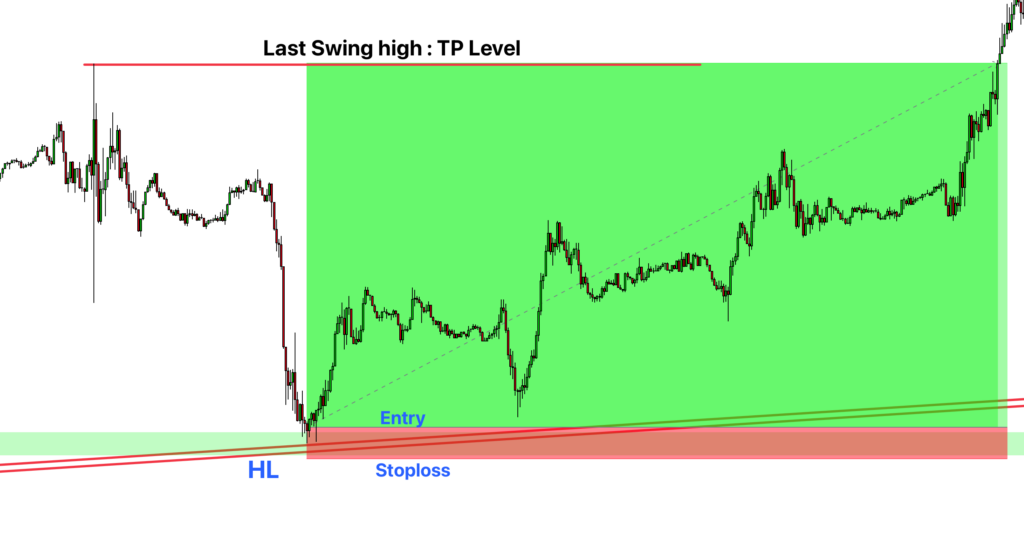
For Opening a Buy Trade:
First, identify a demand zone that is in alignment with a support trendline in an uptrend. The key is to look for areas where these two factors meet or are very close to each other. Once you’ve identified this confluence:
- Place a Pending Buy Order: Set this order at the high of the demand zone. This is where you anticipate the price will bounce back up.
- Set a Stop-Loss: This should be just below the low of the demand zone or below the support trendline. Choose the one that gives you a better safeguard against potential losses.
- Closing the Trade: Aim to exit your trade at a recent swing high. This point is your target, assuming the price will rise to this level.
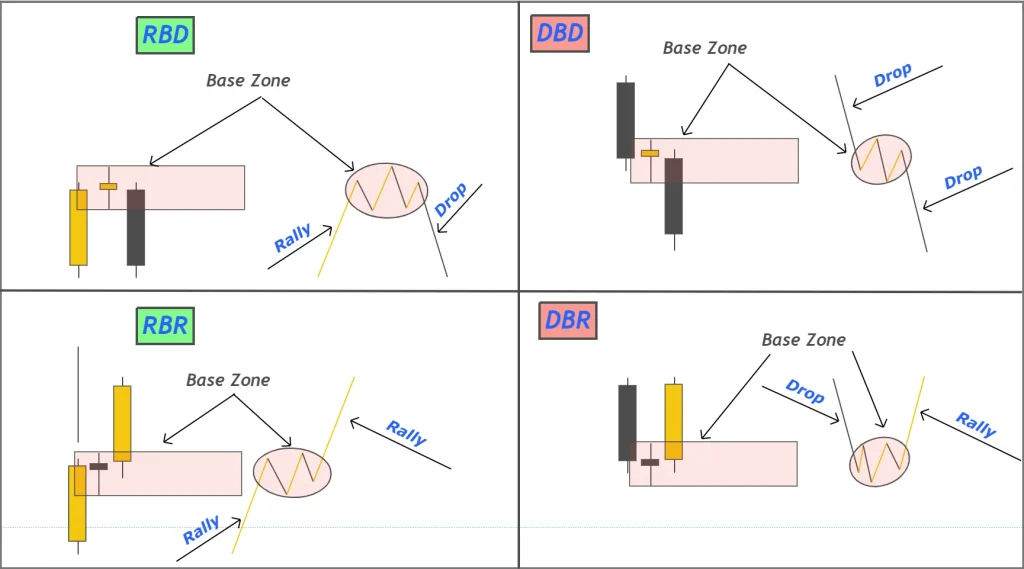
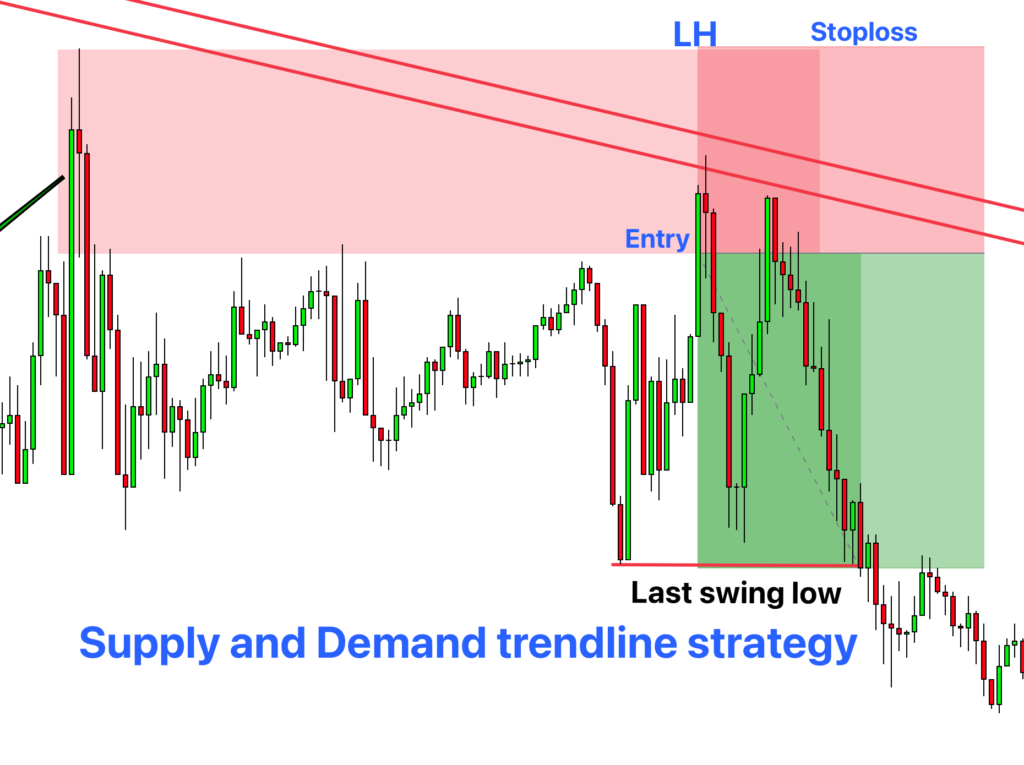
For Opening a Sell Trade:
Similarly, for a sell trade, you would look for a supply zone that coincides with a resistance trendline in a downtrend. When these two align:
- Place a Pending Sell Order: Do this at the low of the supply zone. You’re expecting the price to drop from this point.
- Set a Stop-Loss: Position it just above the high of the supply zone or above the resistance trendline. Again, opt for the option that better minimizes your risk.
- Closing the Trade: The ideal exit point would be at a recent swing low. This is where you forecast the price will descend to.
Using this strategy, you effectively combine the predictive power of supply and demand zones with trendlines, thereby enhancing the likelihood of successful trades.
Aiming for Consistent Gains: The 8% Monthly Goal
As traders, our goal isn’t just to win trades, but to grow our investments consistently. A good target to aim for could be making an 8% return on your investment each month using the Supply and Demand Trendline Trading Strategy. While this might sound modest at first, it can lead to significant growth over time, thanks to the power of compounding.
Why 8% with supply and demand trendline strategy?
8% is a realistic and achievable target for many traders. It’s ambitious enough to aim for significant growth, yet conservative enough to be attainable with a well-planned strategy and disciplined risk management.
The Power of Compounding
When you make 8% in a month and reinvest your gains, you start the next month with a slightly larger account. This compounding effect can turn your initial investment into a much larger sum over time.
The Plan
- Risk Management: It’s crucial to manage your risk carefully. A common rule is to risk no more than 1-2% of your total capital on a single trade. This way, you protect your account from significant losses.
- Consistency is Key: Stick to your strategy and don’t chase unrealistic gains. The aim is steady growth, not overnight success.
The Account Growth Table
Let’s break this down with an example. Imagine you start with $10,000. Here’s how your account can grow over a year with an 8% monthly gain:
| Month | Starting Balance | Monthly Gain | Ending Balance |
|---|---|---|---|
| 1 | $10,000 | $800 | $10,800 |
| 2 | $10,800 | $864 | $11,664 |
| 3 | $11,664 | $933.12 | $12,597.12 |
| 4 | $12,597.12 | $1,007.77 | $13,604.89 |
| 5 | $13,604.89 | $1,088.39 | $14,693.28 |
| 6 | $14,693.28 | $1,175.46 | $15,868.74 |
| 7 | $15,868.74 | $1,269.50 | $17,138.24 |
| 8 | $17,138.24 | $1,371.06 | $18,509.30 |
| 9 | $18,509.30 | $1,480.74 | $19,990.04 |
| 10 | $19,990.04 | $1,599.20 | $21,589.24 |
| 11 | $21,589.24 | $1,727.14 | $23,316.38 |
| 12 | $23,316.38 | $1,865.31 | $25,181.69 |
By the end of the year, that $10,000 could potentially grow to $25,181.69. This example clearly shows the impact of consistent monthly gains and the power of compounding.
Avoid These Common Mistakes
When using the Supply and Demand Trendline Strategy, watch out for these easy-to-make mistakes:
- Trade with the Trend:
- Always trade in the same direction as the trend. Don’t use a trendline if it’s broken. Trading on a trendline that’s broken is a different strategy and not what we’re focusing on here.
- Account for Spread:
- Sometimes, the spread (the difference between the buy and sell price) can cause you to miss trades. Add an extra 2 to 3 pips to your zone to make sure your trades don’t miss out because of the spread.
- Correct Lot Size:
- It’s really important to calculate how much you’re trading (your lot size) for each trade. Risk only 1 to 2% of your money on each trade. Avoid trading with the same lot size all the time; this can mess up your risk management.
- Matching Trendlines and Zones:
- If your trendline is for an uptrend, only look at demand zones for trading. If it’s for a downtrend, only use supply zones. It’s important to match the trendline with the right type of zone.
By avoiding these mistakes, you can stick to your strategy better and keep your trading on track.
Conclusion
To wrap up, the Supply and Demand Trendline Strategy offers a solid approach for those looking to improve their trading. By combining the insights of supply and demand zones with the guidance of trendlines, this strategy can help you pinpoint high-probability trade setups.
The key is to always trade in the direction of the trend and to use these tools to find the best spots to enter and exit trades. Managing your risk wisely, particularly by adjusting your lot sizes and accounting for spreads, is crucial for long-term success.
Also, don’t forget to avoid common traps like ignoring the trend or misreading the zones. Sticking to these guidelines can increase your chances of consistent gains.