
Definition
A random walk index indicator is a tool that examines the change in the price of an asset to random changes in the prices to determine the consistent trend or random movement of the prices.
This indicator tries to find a significant statistical trend in market prices.
Purpose of Using RWI indicator
This indicator’s main objective is to discover two assumptions about the market.
- The prices are following a significant trend (bearish/bullish).
- The prices are moving randomly without forming a significant trend.
In a trading session, you can observe a continuous change in the prices of an asset. The forex markets are usually more volatile as compared to stocks. The price in a forex market can rigorously change. The price change can either be random or in a set sequence. If the change behaves sequentially, it is a “price trend.” The main objective of the Random Walk Index indicator is to determine whether the price change is following a random pattern or a definite trend.
Significance of Random Walk Index indicator
This indicator has a strong history and applications in mathematical and statistical affairs. The significance of the RWI indicator involves the following points.
- This indicator determines a market trend.
- It gives information about the bullish and bearish market behaviors.
- It indicates a trader about the random behavior of the prices.
- It helps in decision-making for a trader.
- It helps in forming a good entry and exit trading strategy.
Formula
RWI is based on complex mathematical calculations and formulas. This indicator gives us information about two types of trends: the bullish trend and the bearish trend. So, there are two different mathematical formulas for calculating each trend.
For bullish trend
The line which represents the bullish trend is RWI high, and its formula is as below.
RWI high = High – Low /ATR x
For bearish trend
The line which represents the bearish trend is RWI low, and its formula is as below.
RWI Low = High – Low /ATR x
n= number of days in a period
ATR = average true range
Working of Random Walk Index indicator
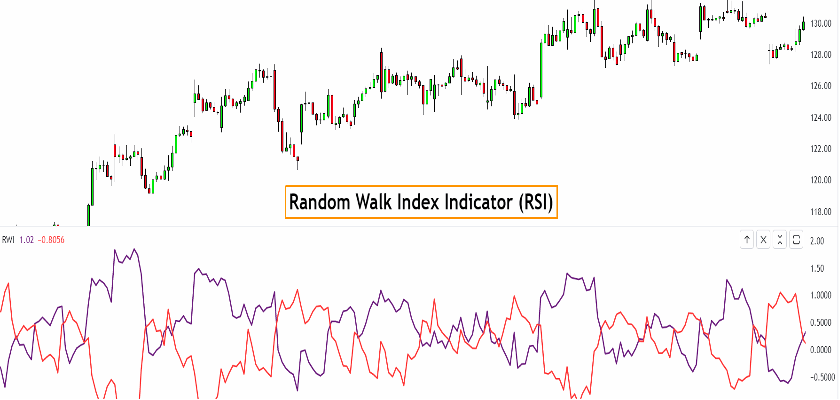
The working of random walk index depends on two readings. These readings are
- RWI high
- RWI low
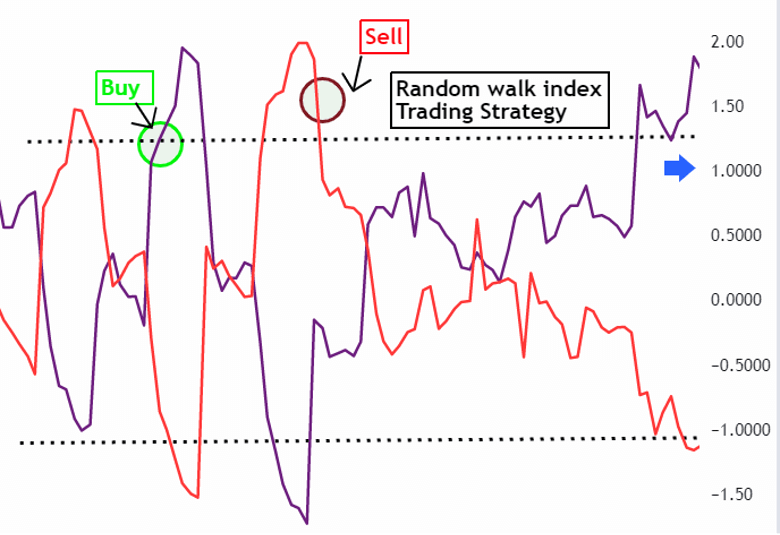
If the reading is below 1.0, the RWI suggests that prices are not following a significant trend. They are moving randomly.
The reading above 1.0 indicates a strong trend. If the RWI high is above 1.0, it means it is a strong Bullish and prices of an asset are following an uptrend.
As the RWI low moves above 1.0, the market faces a strong bearish trend.
The strong bullish and bearish trend indicates the appropriate entry and exit points for a trade.
An RWI high above 1.0 indicates a strong buy signal. On the other hand, an RWI higher than 1.0 signals a strong sell signal.
Best settings for RWI
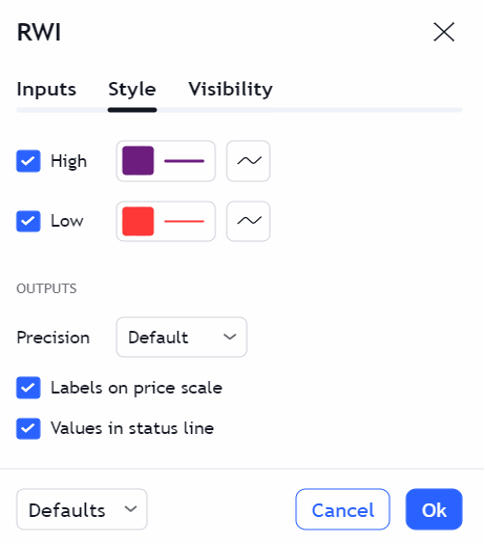
RWI provides the luxury of the default setting to a trader. It means a trader can customize the color scheme of the RWI high and low lines according to his preferences.
It is an easy-to-eye indicator that allows you to improve its settings according to your choice.
You can also change the number of periods in the input setting.
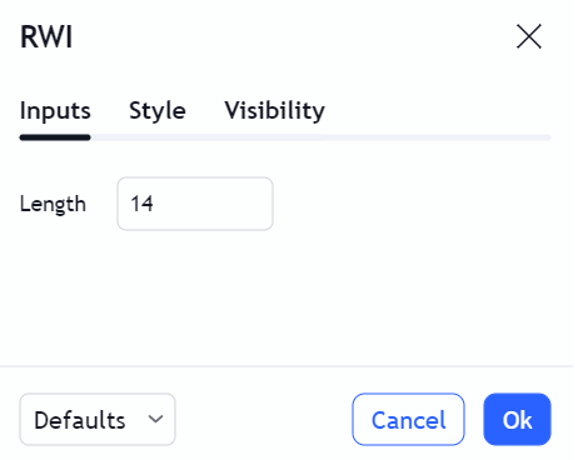
For short trade
I recommend you to keep the number of periods range from 2 to 7. Moreover, you can change these settings according to your trading experience.
For long trade
I suggest you keep the number of periods from 8 to 64 for a long trade. The default setting of RWI is usually at 14 periods for an input. The personal experience of the trader with trial and error can help in modifying the settings.
The trading strategy around RWI
We can divide the trading strategy around RWI into three steps.
Entry
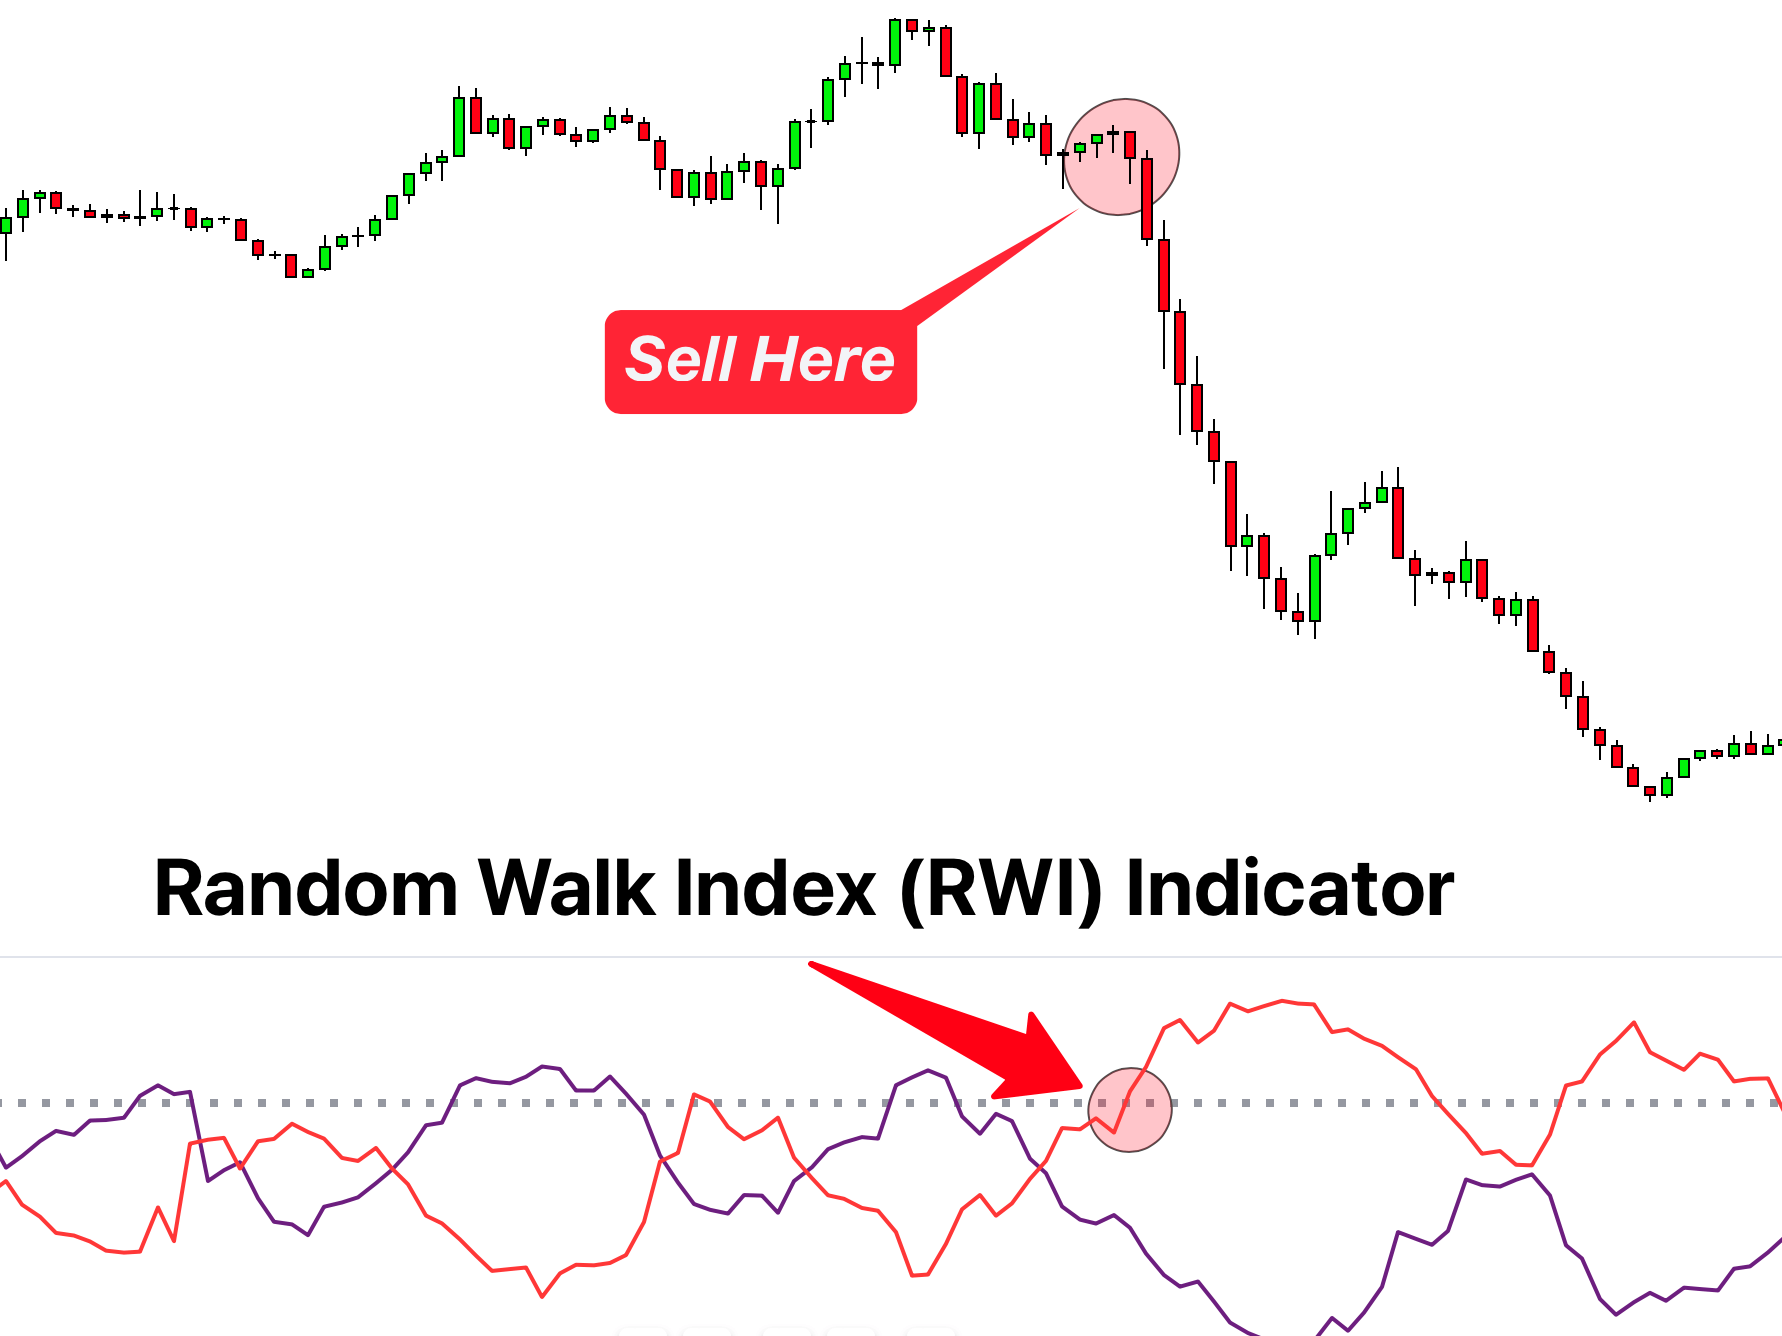
The reading of RWI suggests entry and exit from a trade. If the RWI is higher than 1.0, it is a strong buy signal. On the other hand, if the RWI low is higher than 1.0, it is a strong sell signal.
As the RWI high line rises above 1.0, it is a good entry point in a trade. The value of RWI low rising above 1.0 indicates a good exit position from the trade.
Risk Management
The best practice is to use this indicator with the confluence of the support/resistance zone for a maximum success rate.
To stay safe, place your stop loss below the previous low point in case the prices take a reversal. On the other hand, for a bearish trend, place your stop loss above the previous high point.
Take profit
In a short trade; you can take profit as the trend take reversal. For the long trade, wait for the strong up and downtrend as the reading moves higher.
Success ratio
This indicator is a high success ratio indicator. If you use it with other technical tools with proper optimization of entry and exit points, it can surprise you with results.
Pros
RWI offers the following advantages.
- It can indicate a bullish and bearish sentiment in the market.
- It gives you information about random price movements.
- It can help you to formulate a trading strategy.
- RWI is equally helpful in short and long trades.
- It can work with all currency pairs.
Cons
There are the following drawbacks of the RWI indicator.
- It is a lagging indicator.
- It can lead you to some miss-opportunities in a trading session.
- It can perform sudden trend reversals, which result in poor entry.
Conclusion
The Random Walk Index indicator helps a trader in finding the trend of the market. It can distinguish between the random movement of the prices and the significant trend. A trader can formulate a good trading strategy around RWI. The success rate of this indicator is higher if a trader uses the confluence of other technical trading tools with RWI.