
What is Rally base drop in trading?
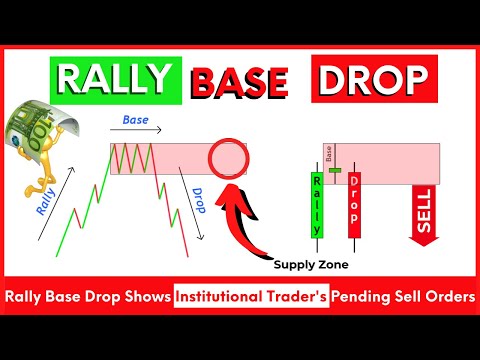
Rally Base Drop is a price pattern that indicates the formation of a supply zone in forex trading. Big institutions and big traders place their pending sell orders at the supply zone to go short in trading.
It is a type of supply and demand; retail traders use it to find out hidden sell orders of market makers. Supply and demand trading methods are the origin of technical analysis in trading.
How to identify rally base drop?
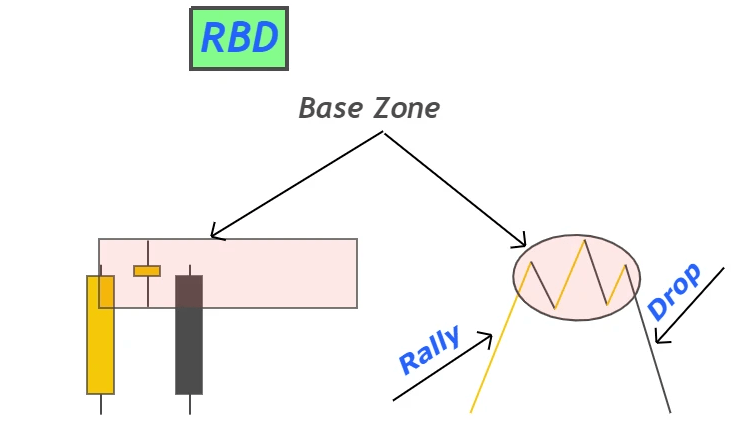
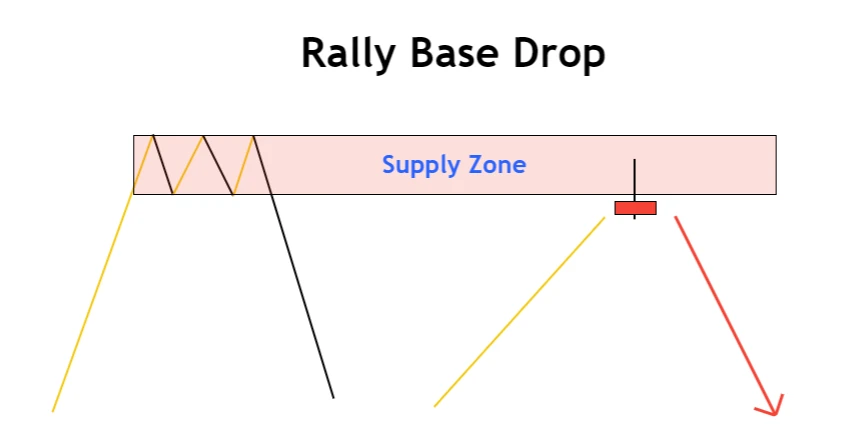
This price pattern means a bullish impulsive wave will form on the chart. After a bullish impulsive wave, the price will move sideways like a retracement wave. Then it will form a bearish impulsive wave. Like in the image below.
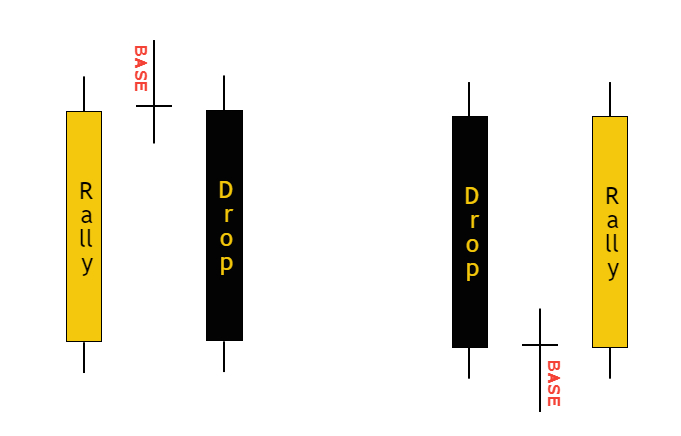
If you look deeper like a professional trader, you will see a big bullish candlestick, a base candlestick, and a big bearish candlestick. A candlestick with a big body and a little wick represents a huge price momentum. On a lower timeframe, it indicates a complete wave. That’s why we have replaced a wave with a candlestick to make it easy for you.
Follow the following simple formula to identify the rally base drop pattern on a candlestick chart.
RBD = big bullish candlestick + Base candlestick + Big bearish candlestick
Body to wick ratio of candlesticks
After proper backtesting, the results have shown that the body to wick ratio of big candlestick must be greater than 70%. For the base candlestick, it must be less than 25%.
If a candlestick is not meeting the above criteria, then you should avoid that RBD pattern.
How to draw supply zone in RBD pattern?
The base zone is always drawn on the high and low of the base candlestick. Base candlesticks can be more than 1. If there is more than one candlestick in the base, then you should choose the highest high and lowest low of the base.
Draw a rectangle on the highest high and lowest low of the base zone and extend the rectangle to right. It will become a base zone. A base zone is also called a supply zone.
Psychology behind RBD pattern
Rally base drop patterns mostly appear in the form of fake-out at key levels. These fake-outs create areas that become more attractive for sellers. You can identify those areas in the form of a rally base drop.
In real life, market makers do stop loss hunting in the form of fake-outs but in technical analysis, it becomes a rally base drop pattern because of natural phenomena.
Most chart patterns are made from natural phenomena in technical analysis and RBD is one of the chart patterns related to supply and demand
How to trade RBD pattern?
To trade RBD patterns, there are two methods discussed in rally base rally and drop base drop patterns.
In the first method, the price will give a pullback just after rally base drop formation. It is the most effective and high probability setup.
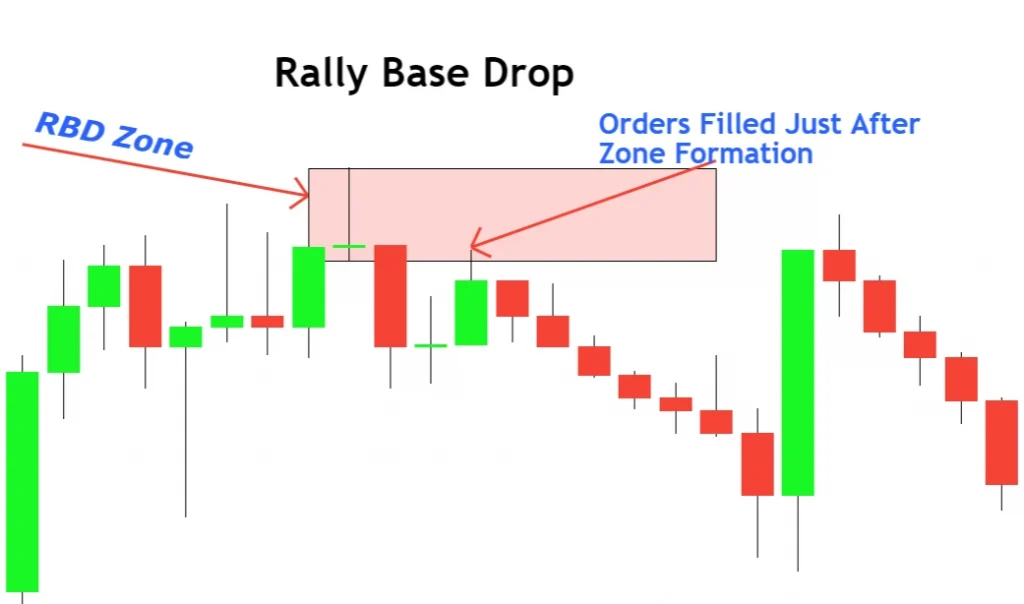
The second method is to trade the RBD supply zone after a full swing. In the method, the price will take time to pull back towards the supply zone to pick pending sell orders. It is common sense that with time a zone will continue to lose its worth. A newly created zone has more potential than a zone created 10 days ago. That’s why it is recommended to add a candlestick confluence in the second method.
Place pending sell order a few pips below the supply zone. In the second method, wait for the formation of a bearish candlestick pattern at the supply zone otherwise skip that zone.
Adjust stop loss a few pips above the supply or base zone in the RBD pattern.
The supply zone in the rally base drop pattern does not tell us about placing a take profit level. That’s why you should trade the RBD pattern as a confluence with other chart patterns. Place a small stop loss and enjoy a high-risk reward setup.
The Bottom Line
I recommend you learn supply and demand if you want to master technical analysis. Always try to learn the logic behind the occurrence of every chart pattern. This price reading technique will make you a good technical analyst.