
The Vortex indicator identifies the trend continuation and the trend reversal signals in the trending market only.
Developed by Etienne Botes and Douglas Siepman, the indicator was introduced in “Technical Analysis of Stocks & Commodities (2009). The developers combined the works of Welles Wilder and Viktor Schauberger for their calculations.
Vortex comprises two lines; positive and negative. They are +VI and –VI. Whenever the crossover of these two lines occurs, the indicator presents a trading signal.
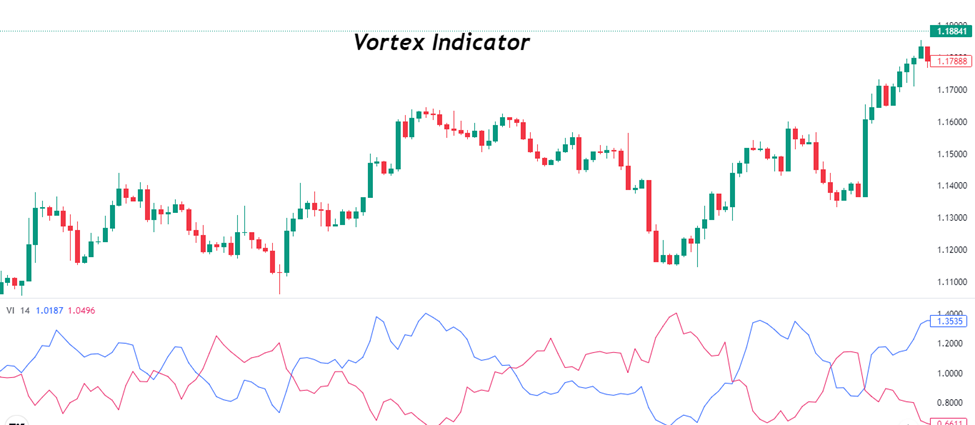
What is the Vortex Indicator?
The formula for the Vortex Indicator is
- SUM VM+/SUM TRn = V+
- SUM VM-/SUM TRn = V−
Where;
+VM = Current High – previous low
-VM = Current low – previous high
+VM14 = 14-period Sum of +VM
-VM14 = 14-period Sum of -VM
True Range (TR) is the greatest of:
- Current high – current low
- Current high – previous low
- Current high – previous close
Calculations
To calculate the Vortex Indicator, you need to follow certain steps.
First, you need to calculate the positive and negative price movement based on the previous period’s highs and lows. The further the current high is from the previous low; the trend will be more positive. Conversely, the more distant current low is from the previous high, the trend will be negative.
Vortex uses Welles’s True Range in its calculation. It measures volatility and the default period is 14.
After getting the positive and negative movements, you then divide them by the True Range to get the equation.
Best settings for the vortex indicator
The best settings for the indicator are
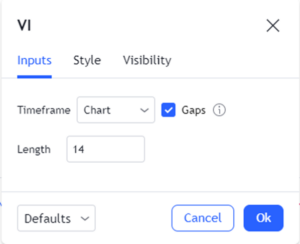
The length, by default, is set at 14. It suggests the length of the True Range. You can also set the higher period. A higher will produce fewer false signals.
Speaking of false signals, you should set the VI on higher timeframes, as it can be prone to false signals on lower timeframes.
How to trade with the Vortex Indicator?
To trade with the VI, you need to locate the crossovers. The indicator produces signals whenever the crossover between the +VI and –VI happens.
When the +VI crosses above the –VI, it suggests an uptrend move. Here, you can enter long positions or exit short ones.
On the flip side, if the –VI crosses above the +VI, it signifies a downtrend, and you can enter short or exit long positions.
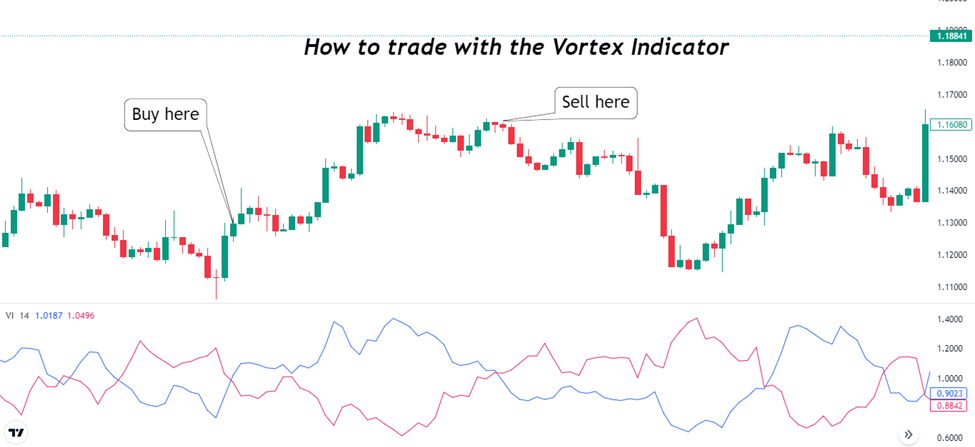
As mentioned earlier, you can also use the indicator for finding reversals. For this, you have to look at a move below or above 1.
Before a new trend begins, -VI often weakens and falls below.90. After the negative trend weakens, the rising trend accelerates as +VI goes over 1.10 to achieve the bullish signal.
Conversely, when +VI falls below 0.90, it mentions the beginning of the new trend. Here, the –VI accelerates and goes below 1.10 to find the bearish trend.
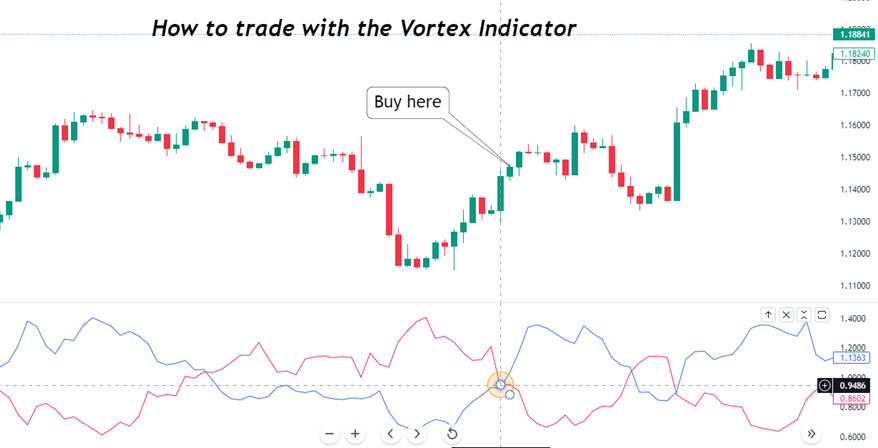
On the GBP/USD 4H chart above, the price was in a downtrend earlier. When the -VI dipped below the 0.90 level, the blue +VI went above, producing a trend reversal. Here, you waited for the +VI to go above 1.10 and then took the buy position.
Advantages
- The indicator is relatively easy to understand.
- You can use the indicator on its own as it presents exact entry and exit points.
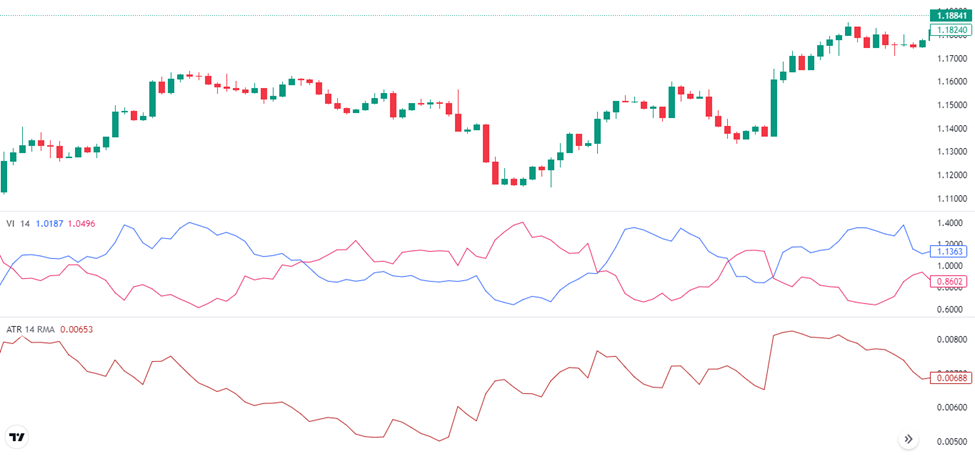
Vortex Indicator vs. Average True Range
Although the Average True Range was developed by Welles Wilder and Vortex uses the true range for its calculation, both indicators are different.
Firstly, Vortex has two lines (positive and negative), while the Average True Range has only a single line.
Secondly, the Average True Range doesn’t provide the direction of the trend; rather, it provides volatility only. VI provides a clear trend direction.
Also, the VI calculation is a bit more complex than the Average True Range.
Summary
The Vortex indicator combines the two oscillators to present trend continuation and reversal. The crossovers of the +VI and –VI signals a trend continuation, while the movement below/above 0.90 signals a change in trend.
Although the indicator works fine on its own, you can use the Vortex along with others for further signal confirmation.
The Vortex is not available on the Metatrader 4/5. So, you have to use it on Tradingview or another platform.