
Definition
Cumulative delta divergence is the deviation between the cumulative volume delta chart and the candlestick chart of the same financial asset.
The cumulative volume delta shows divergence, and traders use this signal to forecast significant trend reversals in the market. CVD also denotes it in trading.
In this article, I will explain the cumulative delta divergence, but before this, I will also give an overview of the origin of volume delta and cumulative volume delta. Then it will be easy for you to understand the cumulative delta divergence.
What is the volume delta in trading?
Volume delta is the difference between the buying volume and selling volume of a particular financial asset within a specific time interval. Volume delta is derived from order flow trading in which traders track the activity of buyers and sellers in the market.
Volume Delta = Buying volume – Selling volume
Here
- Buying volume refers to the total number of buy orders institutional traders place in specific intervals.
- Selling volume refers to the total number of sell orders placed by market makers in a specific timeframe.
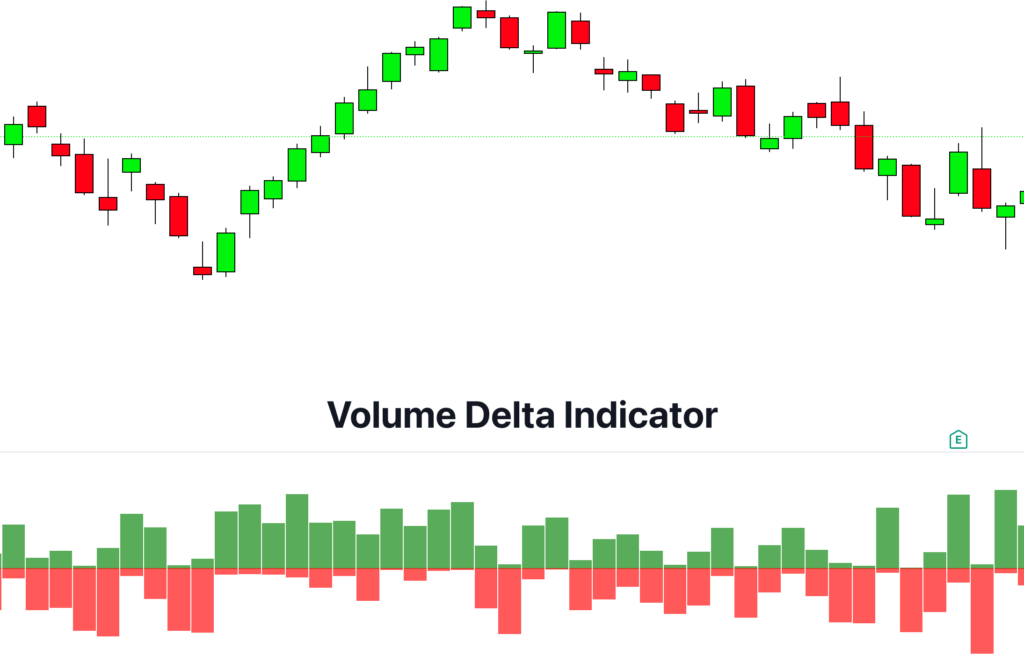
How does the volume delta display on the chart?
The volume delta indicator uses the buy or sell volume to show the trader’s activity on the chart in red and green bars. This indicator acts as an oscillator that oscillates around the zero line.
If the bar is above zero, buying pressure is more than selling. And there are many buy orders in the market. Buyers want to offer a high price. Its color will be green.
While if the bar is below the zero line, it means the selling pressure is more than the buying pressure. There are several sell orders in the market compared to buy orders. Its color will be red.
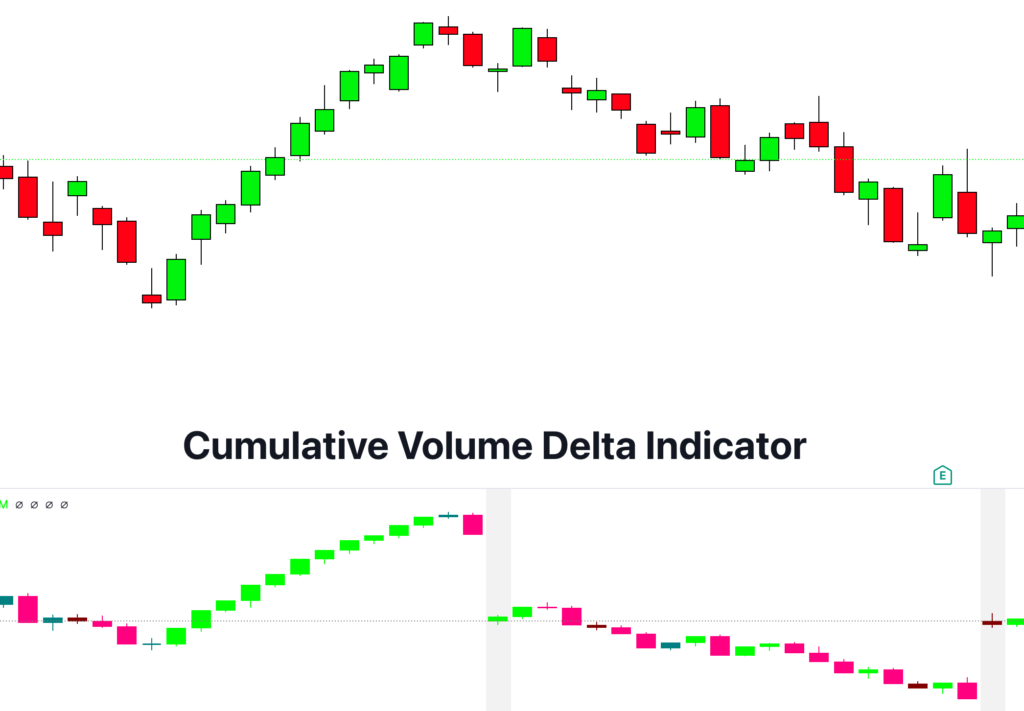
What is cumulative volume delta?
It is the overall representation of the volume delta on the chart. In the simple volume delta, you’ll see every bar’s results. But the cumulative volume delta also takes the data of previous bars to make an overall average volume delta. It is called cumulative volume delta.
It is better than the simple volume delta because you can check the overall result of each price wave of the candlestick chart.
However, it also depends on the trader’s requirements. But we will use the cumulative volume delta indicator to check the divergence.
How to use the cumulative volume delta indicator?
Unlike the volume delta, the cumulative volume delta is applied to the price waves for technical analysis. We use swing highs and swing lows to determine the strength of buyers and sellers.
Kindly learn in detail about the swing high and low from this article.
The cumulative volume delta indicator should align with the price action waves. If they don’t align, then it means there’s an imbalance hidden behind the candlestick chart.
For example, if the price is higher, the CVD should also make higher highs. While if the price is making lower lows, then the CVD indicator should also make lower lows.
If there’s a divergence between the price and indicator, the asset’s value is imbalanced.
Let me explain the cumulative delta divergence to get buy or sell signals.
What is Cumulative Delta Divergence?
It is the divergence of both CVD indicators and price. For example, if the price is making higher highs, then the indicator can diverge to a higher low. This will act as divergence.
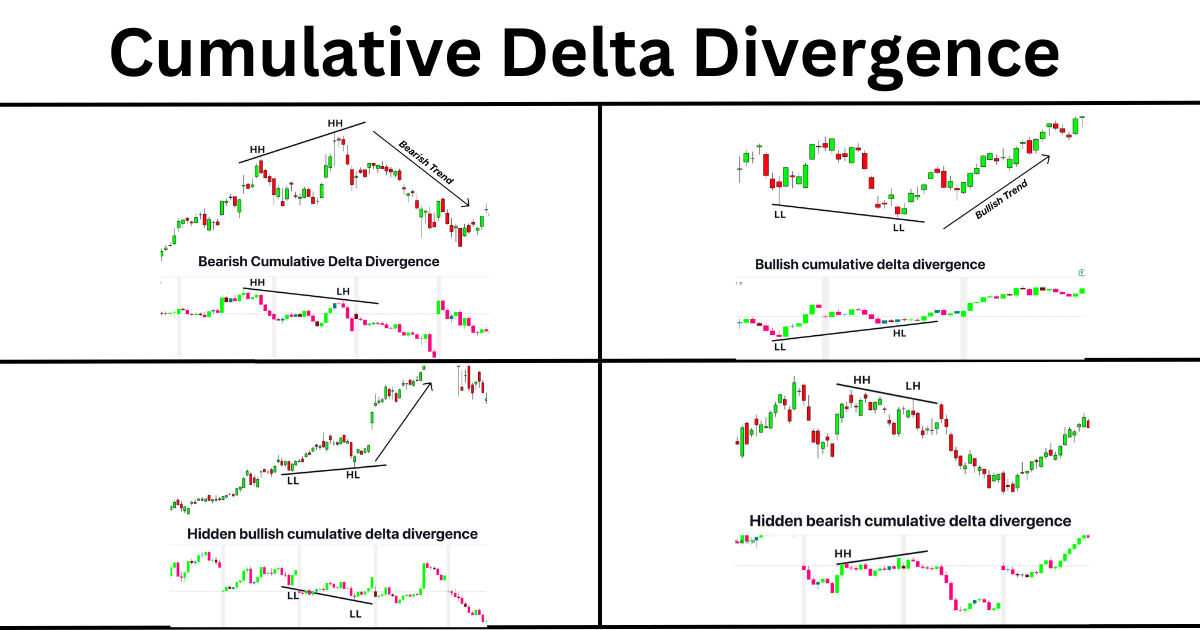
There are four types of cumulative delta divergence.
- Bullish divergence
- Bearish divergence
- Hidden bullish divergence
- Hidden bearish divergence
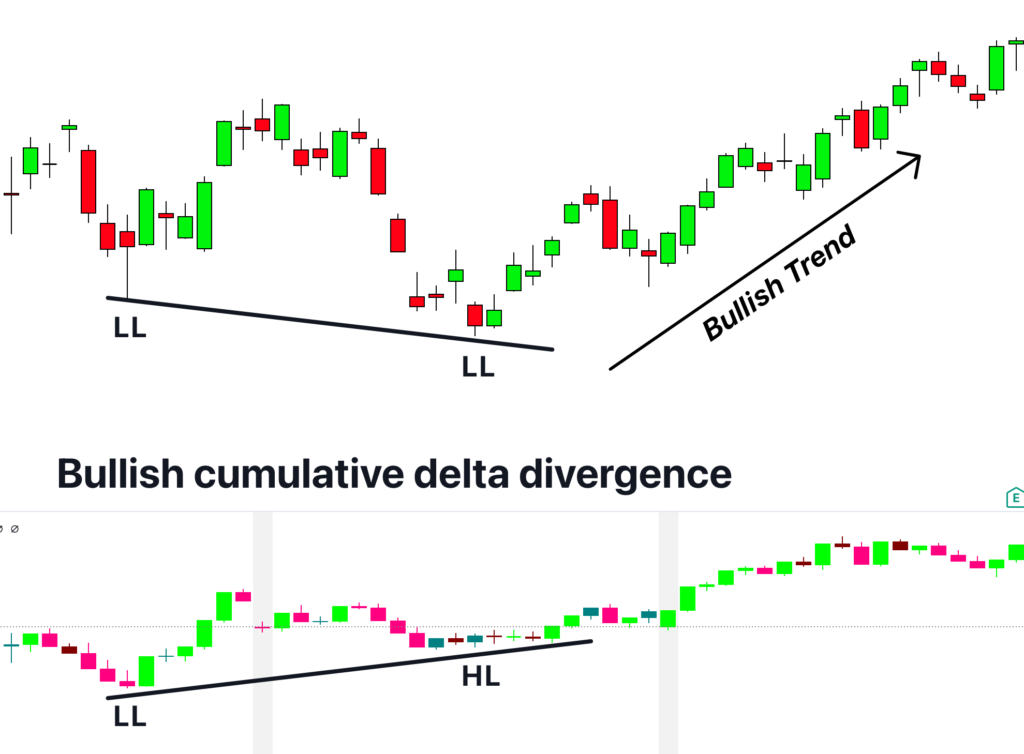
Bullish cumulative delta divergence
In this type of divergence, the price will make a lower low but the CVD indicator will show a higher low. It means that the price is diverging from the indicator. It is a bullish signal, and the price will make a bullish trend.
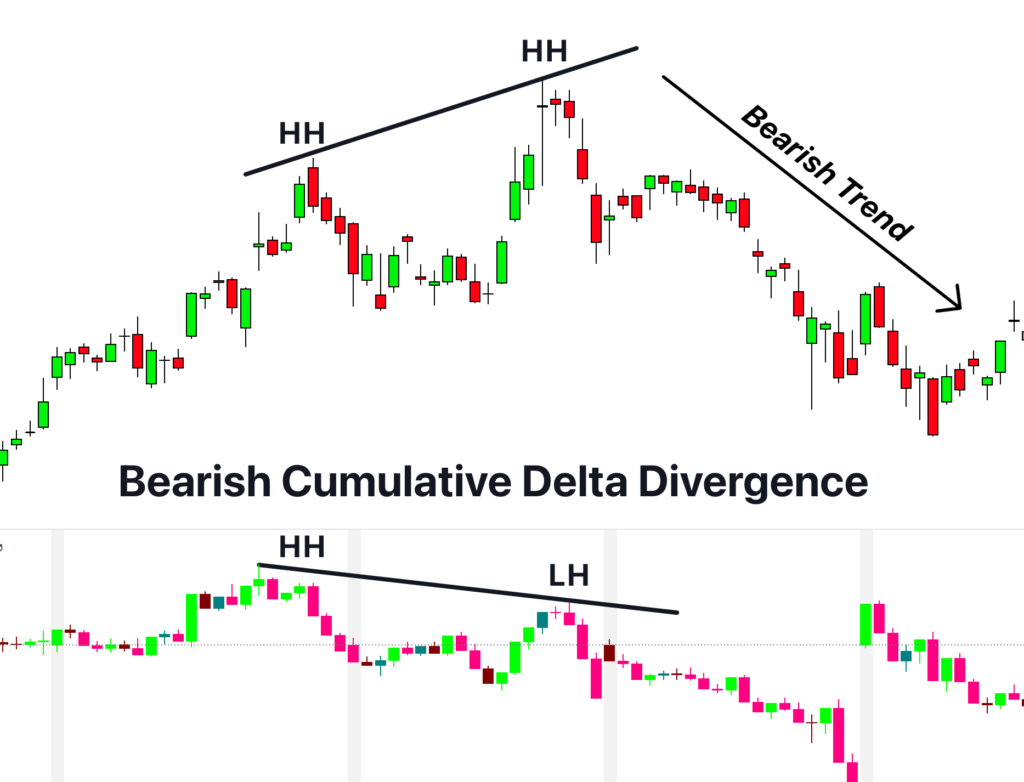
Bearish cumulative delta divergence
The price will be higher in this type of divergence, but the CVD indicator will make a lower high, indicating a bearish trend reversal. It is a bearish signal, and we will open a sell trade on this confirmation.
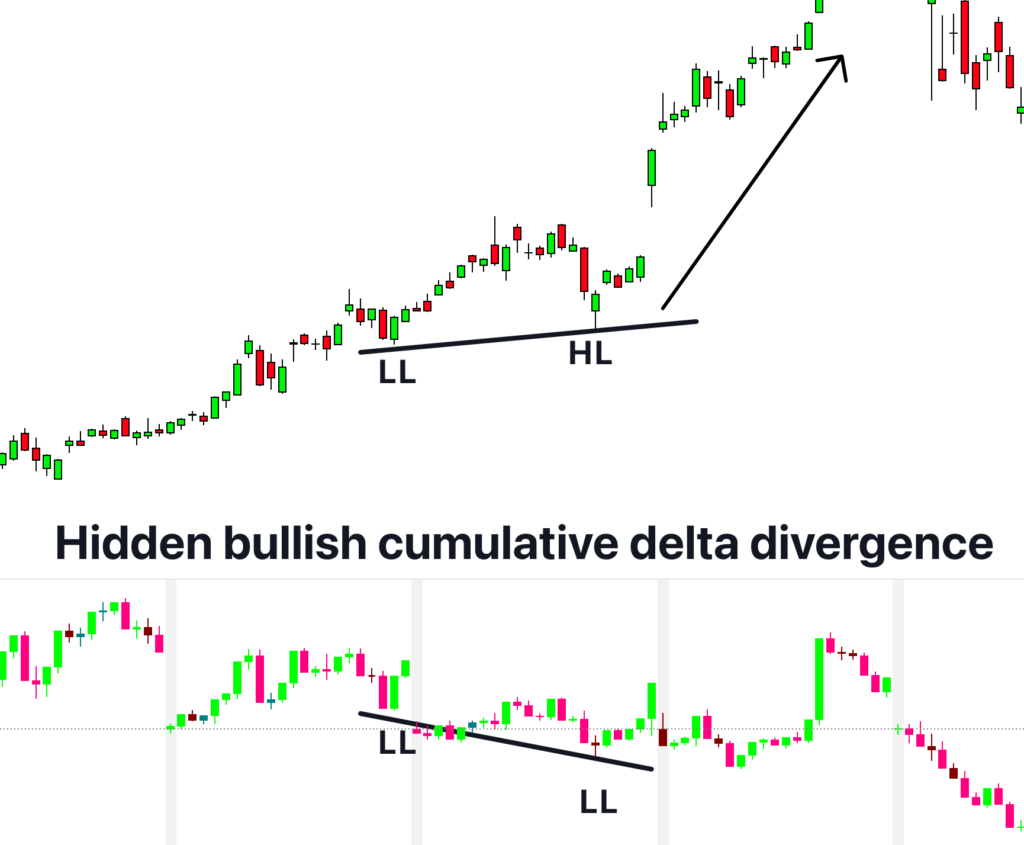
Hidden bullish cumulative delta divergence
This is opposite to the previous type of divergence, but it also gives a bullish signal.
The price will make a higher low in this type, but the CVD indicator will make a lower low indicating a bullish trend.
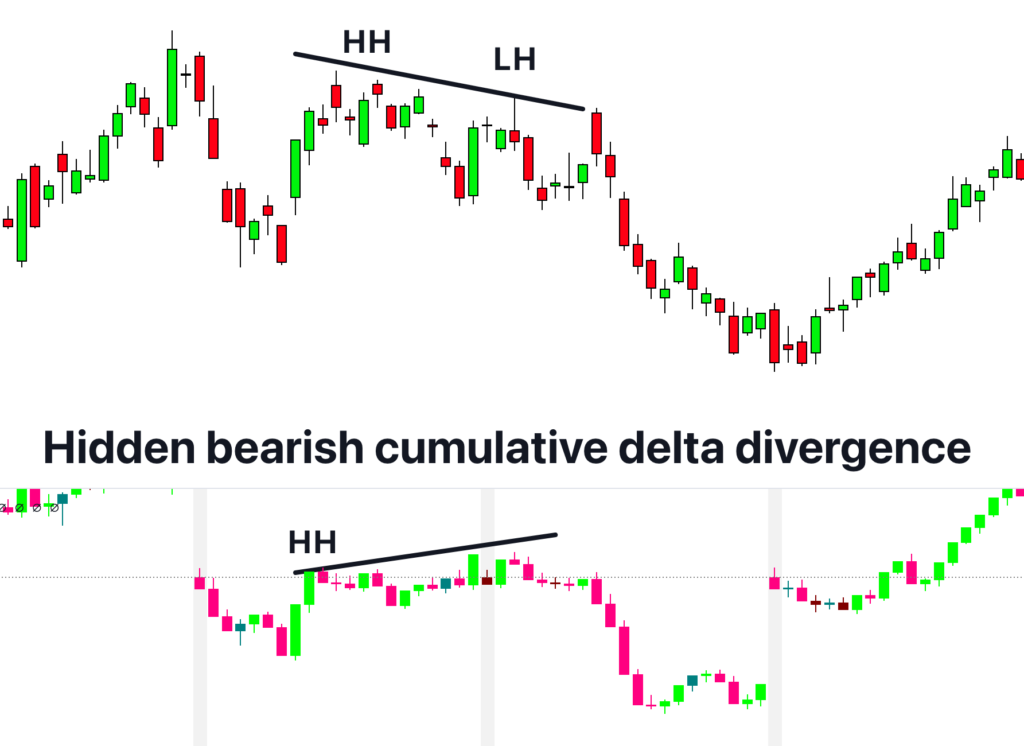
Hidden bearish cumulative delta divergence
In this type of divergence, the price will make a lower high, but the indicator will make a higher high. This forecasts a bearish trend in the market.
How to trade with the cumulative volume delta indicator using divergences?
The divergence trading strategy is highly effective with the CVD indicator. However, it works in stocks and other related financial assets. It will not work in forex or indices because forex is a decentralized system and does not provide accurate data on the volume.
In the divergence trading strategy, I recommend using the candlestick patterns as a confluence with the divergence. Because cumulative delta divergence also shows the trend reversal signal, candlestick patterns also forecast trend reversal.
The forecast of both technical tools is the same, so if we combine both, the probability of winning will increase.
For example, to open a buy order, you should always confirm the bullish divergence signal with the help of bullish candlestick patterns. In the same way, for sell signals, you should confirm with the help of bearish candlestick patterns.
Conclusion
Cumulative delta divergence is an excellent trading method, and we can increase the winning probability of this method by adding a confluence of candlestick patterns.
I highly recommend the cumulative delta indicator if you’re a stock trader.