
Definition
Schaff trend cycle indicator is a technical analysis tool designed to recognize the market trends and their reversals with the help of the trend’s strength and volatility of the price fluctuations.
A Schaff trend indicator uses the principle of moving averages and cycle analysis. This indicator helps in a very smooth way to identify a trend or a trend change.
This indicator measures the velocity of the price change, so it is an oscillator.
Purpose of using STC indicator
The main objectives of using this indicator are,
- To identify a trend.
- To indicate a trend reversal.
The above-mentioned objectives can help a trader set up a good trading strategy around the STC indicator.
Significance
STC is a very versatile indicator that can impact your trading experience in a very positive way. The significance of this indicator is as follows.
- It can identify the nature of a trend.
- It gives information about the trend reversals.
- It can aid in forming a good trading strategy.
- A trader can find decent entry and exit points with the help of an STC indicator.
- This indicator provides sufficient information about overbought and oversold situations.
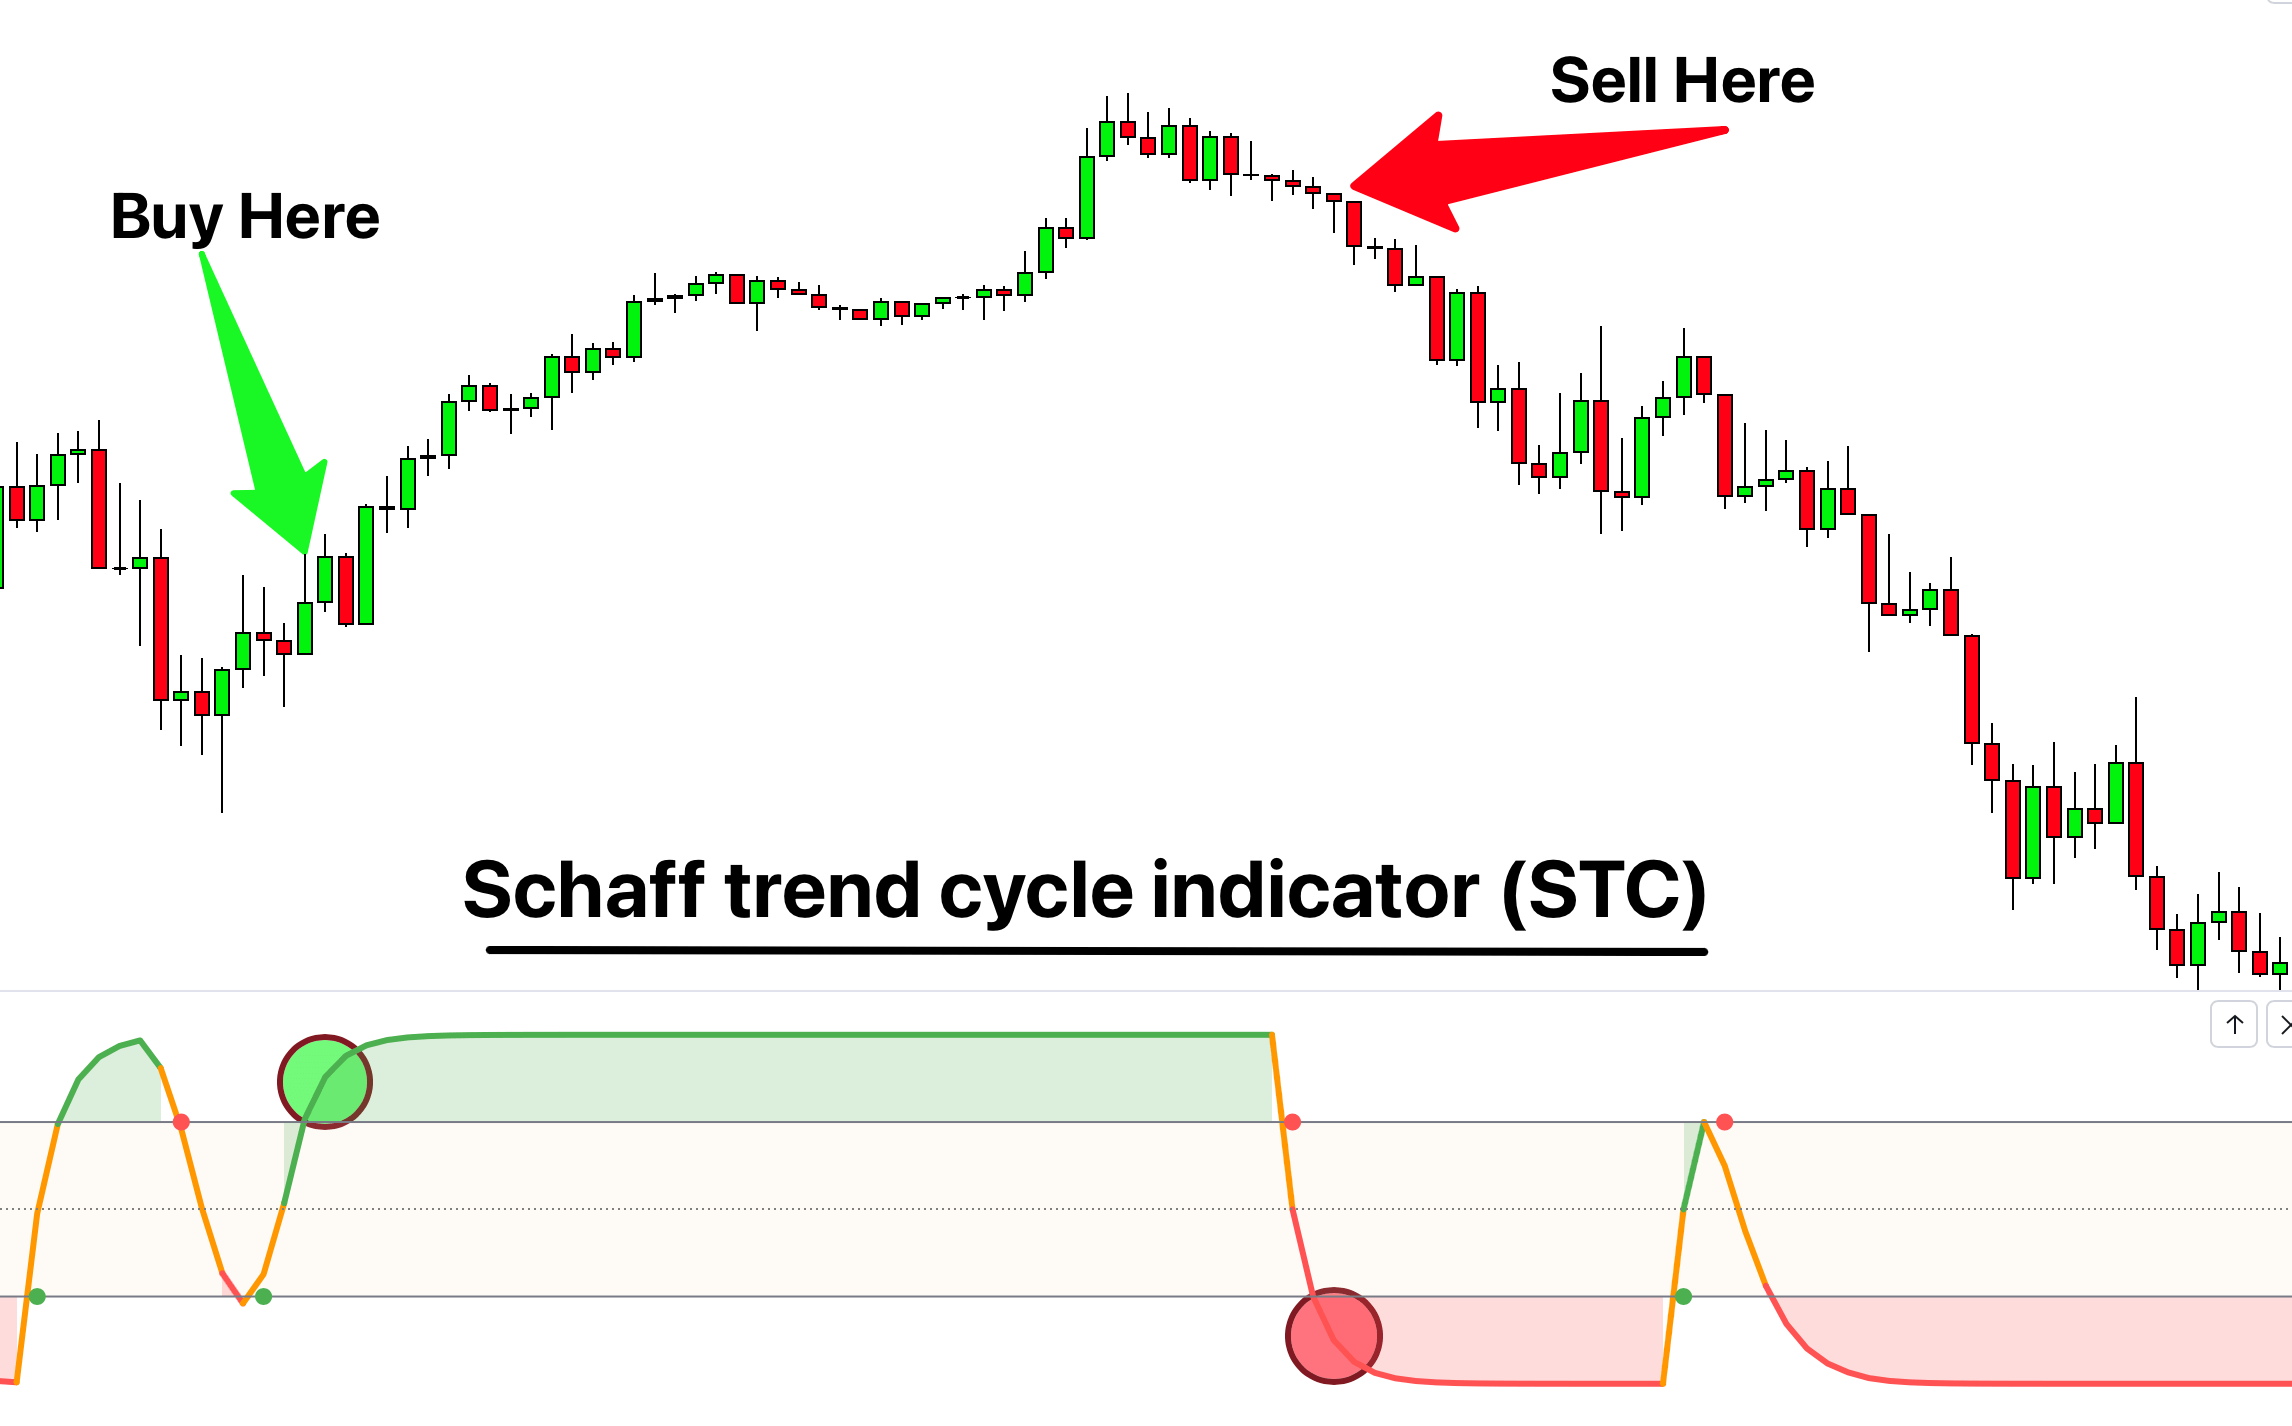
- It can generate buy/sell signals.
Working of schaff trend cycle indicator
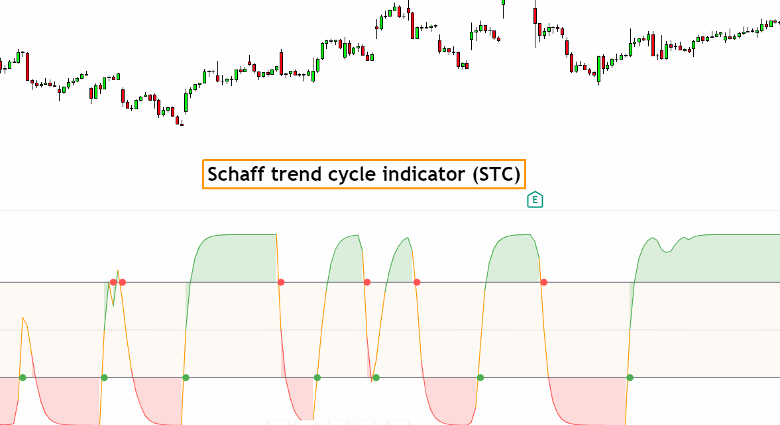
STC combines the moving averages with the cycle analysis for the complex calculation. These calculations are represented in the form of an oscillator and moving average lines.
STC as moving averages
In the case of moving average line. The indicator uses the phenomenon of moving averages convergence and divergence. In which there are two lines. One is a fast-moving line, and the other is a slow-moving line. These lines move between the 0 to 100 value to represent a trading market.
The cross-overs of these lines indicate various buy and sell signals.
STC as an oscillator
In the case of STC as an oscillator. This indicator ranges between 0 to 100 value. As this value rises above 50, it represents a bullish trend in the market. The fall of the value below 50 tells us that sellers are gaining control in the market, and the trend is bearish.
Even beginners and newbie traders can easily read this indicator and recognize the market trend.
STC as an overbought/sold indicator
This indicator also represents the overbought and oversold conditions of the market. If the value of STC is higher than 75, it is an overbought situation. It means that there is a rigorous movement in the market in terms of buying the currency pairs. It forms a very strong bullish trend.
If the STC value is below 25, it is an oversold situation. It means that sellers are dominating a market to form a very strong bearish sentiment.
These overbought and oversold conditions help a trader form a strong trading strategy.
Comparison of Schaff trend cycle with MACD
STC resembles with MACD indicator in many ways in terms of moving averages. There are following similarities and differences between these two indicators.
Similarities
- Both indicators use moving averages for their calculations.
- Both indicators have signal lines.
- Oscillating is part of both STC and MACD.
- These indicators are equally capable of indicating an overbought and oversold phenomenon in a market.
- These indicators are capable of generating buy/sell signals.
- Both of them can identify and indicate a trend and a trend reversal.
Differences
These indicators have several things in common, but they have significant differences from each other.
| Difference | STC | MACD |
| Signal line | A 9-period EMA is not an essential component. | It always uses a 9-period EMA as the signal line. |
| calculation | It uses moving averages and cycle analysis. | It only uses moving averages, |
| Main focus | It focuses more on trend cycles. | It focuses more on momentum. |
| Application | More applicable in trend markets. | It can work in versatile markets. |
| Accuracy | It is more accurate than MACD | It is less accurate than STC |
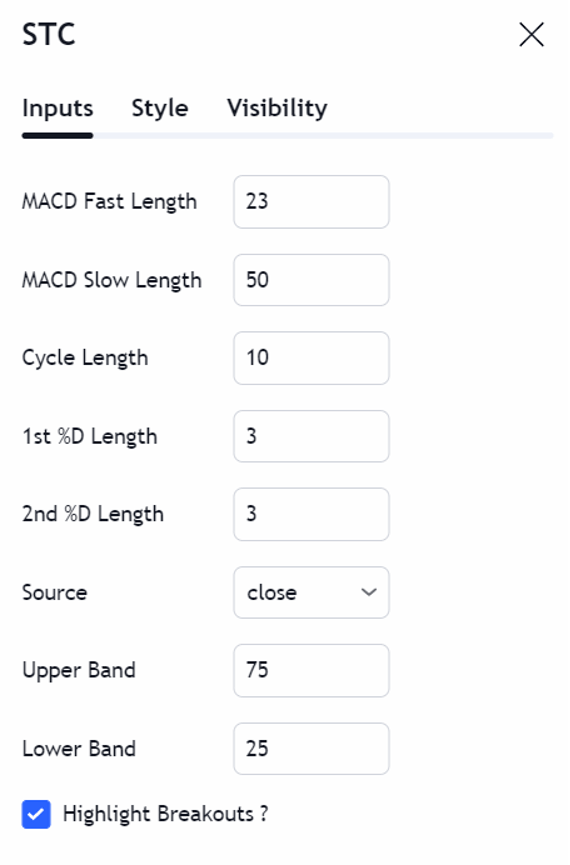
Best settings of STC
A user can change the STC settings according to his/her experience. I recommend you keep the fast period at 23 and the slow period at 50. The smoothing parameter works best at 10. A user can always change these settings according to his personal experience.
Trading strategy
The trading strategy involves entry, risk management, and to take profit.
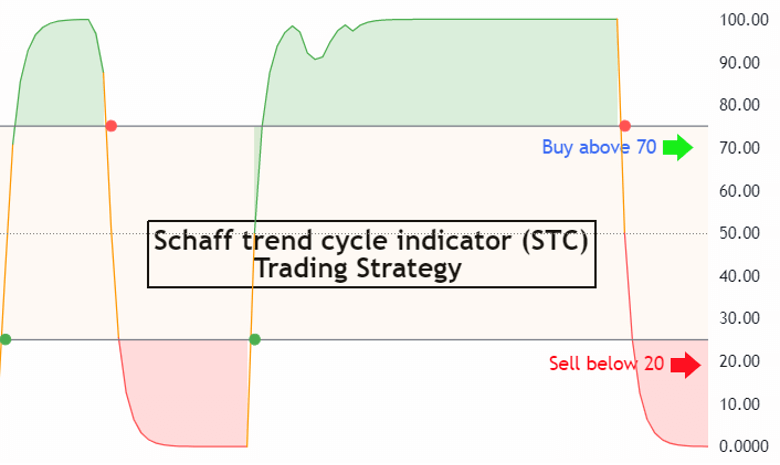
Entry
The best entry points involve the bearish and bullish strong points. You can make an entry if the value is above 70 in the case of a bullish trend. In contrast, an entry in the bearish trade involves a value of STC lower than 20.
Risk management
The risk factor is very important to manage for a good trading strategy. Use the confluence of resistance/support zones to confirm buy and sell signals. To place the stop loss, put it below the support zone to protect your trade.
Take Profit
Use the confluence of other trading indicators to maximize your profits.
Success ratio
STC is an advance and accurate indicator. This indicator has a huge potential for success. Suppose a trader uses a good trading setup around STC with the confluence of other technical analysis tools. The success ratio of this indicator is surprisingly accurate. The best confluence of STC is usually formed with momentum or volume indicator.
Pros
The advantages of using STC are,
- It helps in trend identification.
- A trader can predict the trend reversals with the help of STC
- It gives sufficient information about overbought and oversold situations.
- It is an easy to eyes indicator.
- The representation of this indicator is very user-friendly despite its complexity.
- It can generate sell-and-buy signals.
- The accuracy of this indicator is on the winning side.
Cons
As you know, there is not a single trading indicator that can guarantee you 100% success. The STC indicator also has some drawbacks.
- It is a complex indicator in terms of calculations.
- It can generate false signals, which can affect your trading experience.
- It requires the conjunction of other technical trading tools for a better success ratio.
Conclusion
STC is a much more accurate indicator if we draw its comparison with MACD. this indicator helps you to identify and generate the market trend, reversals and buy/sell signals. If you want to take the full benefit of this widely respected indicator. I recommend the combination of STC with momentum or volume indicator.
Tres bien expliqué.
Je vais le tester avec un autre indicateur