
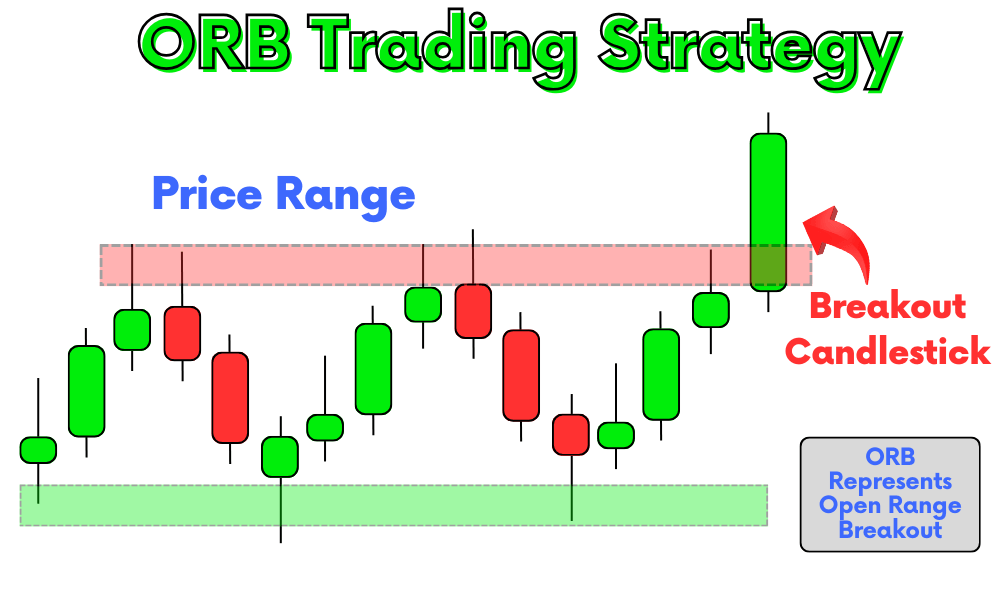
ORB means Open Range Breakout. It’s a way to trade based on what happens right after the market opens. Usually, prices move within a small range, showing that traders are unsure. When prices break out of this range and start moving clearly in one direction, it often keeps going that way for the whole day. This is what we call the Open Range Breakout trading strategy.
In this article, I’m going to talk all about this strategy. I’ll also share some tips on how to use it to win more trades. Make sure to read the whole article to get all the details.
Key Takeaways
- The Open Range Breakout (ORB) strategy is a trading approach that focuses on price movements and breakouts from a defined range after the market opens.
- Utilize 5-minute (5M), 1-minute (1M), and 15-minute (15M) charts to effectively trade the ORB strategy.
- The ORB strategy is particularly effective in Forex and stock markets, known for their clear opening ranges and potential for strong breakouts.
Types of Ranges that form after Market Opening
After the market opens, prices usually move in specific patterns or “ranges” before they decide on a direction. Understanding these ranges can help you use the Open Range Breakout (ORB) strategy better. Let’s talk about three common types of ranges you’ll see:
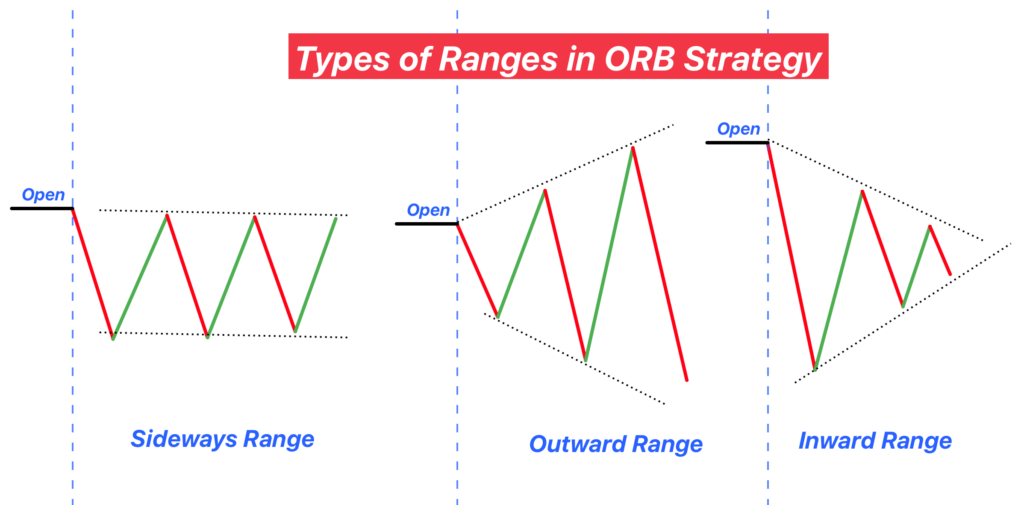
1. Sideways Range
Think of the sideways range like prices taking a walk back and forth without going far in any direction. It’s like they can’t make up their mind on where to go. This happens when traders are equally buying and selling, so the price just moves in a small area without a clear up or down trend.
2. Inward Consolidation
Inward consolidation is when prices start coming closer together. Imagine a crowd of people getting tighter and tighter into a group. This shows that a big move might come soon because traders are being cautious, and nobody’s willing to push the price too far in any direction just yet. It’s like the quiet before a storm.
3. Outward Consolidation
Outward consolidation is the opposite. Here, prices start to spread out more, like a crowd dispersing. It means traders are starting to make bigger moves, and the price is getting ready to break out of its range. This can be a sign that a strong trend is about to start in one direction.
How to find a valid price range?
To spot valid ranges in the Open Range Breakout (ORB) strategy, you need to keep an eye out right after the market opens. Here’s a simple way to do it:
- Find the Boundaries: First, look for the highest and lowest points prices reach after the market opens. These points form the top and bottom of your range.
- Draw Lines or Zones: Use these points to draw horizontal lines or zones on your chart. These lines mark the boundaries where prices have turned around.
- Look for Taps: A “tap” is when the price touches one of your lines and then bounces off. For a range to be valid, you want to see the price tap your lines or zones at least twice. It’s like the price is testing the waters but not ready to jump in yet.
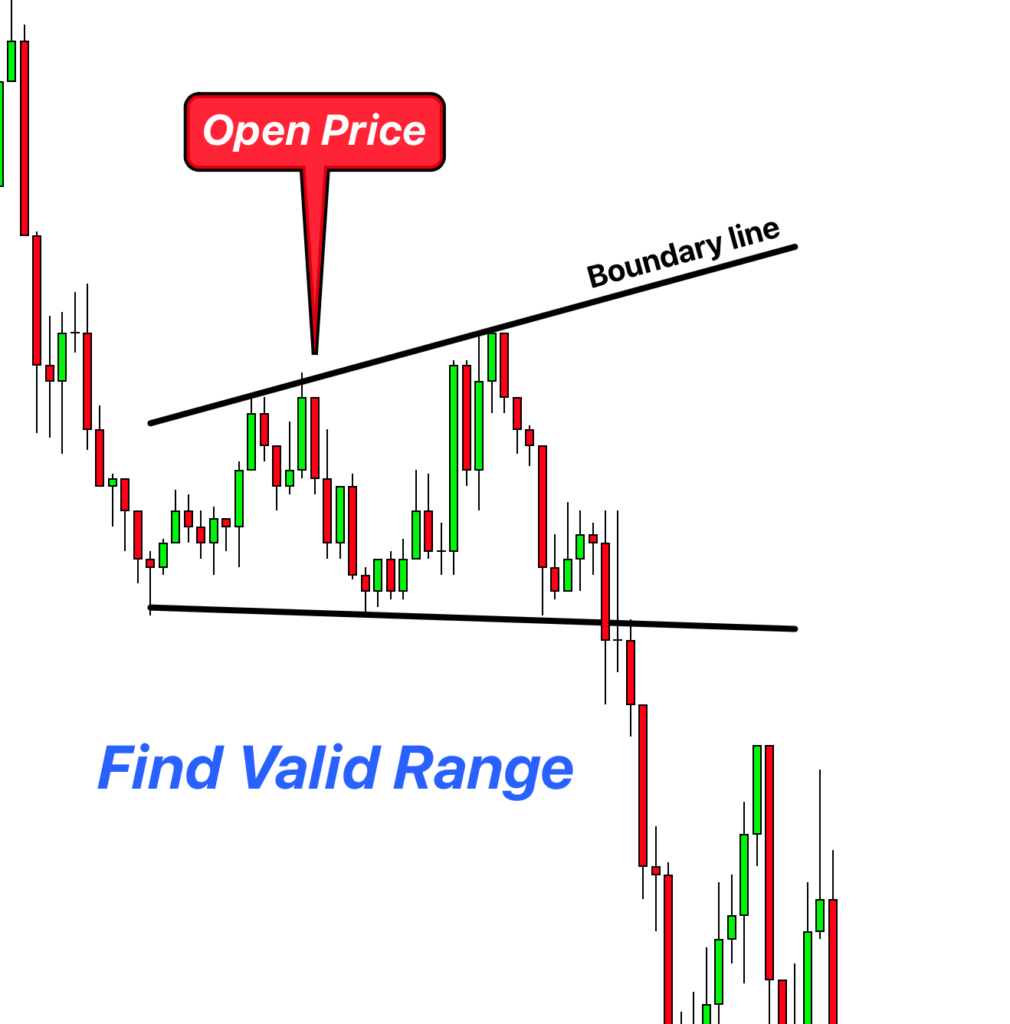
When you see these taps, it’s like the market is giving you a nod. It’s saying, “Yep, this is where we’re hesitating.” And that’s your cue. You’ve got a valid range that can guide your ORB trades.
Role of Breakout in ORB Strategy
When prices finally break out of a range, it’s a key moment. It means the market has made up its mind and is starting to move in a clear direction. But not every breakout is worth trading. To find a valid breakout, here’s what to look for:
What Happens During a Breakout
During a breakout, prices push past the range boundaries we identified earlier. This can happen quickly and shows that traders are now agreeing on a direction, either buying more (pushing prices up) or selling more (driving prices down).
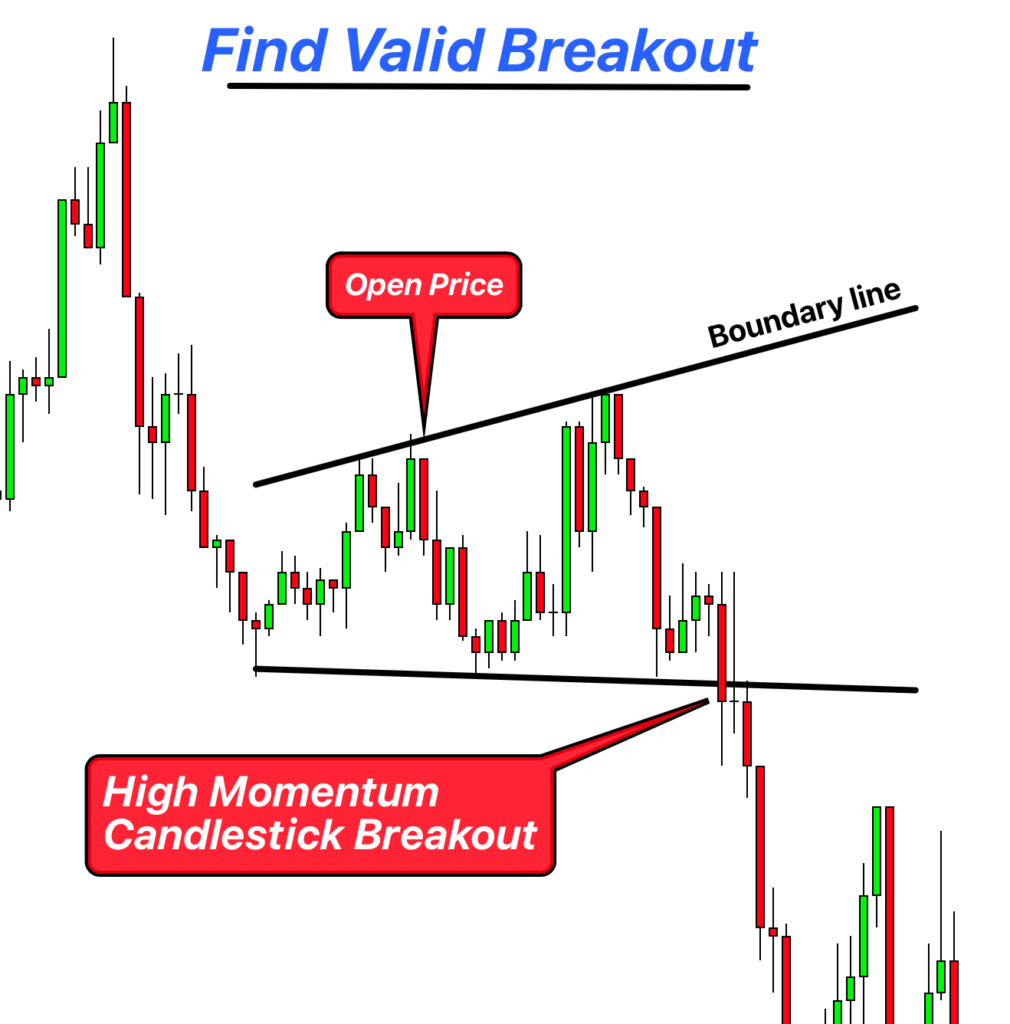
Spotting a Valid Breakout
- Look for a Big Body Candlestick: A valid breakout usually comes with a big candlestick right at the breakout point. For a buy signal, you want a big bullish candlestick (one that’s mostly going up). For a sell signal, look for a big bearish candlestick (one that’s mostly going down). This big candle shows strong momentum – it’s like the market makers are saying, “We’re going this way!”
- Check the Momentum: The size and direction of the candlestick tell you about the breakout’s strength. A big, solid candlestick means there’s strong momentum behind the move. This is what you want to see for a valid breakout.
- Be Cautious with Doji and Small Candles: If you see a doji (a candlestick with a small body) or other small candlesticks right at the breakout point, it’s better to wait. These candles mean the market is still unsure, and the breakout might not hold.
Open Range Breakout Strategy
A trading strategy is like a recipe that mixes together different ingredients to make a good trade. Just like in cooking, the more good stuff you add, the better your chances of success. The ORB trading strategy is no different. It uses a bunch of helpful clues from the market to make your trades more likely to win.
Let’s break down the steps to make this strategy work for you.
- Find the Valid Range: Start by identifying the valid range right after the market opens. This range is your first clue to understanding where the market might head. Look for a sideways movement where prices are bouncing between two points, making sure there are at least two taps on each boundary to confirm it’s a valid range.
- Consider Correlated Pairs: To refine your approach, look at correlated pairs too. For example, if you’re trading EUR/USD, you might also look at GBP/USD or other pairs that often move in similar patterns. Choose the pair with the clearest range for a better chance at a successful trade.
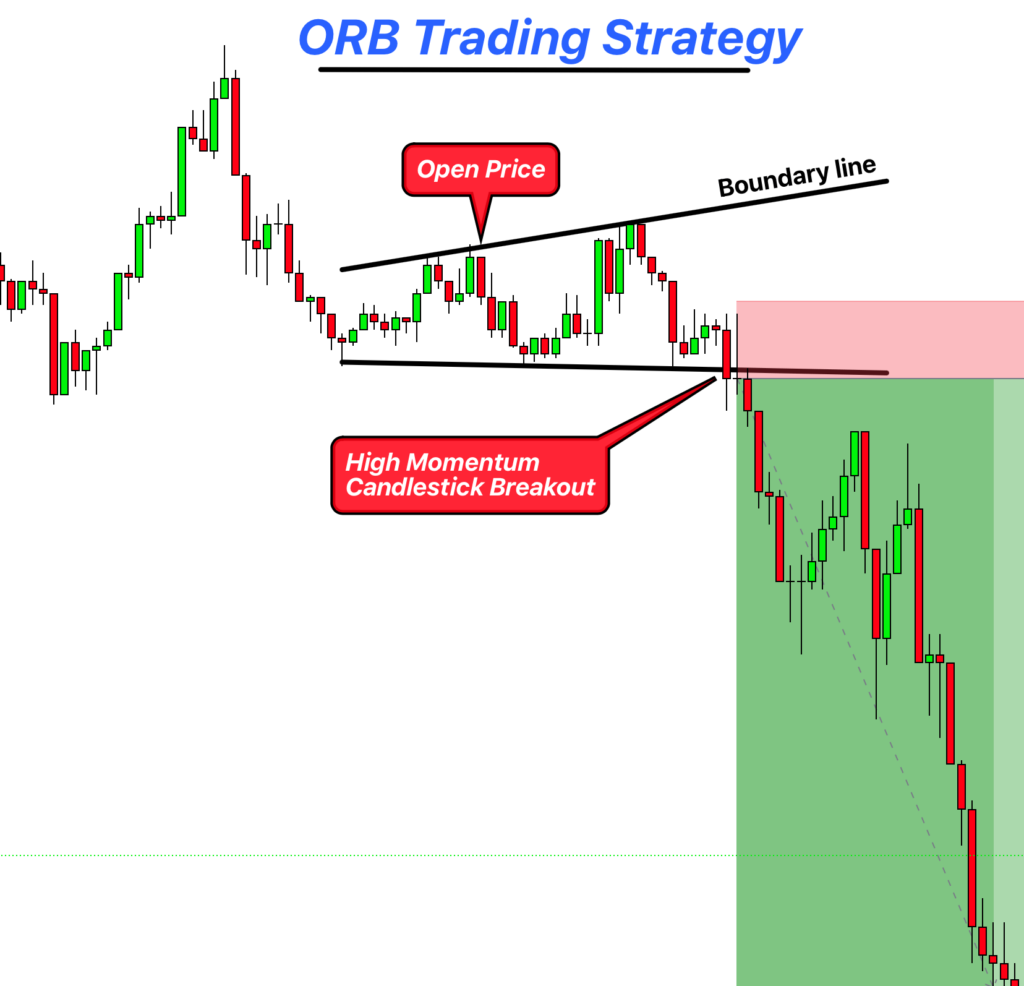
- Draw Boundary Lines: Once you’ve identified the range, draw horizontal lines on your chart at the top and bottom of this range. These are your boundary lines, marking the zones the price needs to break out from to signal a clear direction.
- Spot the Breakout: Watch for a strong breakout from this range. A valid breakout is usually accompanied by a large candlestick moving away from the range, showing strong market momentum. For a buy trade, look for a bullish breakout to the upside. For a sell trade, a bearish breakout to the downside is what you’re after.
- Enter the Trade: When you see a valid breakout, it’s time to enter the trade. If you’re buying, place your buy order just above the range’s upper boundary. If selling, place your sell order just below the lower boundary.
- Set Your Stop Loss: Place your stop loss at a strategic point to limit potential losses. For a buy order, a good spot might be just below the most recent swing low within the range. For a sell order, consider setting it just above a recent swing high. Alternatively, you can place the stop loss on the opposite side of the breakout range for added safety.
- Manage the Trade: Hold onto the trade through the day, aiming to capture the momentum that typically follows a valid breakout. While you might be tempted to hold until the market close, it’s wise to also use other technical tools to decide on a take-profit level. Indicators, trend lines, or previous resistance/support levels can offer valuable insights for closing your trade profitably.
Open Range Breakout Examples
Let’s discuss the ORB (Open Range Breakout) strategy as it is applied to the candlestick charts you’ve provided:
Example 01: Sideways Range ORB
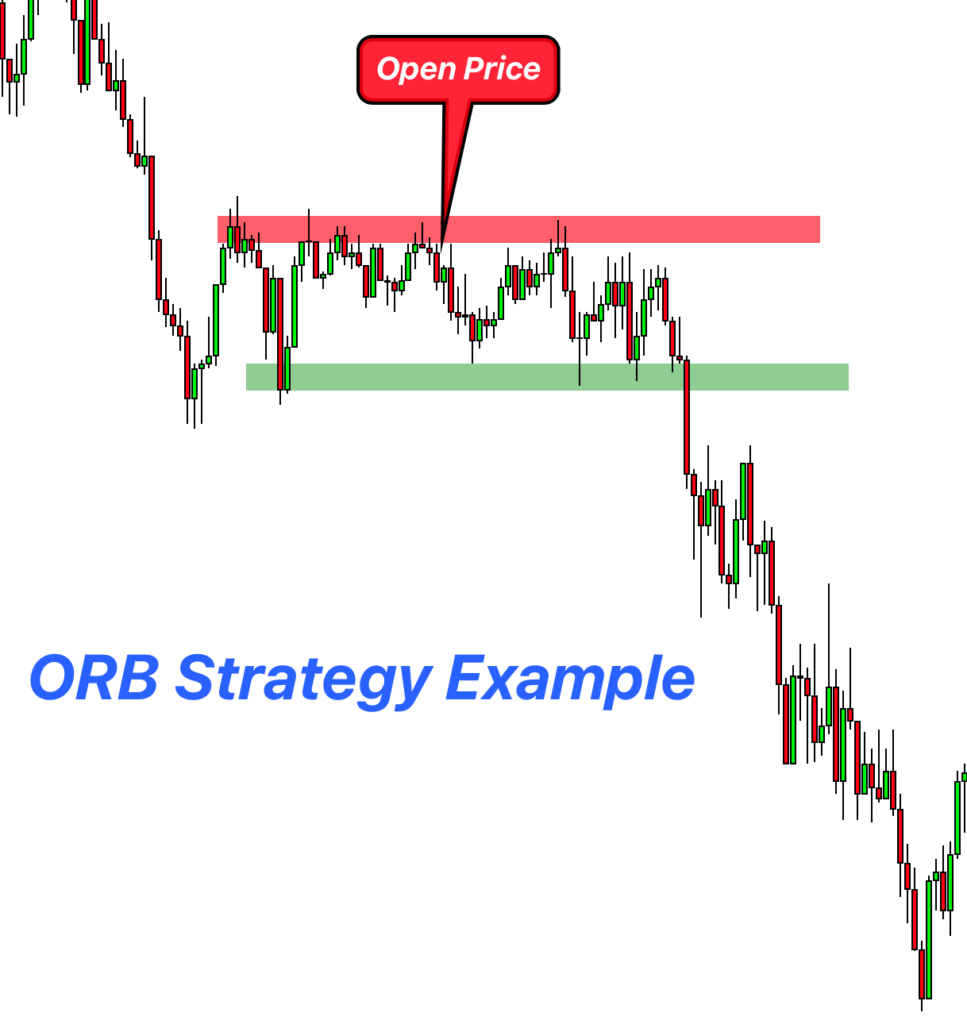
The first chart illustrates a sideways range, where the price action moves horizontally after the market opens, indicating indecision. The range is defined by multiple candlesticks fluctuating between two horizontal levels. A breakout occurs when a candlestick finally closes beyond the range, which in this example is downward, indicating a potential sell opportunity. Traders utilizing the ORB strategy would wait for this confirmation before entering a trade. The ideal moment to enter a sell trade would be just after the bearish breakout candle, with a stop loss placed just above the upper boundary of the range.
Example 02: Inward Consolidation ORB
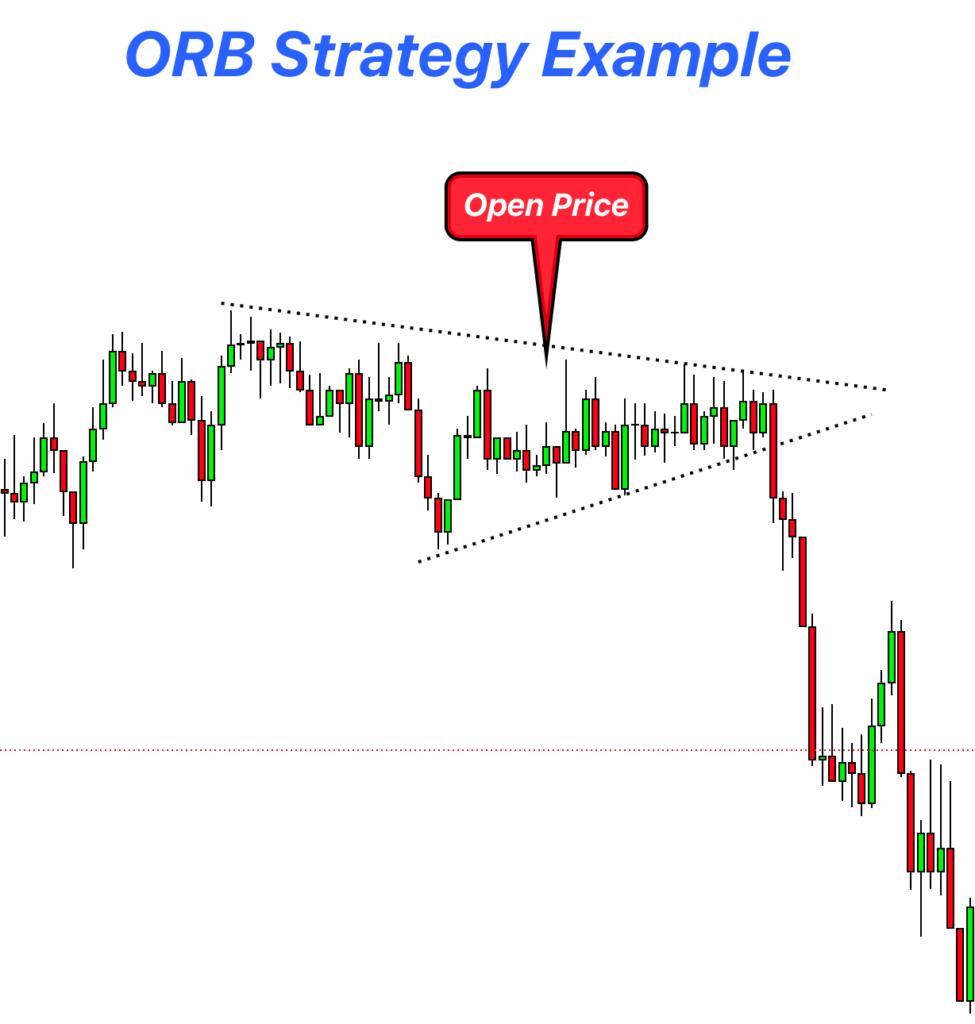
The second chart shows an inward consolidation pattern, where the candlesticks start to pull in closer together, forming lower highs and higher lows. This tightening of price action suggests a buildup of pressure. In this example, a clear downward breakout is visible with a large bearish candlestick, suggesting a strong sell signal. Traders would look for such breakouts to enter a trade, placing a stop loss above the recent high within the consolidation.
Example 03: Outward Consolidation ORB
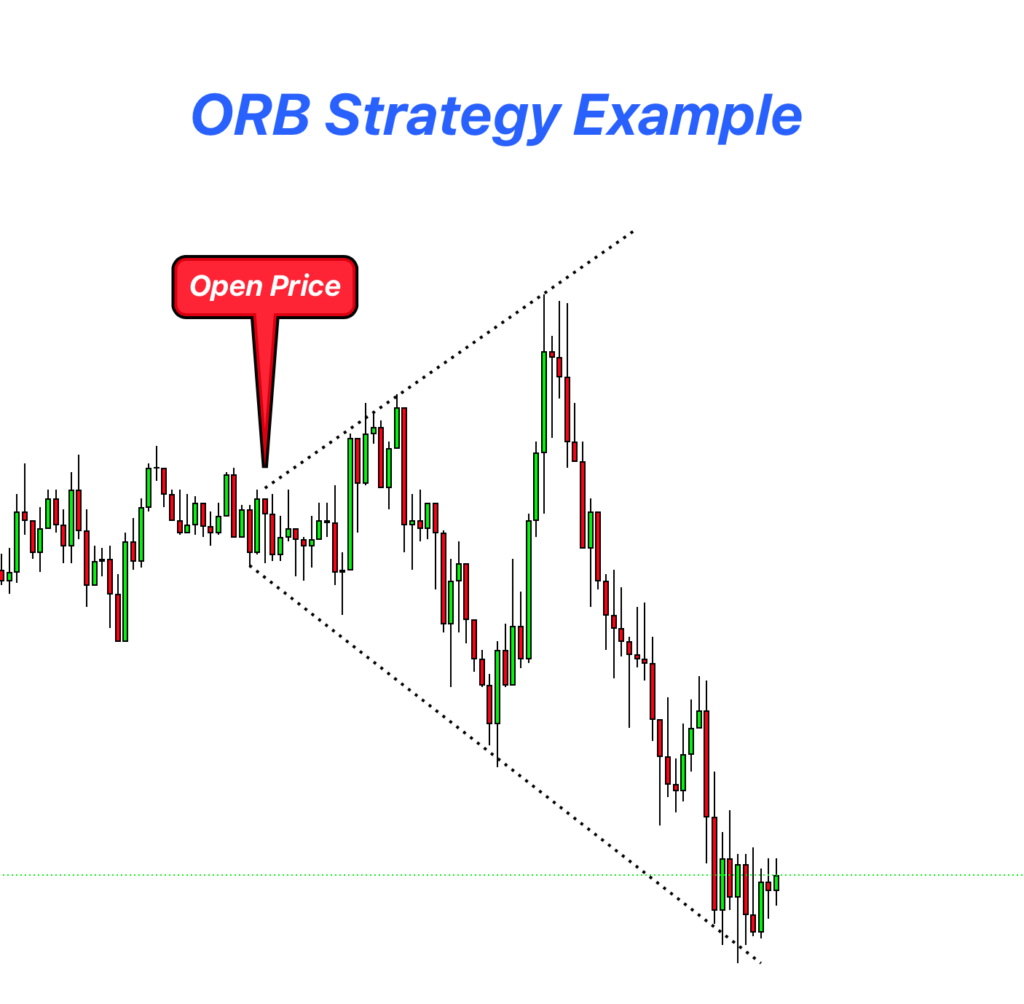
The third chart depicts an outward consolidation. Here, the price range starts to widen as the market progresses, indicating increasing volatility and trader indecision. The key to trading this pattern is to wait for a decisive breakout with a large candlestick, as seen in the example where a significant downtrend follows. The entry point for a trader would be post-breakout, with a stop loss set above the last high before the breakout candlestick.
In each of these examples, the ORB strategy is used to identify the moment of breakout as the key signal for entry into the market.
Common mistakes to avoid
Sometimes, the market doesn’t give us a clear range to work with, and that’s okay. It’s like fishing; if the fish aren’t biting in one spot, you don’t just keep casting your line in the same place, hoping for the best. In trading, it’s important to recognize when the conditions aren’t right. If you can’t find a good, clear range after the market opens, it might be a sign to sit this one out.
Patience and risk management are super important in trading. It’s better to wait for those few great opportunities that come up, rather than jumping into lots of trades that aren’t so clear. Think about it: making 3 to 5 good trades in a month can be way better than making lots of trades that don’t go anywhere or, worse, lose you money.
So, if the market isn’t showing a good range to use for the ORB strategy, take it as a sign to wait. The best traders know that sometimes, the smartest move is not to trade at all. Wait for those moments when everything lines up just right, and your chances of winning will be much better.
FAQs
For the ORB strategy, the best timeframes to use are the 5-minute (5M), 1-minute (1M), and 15-minute (15M) charts. These shorter timeframes give you a good view of the opening range and the breakouts as they happen.
The ORB strategy works well with both Forex and stocks. These markets often show clear opening ranges and can have strong breakouts that the ORB strategy can capitalize on.
Yes, the ORB strategy can still be profitable. However, markets have been showing more false breakouts and patterns after the opening range lately. This is why adding extra factors or “confluences” to your strategy is important to increase your chances of success.
You should look for an opening range that forms within the first one to three hours after the market opens. This timeframe gives the market enough time to establish a clear range without waiting too long to enter your trades.
Conclusion
In conclusion, the Open Range Breakout (ORB) is a powerful strategy for traders looking to capitalize on the initial market movements after the opening bell. By focusing on clear, well-defined ranges within specific timeframes, and choosing the right financial assets, traders can increase their chances of executing successful trades.
Keep in mind that patience and risk management are key components of this strategy. Not every day will present a perfect trading opportunity, and recognizing when to stay on the sidelines is just as important as knowing when to act.