Definition
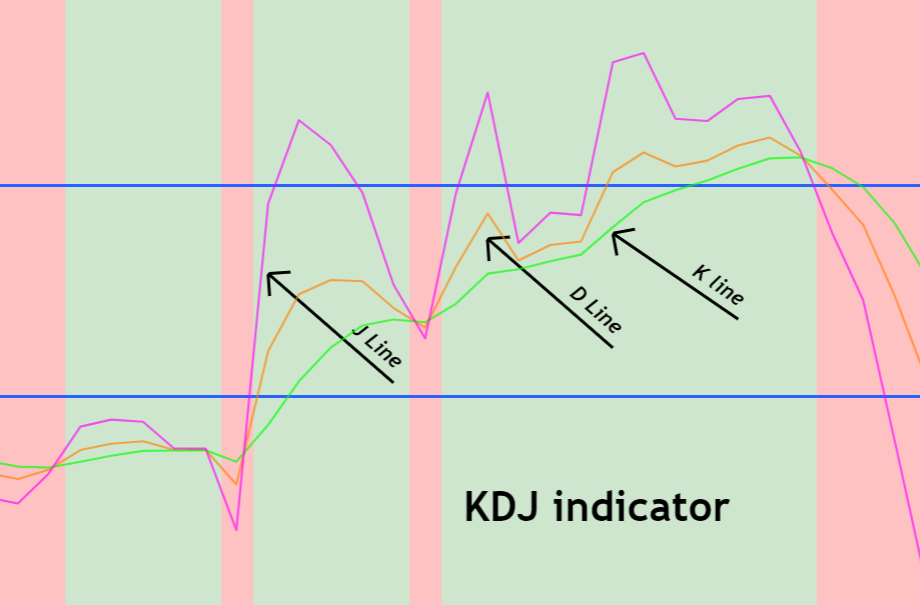
KDJ indicator is a technical indicator used in stocks and options trading to predict the upcoming trend in the market. It consists of three lines K, D, and J line. Each line has a specific role in analyzing the chart.
It has a similar working principle like a crossover of three moving averages, but the KDJ indicator has high accuracy in predicting the trend reversals. Many retail traders use it in trading higher timeframes to profit.
In this post, you will learn the complete details of the KDJ indicator with a good trading strategy to practice.
How does the KDJ indicator work?
K, D, and J are the three lines used to generate a trend reversal signal in trading. These three lines combine to make the KDJ indicator
- K & D lines indicate the overbought or oversold conditions like an RSI indicator.
- J line is used to show the deviation of the K line from the D line.

Purpose of K & D lines
When using the indicator, you should draw two horizontal lines at 70 and 30 levels because this will help you determine the oversold and overbought conditions.
If the K & D lines rise above the 70 levels, the stock or option will be in an overbought state. On the other hand, stock or option will be oversold if the K & D lines fall below the 30 levels.
Purpose of J line
J line indicates the strength of the trend. When a large impulsive wave forms on the chart, then deviation between k & d lines will increase, resulting in the rise of the J line. J line can also go far beyond the 100 level. It depends on the market movements.
How to add the KDJ indicator in tradingview?
It is easy to set up this indicator in tradingview. Keep in mind that KDJ is not a built-in indicator in tradingview. Community members have made it, but it is free to use.
- Open the chart of preferred stock
- Go to “indicator” on the top bar and search KDJ indicator
- Select the KDJ indicator and add it to the chart
- Apply the following settings. “9 Period” and “3 signal”
Finally, you have set up a KDJ indicator
KDJ indicator trading strategy
A trading strategy consists of many parameters. You can not profit in trading by following a simple crossover of lines. It would help increase the probability of a trade by adding confluences and proper risk management and money management rules.
We always recommend adding price action with indicators to make a trading strategy. Because a simple indicator can show you profitable results sometimes, but sometimes it will generate many false signals. So, you will lose all the profit.
You should consider a few filters while trading with the KDJ indicator.
- candlestick pattern
- Range filter using 30 & 70 levels

How to trade?
Buy signal
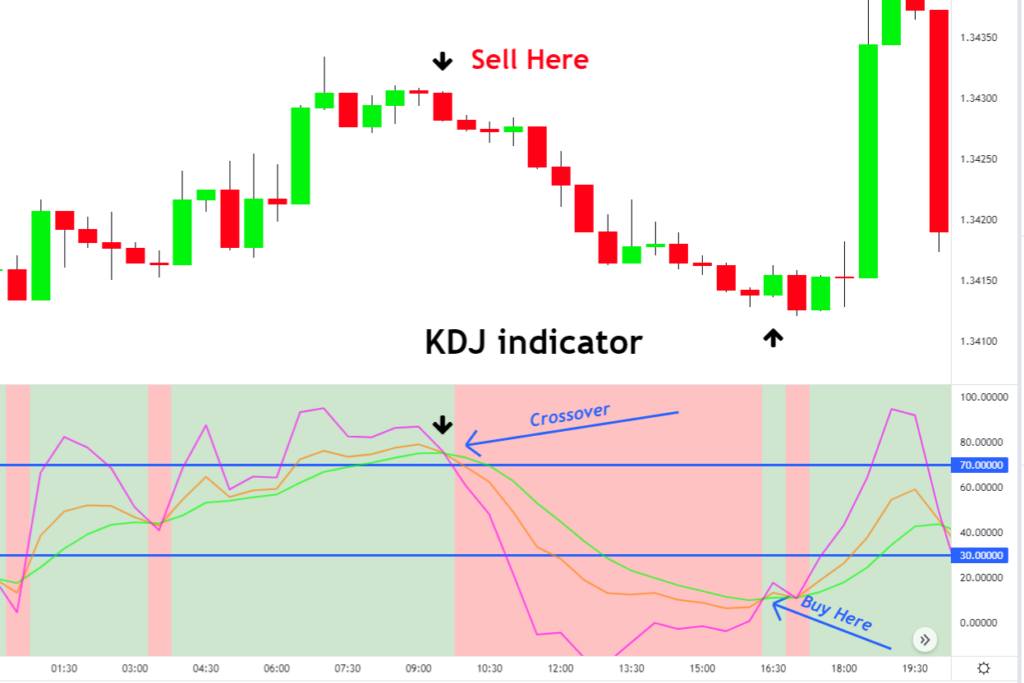
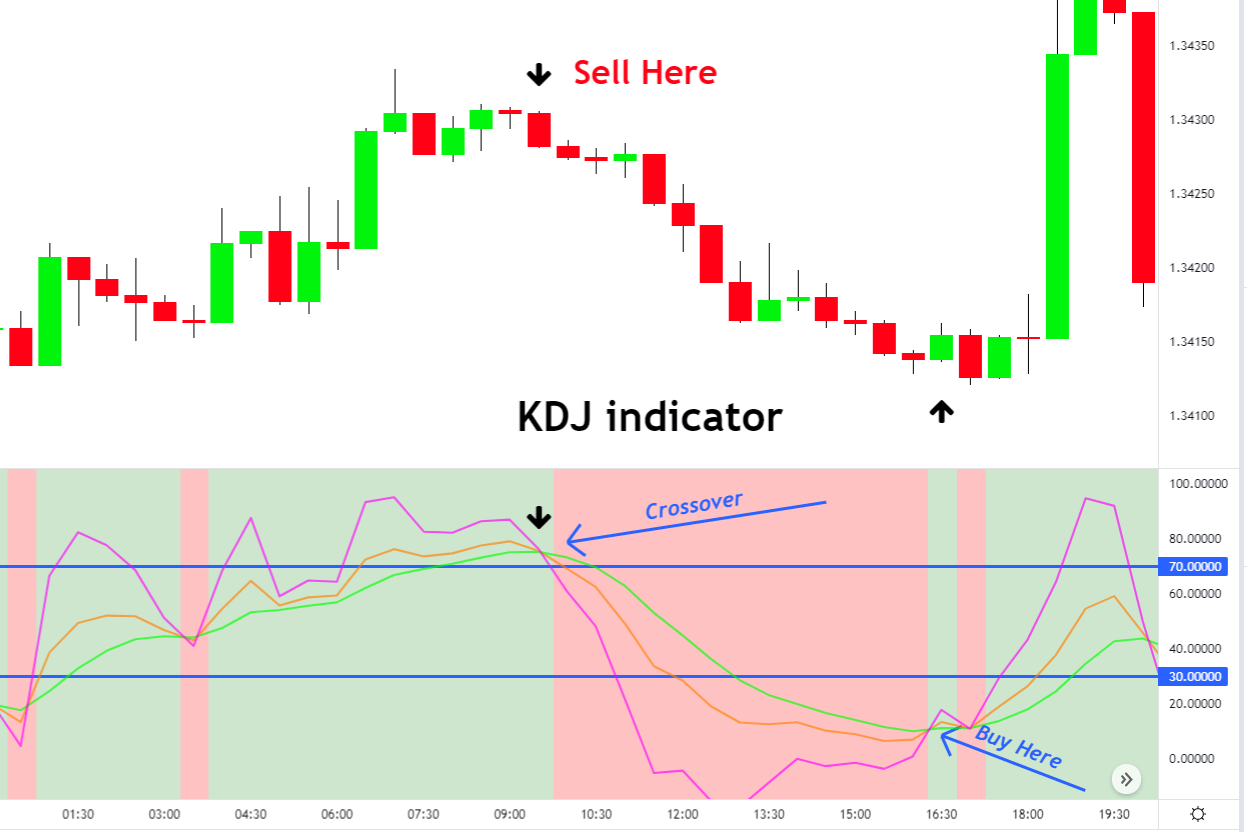
A buy signal is generated when K, D, and J lines cross each other upward. But you can add a few conditions to increase the probability of buying trade. A buy setup should meet the following conditions
- Bullish crossover
- A bullish candlestick pattern
- Crossover of K, D and J lines should happen below the 30 level
Sell signal
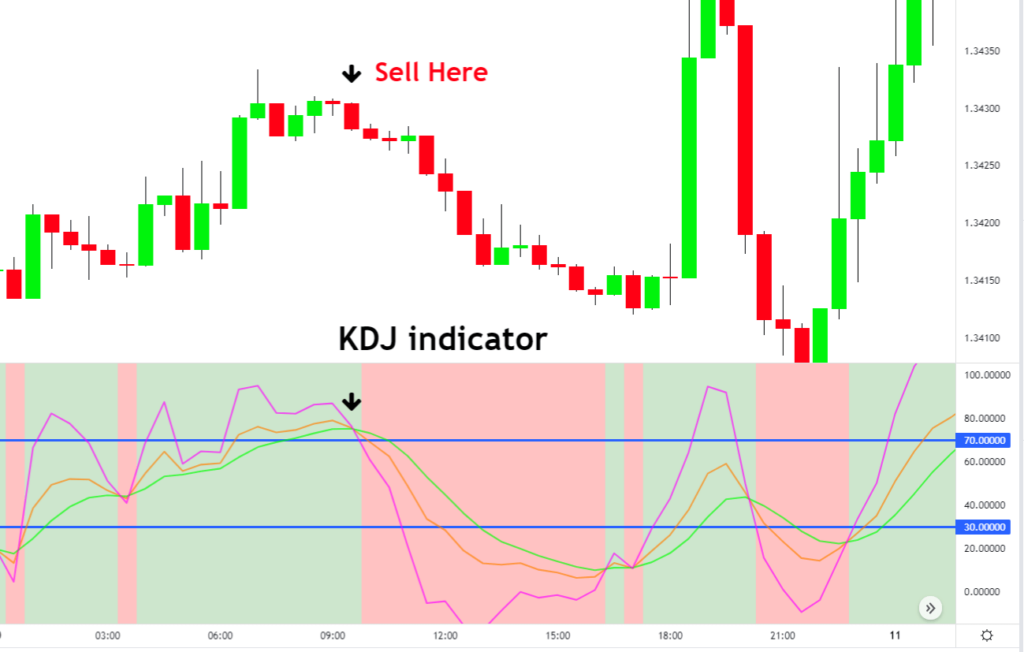
A sell signal is generated when K, D, and J lines cross each other in a downward direction. it should meet the following conditions
- Bearish crossover
- A Bearish candlestick pattern
- Crossover of K, D and J lines should happen above the 70 level

The bottom line
Most beginner traders use the simple crossover strategy, but it is not profitable. You will always need to add confluences to increase winning probability because trading is the game of probabilities.
Before using it on a live account, make sure to backtest this trading system properly.


