
The prediction of a reversal in price from an important level is a very difficult task in forex technical analysis. In this article, something new is that we will trade forex reversal patterns but only with trend. Not understood! Read this article and in the end, you will understand the complete logic behind it. I will also display important reversal patterns and minor details about all of them so you can trade efficiently. If you have learned reversal patterns from many blogs on the internet except Forexbee then also read it to the end you will learn the difference in the approach of a trader and a blog writer.
What is a reversal pattern?
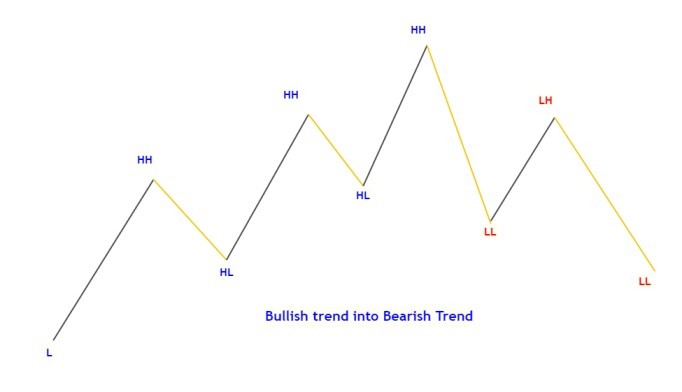
A pattern that indicates an upcoming reversal in trend is called a reversal pattern. For example, a bullish trend will turn into a bearish trend after the formation of a reversal pattern in forex or vice versa.
Most important Reversal Chart Patterns
- Quasimodo Pattern
- head and shoulders pattern
- Wedge Pattern
- Pin bar candlestick pattern
These four chart patterns are the most important ones. You may know about these patterns already but proper figuring out of a pattern with at least one confluence is the most important. As the location of a pattern is the key to identify a perfect and profitable chart pattern. In this article, you will learn about all the tactics and proper location of the pattern as well as trade a reversal pattern with the trend.
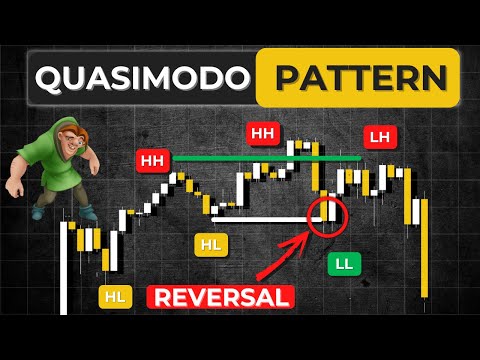
Quasimodo pattern
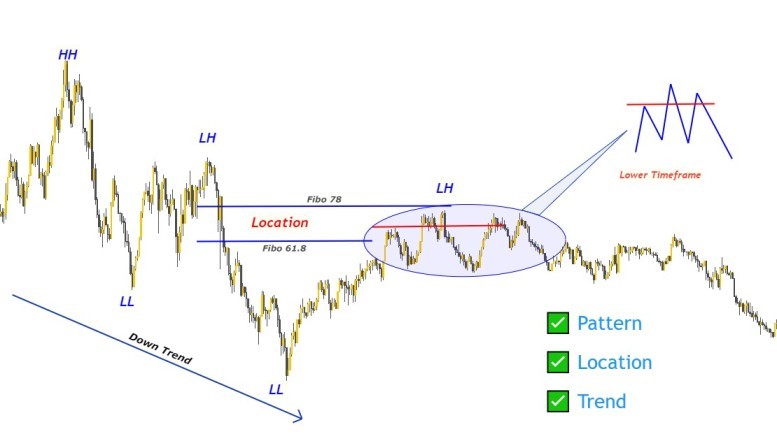
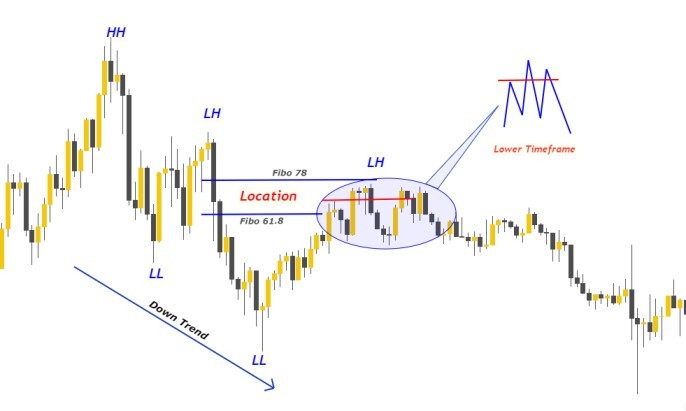
The pattern in which break of recent lower high by the price takes place after at least two consecutive Lower lows and lower highs, then price retraces to price level of second last lower low and then reversal takes place from this price level and price changes its direction from this level is called Quasimodo pattern.
Quasimodo is the most important reversal pattern in forex technical analysis and a high probability pattern with a high risk-reward ratio but without properly knowing its location you cannot profit even from this pattern. I will explain A to Z in detail about the Quasimodo pattern in the next post. the images of a perfect Quasimodo pattern are below
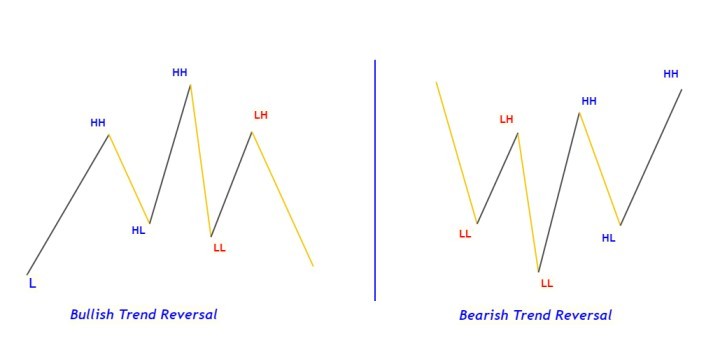
Chart pattern location
The location of every chart pattern matters a lot so I have been explaining it with a separate heading for better understanding. There are many tools to identify a better location of a pattern. I always wait for a better location pattern. By the time, now I have learned to wait. Believe me, patience is fruitful in forex trading.
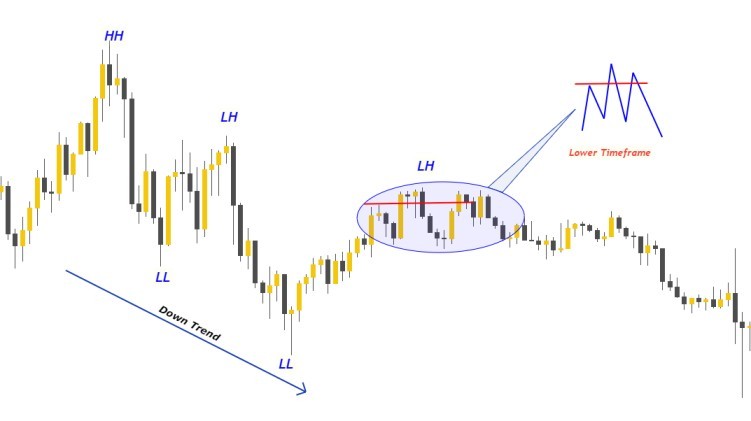
Quasimodo pattern within a retracement or ranging condition will be a losing setup most of the time. The best location is just after a trend. Like a bullish Quasimodo pattern during a bearish trend or a bearish Quasimodo pattern during a bullish trend will be going to work perfectly. Quasimodo is one of the best forex reversal patterns. Watch in the images below, the difference in the performance of the Quasimodo pattern during a trend and during a range.
The best indicator to be used for identifying the location of the Quasimodo pattern is a Fibonacci tool.
How to Trade with trend:
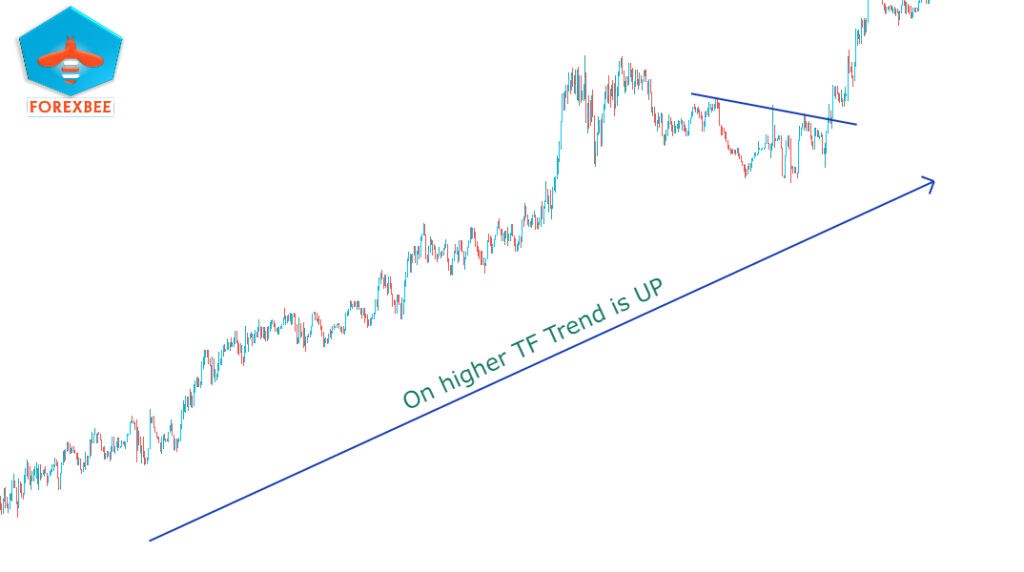
Trading a reversal pattern with a trend is very simple. Don’t overcomplicate it. Just open a higher timeframe. If you don’t know how much higher the timeframe chart to open then read this.
On the higher timeframe just look for higher highs and lower lows. And you have to trade in the direction of this trend only. Simple!
If still not able to do this? Then just apply a 21-period exponential moving average on a higher timeframe and only trade in the direction of the moving average.
Head and Shoulders Pattern:
There are two types of head and shoulder patterns. One is a simple top head and shoulder pattern and the other one is called an inverse head and shoulder pattern. The most widely used reversal chart pattern is the head and shoulder pattern that’s why market makers try a lot of fake-outs in this pattern. But I will show you the best way to trade this pattern and for recognition of reversal in price. The images of the ideal head and shoulder pattern are below.
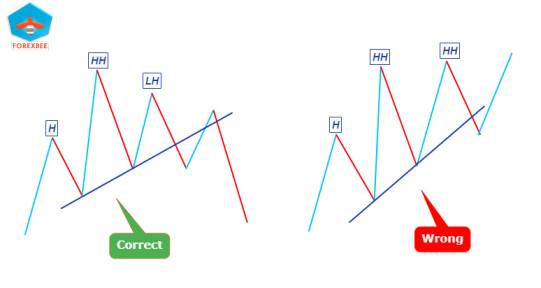
Chart pattern location:
In the same way, to find out the perfect location the Fibonacci tool will be used. Fibonacci 61.8 and 78 levels represent the perfect location for head and shoulder patterns. The good news here is that it can be traded in every type of environment either ranging or trending.
How to Trade with trend:
In the case of head and shoulder pattern, after zooming out the screen and opening a higher timeframe. The next step is to look for the direction of higher highs or lower lows. I mean to look for trends. If there are higher highs then we will only trade in the direction of buyers and on the other hand in the case of lower lows we will only trade in the direction of sellers. Look in the image below.
Wedge Pattern:
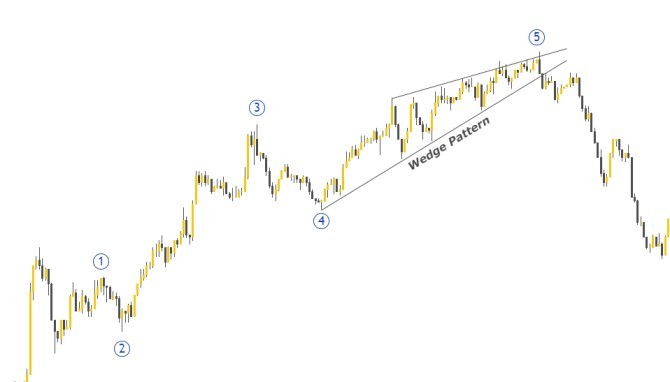
The second most widely used reversal chart pattern is the wedge pattern. This is a very simple pattern drawn by the use of trend lines. Trend line breakout will confirm the reversal in price. The main thing in this pattern is to look for waves. Always look for at least five waves in this chart pattern before the breakout of a trend line. If there are five waves then it’s valid otherwise not tradeable.
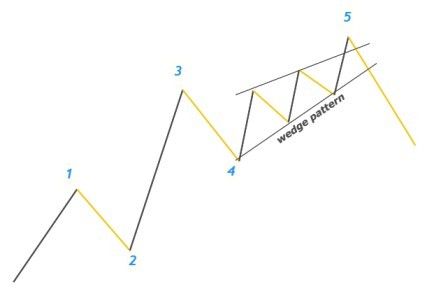
Wedge pattern location:
The wedge pattern location must be at the 5th wave. Learning Elliot wave basics is necessary to trade this pattern. In the 5th wave of Elliot wave which is the last wave of an impulsive move, if there is a wedge pattern then it’s the best location for this pattern. Using the Fibonacci tool will be a plus point for this but not necessarily.
How to Trade with trend:
For the wedge pattern, I will say it’s not important because we are already using Elliot wave. But you can still do higher high or lower low analysis of higher timeframe but it’s not necessary in this case.
Pin bar candlestick pattern
If you don’t know why I have mentioned pin bar candlestick in the chart pattern then read the paragraph below because we will use multi-timeframe analysis here and a higher timeframe pin bar can be traded in a lower timeframe.
Bullish pin bar pattern
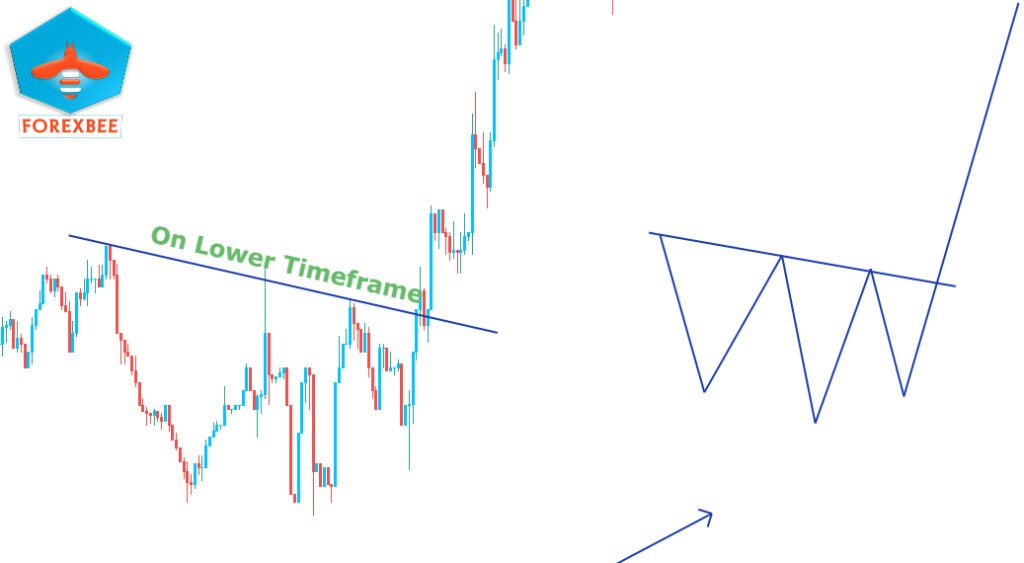
First step here is to look for a bullish pin bar on a higher timeframe with a location of Fibonacci 61.8 or 78 and the trend must be bullish. Then open a lower timeframe and draw a trend line. Here there must be a significant difference between higher or lower timeframe like H4 is higher timeframe then m5 or m3 will be the lower timeframe. Now the only step is to look for trend line breakout and then entry. In this way you can trade a pin bar with high efficiency and high probability.
Bearish pin bar pattern
All the above rules will be the same only trend must be bearish and we will trade a bearish pin bar in this case. The pin bar candlestick pattern is an additional pattern or technique otherwise above three patterns are enough to be a profitable trader.
I know this is difficult but this is profitable. Your goal should be to take three to four trades in a month then you will be patient for a perfect pattern otherwise you will end up losing because of psychological issues.
There are no guarantees in trading. The sooner you accept that you sooner you can release your expectations and focus unconditionally on a proven process.
Yvan Byeajee, The essence of trading psychology in one skill
I hope you will like this Article. For any Questions Comment below, also share by below links. Use Tradingview for technical analysis instead of mt4. Join Telegram to get trade ideas free.
Thanks
Note: All the viewpoints here are according to the rules of technical analysis. we are not responsible for any type of loss in forex trading.