
Introduction
Starc bands indicator is a technical trading tool that provides sell and buy signals with the help of high and low prices in a volatile market. This indicator is also capable of indicating a trend change.
The full form of the STARC band is Stoler Average Range Channel.
The founder of these bands is Manning Stoller.
We can equally use STARC bands in a ranging and trend trading market.
Objectives
The key objectives of this indicator are the following.
- To mark the highs and lows of the market.
- To generate sell and buy signals.
- To indicate a trend reversal.
Significance
STARC bands are very beneficial for a trader. They provide very versatile and complete information about the market. It can help a trader to see a better picture of the market and improve his/her decision-making.
The significant importance of this indicator is as follows.
- This indicator works efficiently in a volatile market.
- It can generate buy and sell signals.
- It helps traders in decision-making.
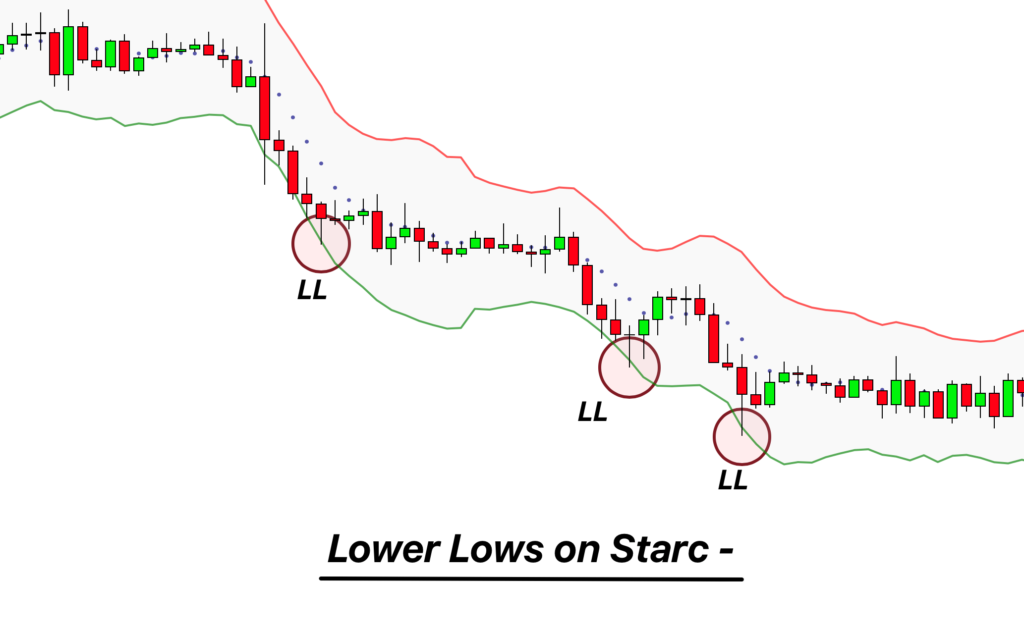
- Starc bands provide a better picture of the market in terms of higher highs and lower lows.
- It is a very helpful tool in range trading.
- It helps in trend identification.
- Starc bands are capable of identifying a trend reversal.
Mathematical formula
STARC bands use simple moving averages as the principle behind their calculations. There are two types of starc bands.
- Starc band +
- Starc band –
The formula of Starc band +
Starc band + = simple moving average + (multiplier x ATR)
The formula of Starc band –
STARC band – = simple moving average – (multiplier x ATR)
ATR = Average true range
Multiplier = factor that you will apply to the average true range. (a user can adjust the value of his choice in settings)
Working of STARC bands
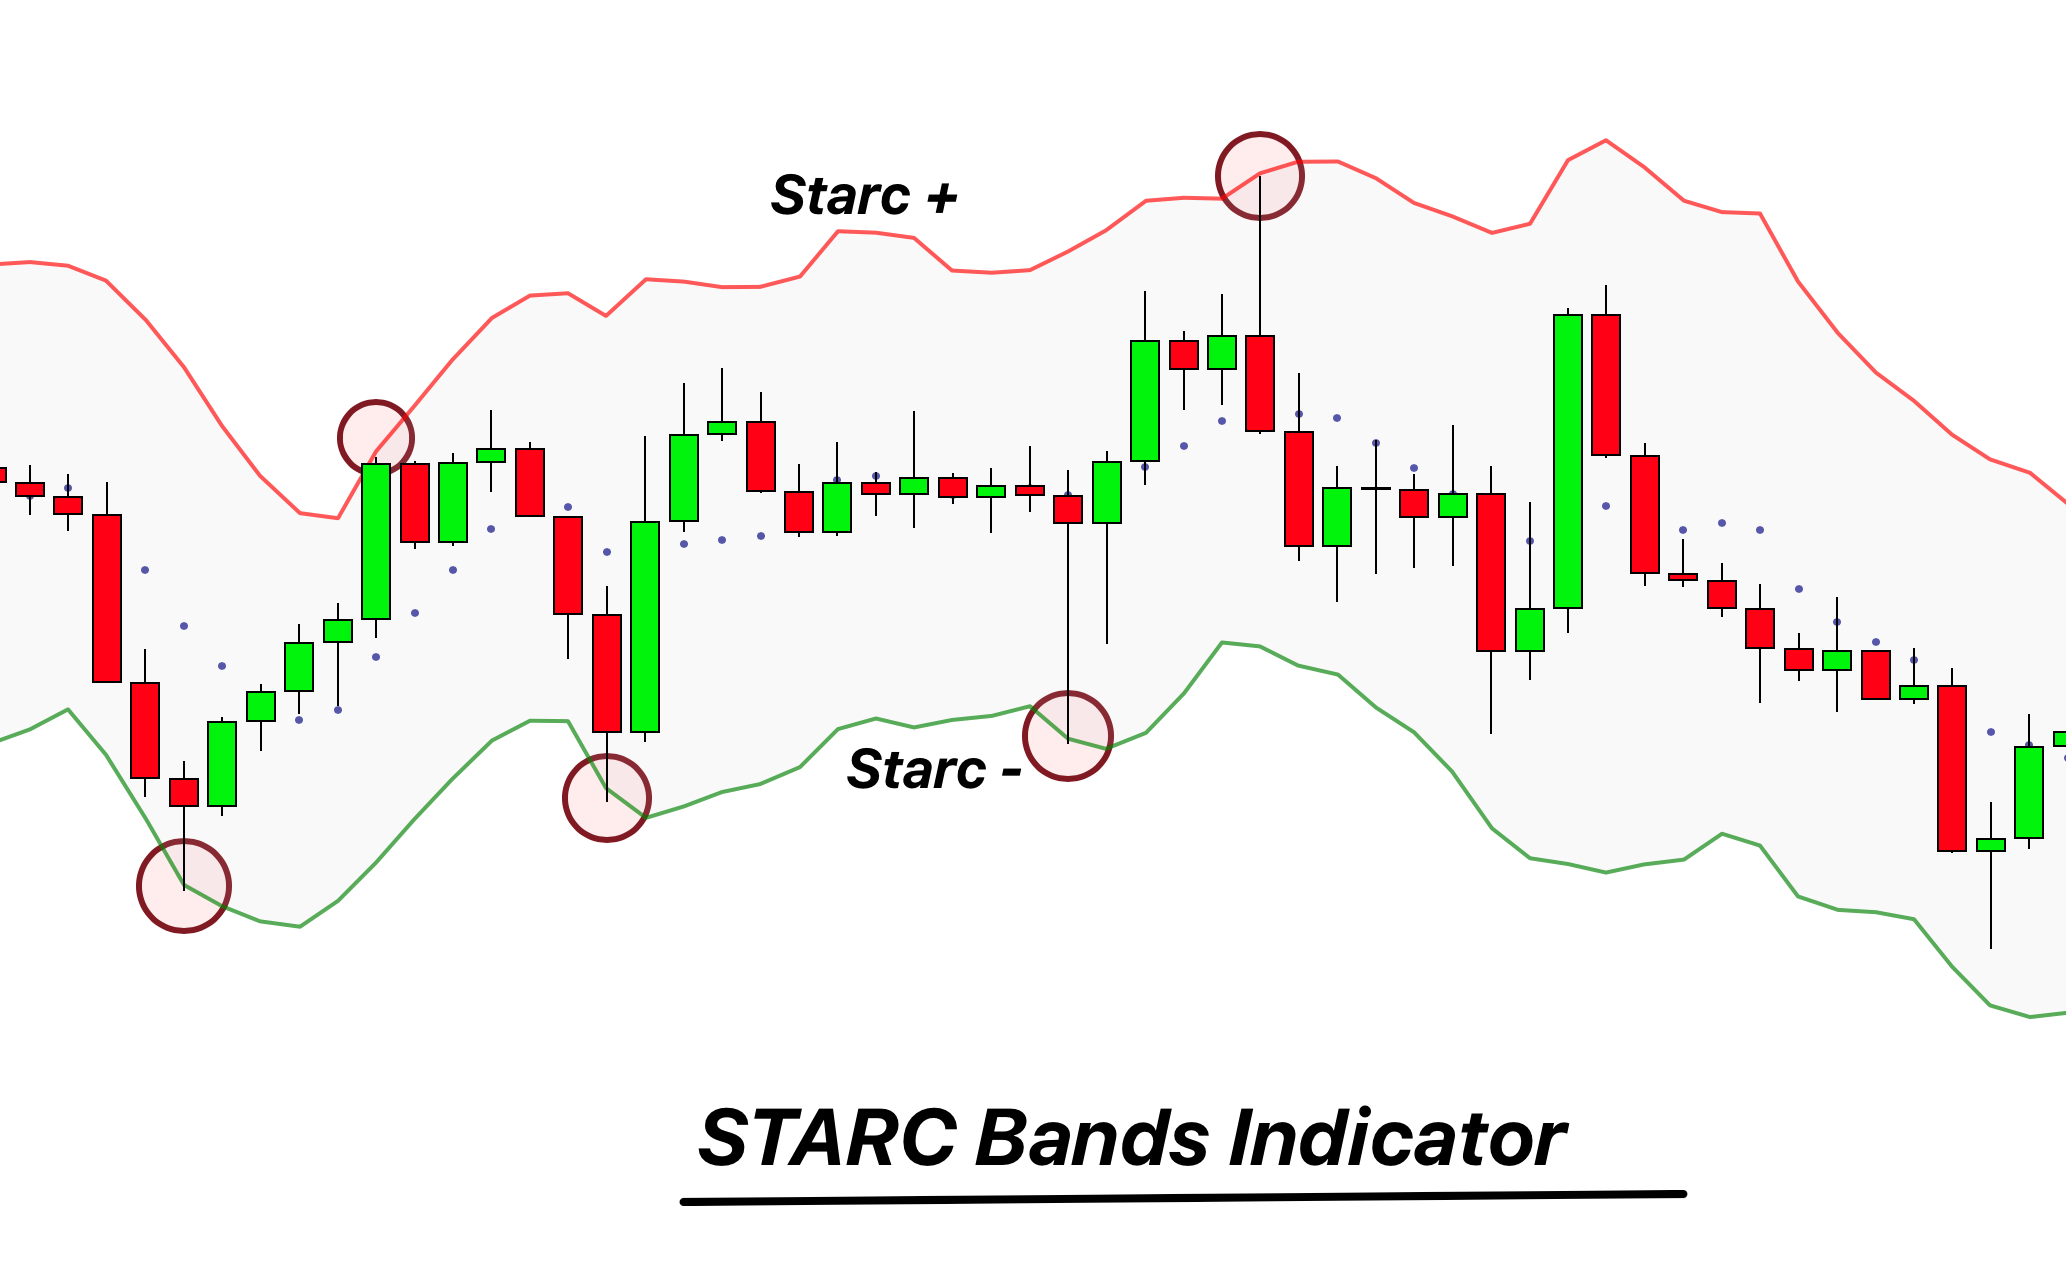
The working of STARC bands is very basic and easy to understand. STARC bands tell us a complete range of market price variations. It tells us about the higher highs and lower lows of the market. STARC band uses the two bands for the fulfillment of this purpose.
STARC band +
These bands are at the upper sides of the market. They indicate a bullish market. Positive bands help us to find the higher highs of the market.
The higher price of an asset usually stays in the range of the upper positive bands. These bands represent a bullish sentiment of the market and generate buy signals. As the upper bands begin to dip, this indicates a trend reversal.
STARC band –
These bands act as antagonistic to the positive bands. They mark the lower boundary of the market and signal a sell signal. The negative bands tell us about the lower lows of the market. The upward movement of these bands indicates a future bullish reversal event.
The price of the assets stays between these two bands. So, a user can get an idea about the market events related to price change.
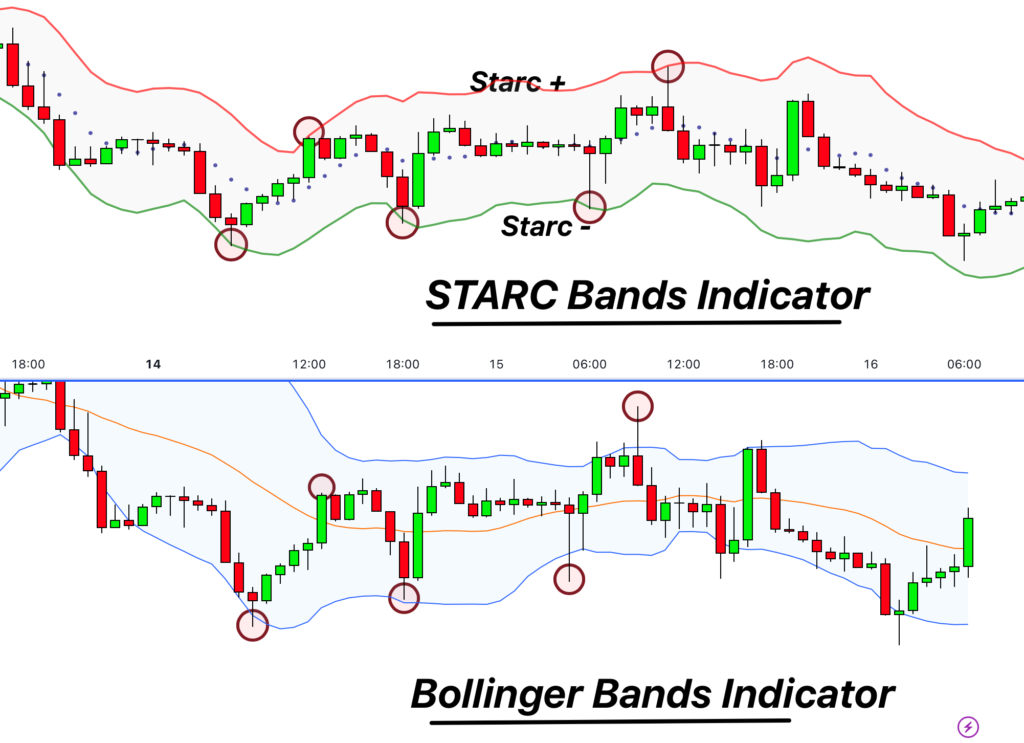
Comparison of STARC bands and Bollinger Bands
The STARC bands and Bollinger bands show significant similarities to each other in their working style.
Similarities
The similarity between these two bands is,
- Both bands use a simple moving average for creating bands.
- They are equally effective in representing the higher highs and lower lows of the market.
- They can help in generating the buy/sell signals.
- These bands tell us about the market reversals.
- Both of these bands help in forming a trading strategy.
Differences
STARC and Bollinger bands differ from each other in many ways. The comparison in terms of differences between these two bands is as follows.
- Both of these bands use simple moving averages, but STARC bands use the Average true range in addition for calculations.
- There are upper, middle, and lower bands in a Bollonger band. STARC bands are composed of two bands i.e., positive and negative bands.
- The representation of these bands on a trading chart is different.
Best settings
A user can adjust the settings of this indicator according to his own choices and experience. You can change the color of the bands to your choice. The input of this indicator is also changeable. You can keep the inputs according to your personal choice and trading experience.
The length of the Starc bands indicator is 15. you can also change it because it is based on the average true range.
| Function | Value |
|---|---|
| Length | 15 |
Trading strategy
You know the working of this indicator; now is the time to formulate a trading strategy around this indicator. There are two sentiments in a trading market, i.e., bullish and bearish. These bands work with these two sentiments so that we will form separate trading strategies for each type of market.
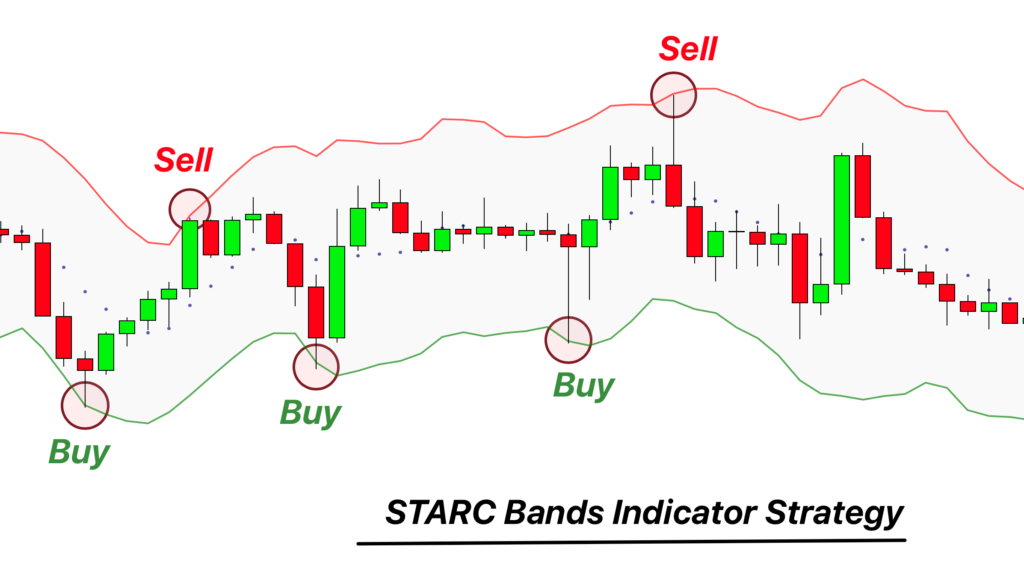
Bullish Entry and Exit
A bullish trading strategy revolves around the positive band of the STARC band indicator. When will reach the lower band or (starc -) then open a buy trade by analyzing any bullish candlestick pattern on the lower timeframe.
Bearish Entry and Exit
For the bearish entry, you should wait for the price to reach the upper band or Starc+ band. Then analyze the price on the lower timeframe and look for any bearish candlestick pattern. Then open a sell trade.
Risk management
In a bullish trade place, the stop loss is below the prior low point of the entry. On the other hand, place the stop above the prior high point of the entry-level in a bearish market.
Take profit
You can open two take-profit levels to profit significantly from a trading strategy around the STARC bands. partially close the trade at the middle band and then close the rest of the trade when the price touches the other opposite band.
Click here to get access to Starc Bands indicator
Success ratio
STARC bands are a significantly winning indicator. The price range stays between the positive and negative bands for more than 90% of the time. A proper formulation of trading strategy around this indicator can take your trading experience to a positive side.
Pros
- It gives information about the trends in the market.
- It can generate buy/sell signals.
- This indicator is capable of indicating a trend reversal.
- It helps formulate a separate trading strategy for a bullish and bearish market.
- It has a higher winning ratio.
Cons
- This indicator can generate false signals in a market.
- These bands are always in the moving form. So they might mislead at times.
- This indicator requires the confluence of other indicators for the formulation and execution of a trade.
Conclusion
STARC bands are a great way to formulate a trading strategy, but a 100% reliance on this indicator can hurt you. To succeed with this indicator, the phenomenon of stop loss is very important because of fast-moving bands. Properly using this indicator with the confluence of other indicators can enhance the success ratio.