
Definition
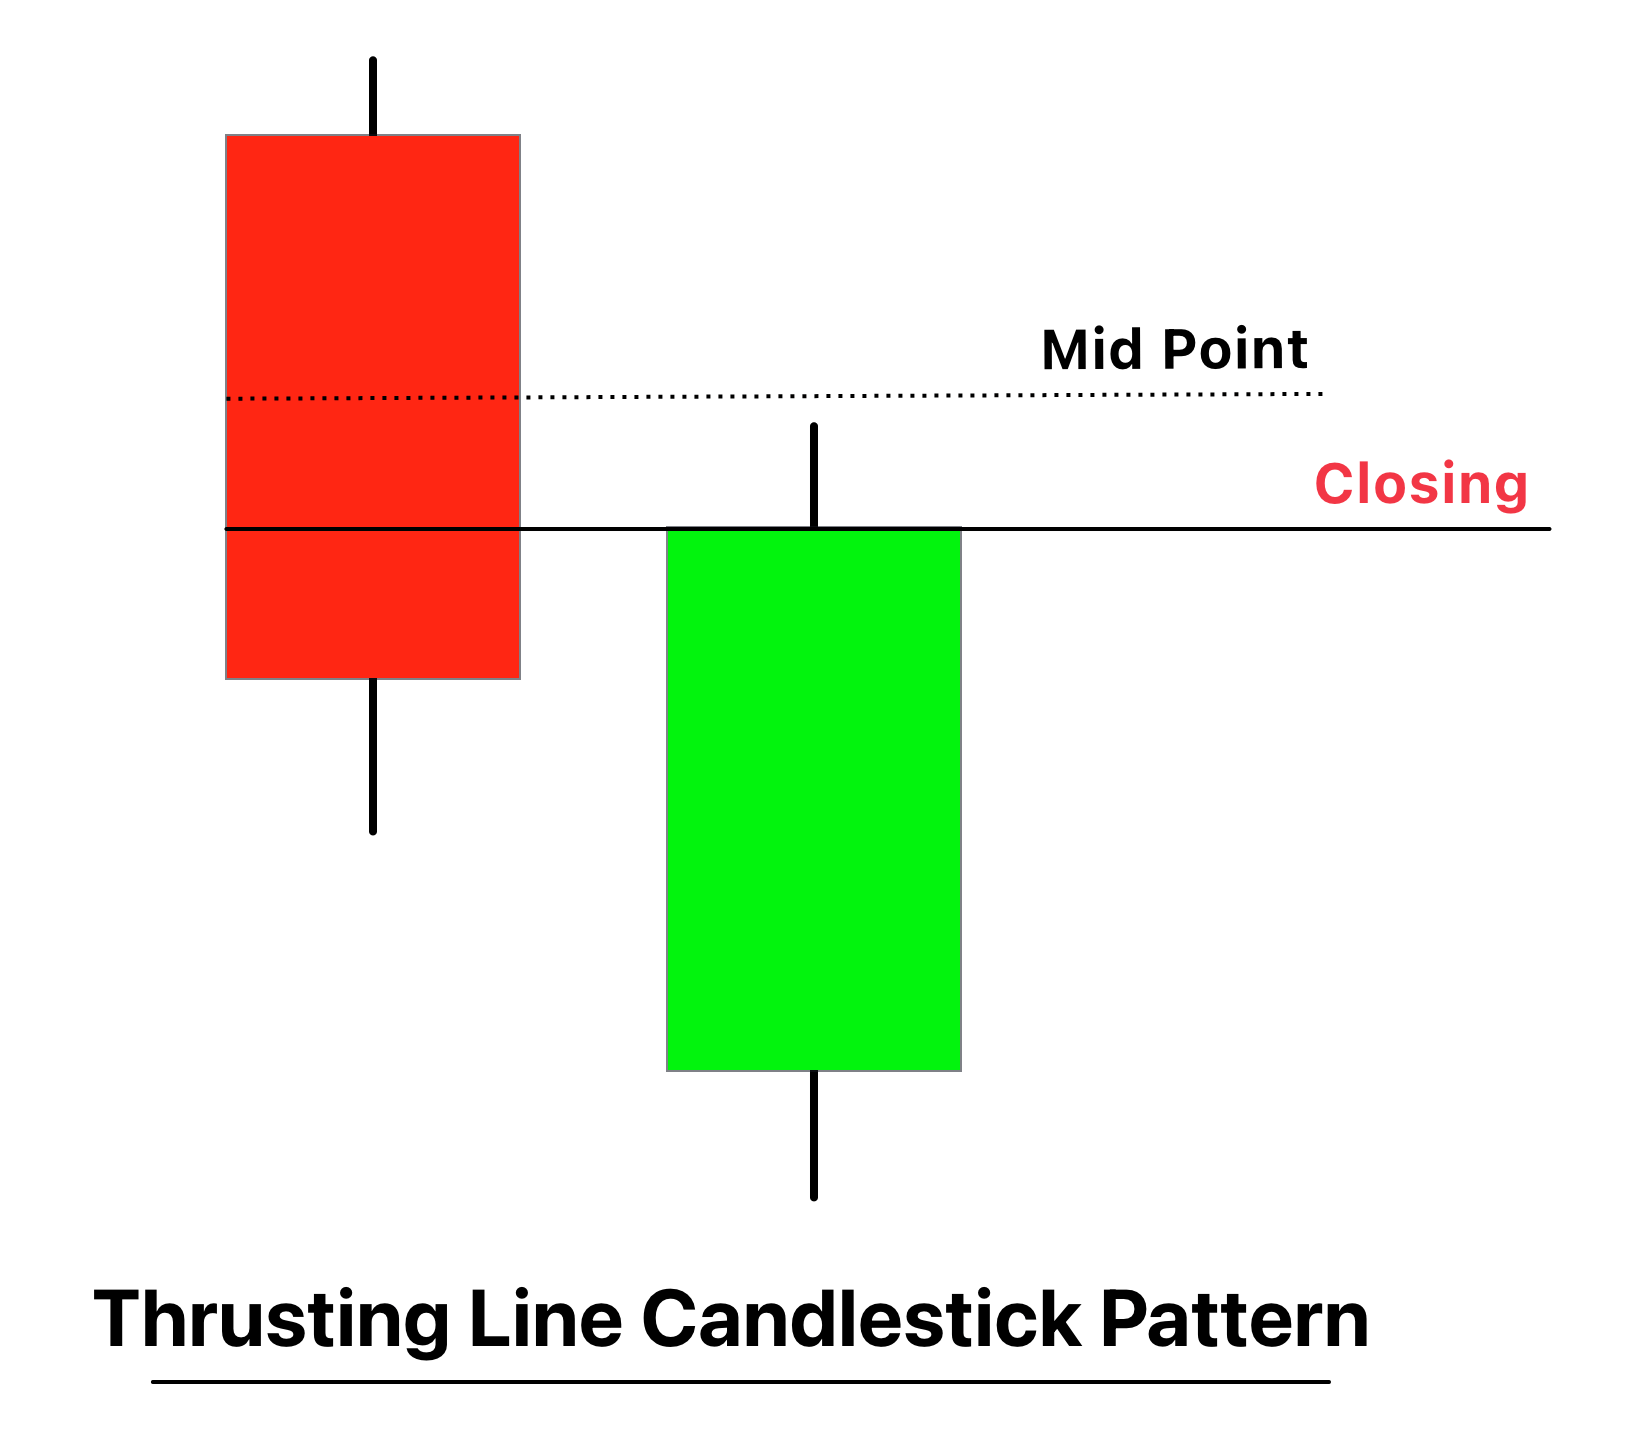
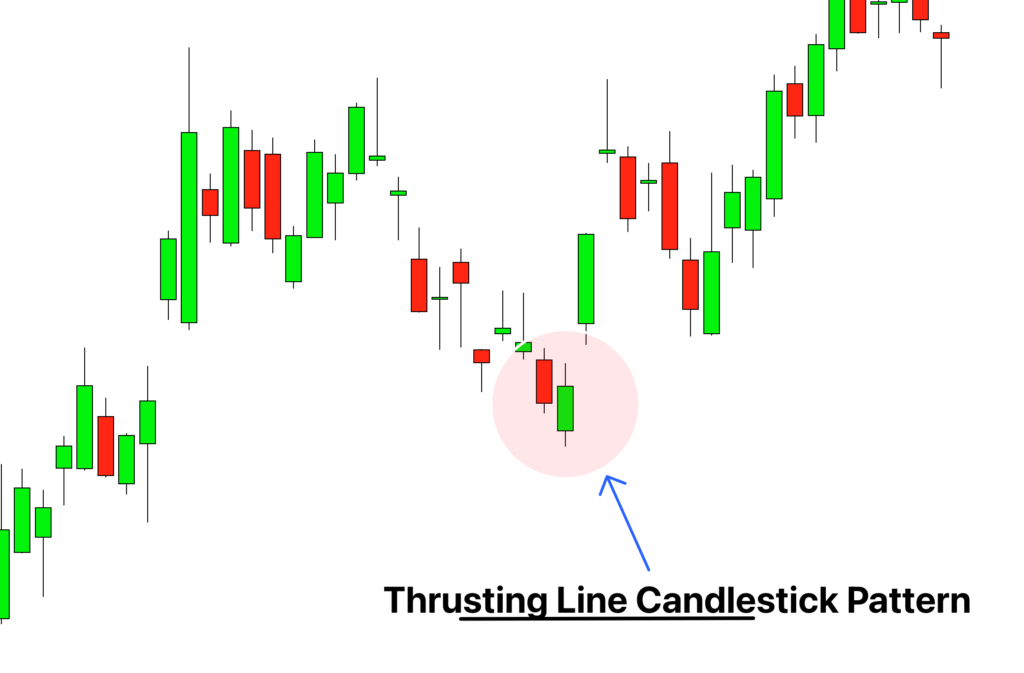
A thrusting line candlestick pattern is a bearish continuation or a bullish reversal pattern that combines one black and a white candlestick. In this pattern, a long bearish candle (black candle) is followed by a bullish candle.
It indicates that the trend may continue in a bearish way. However, in some cases, a thrusting candlestick pattern might refer to a bullish reversal trend.
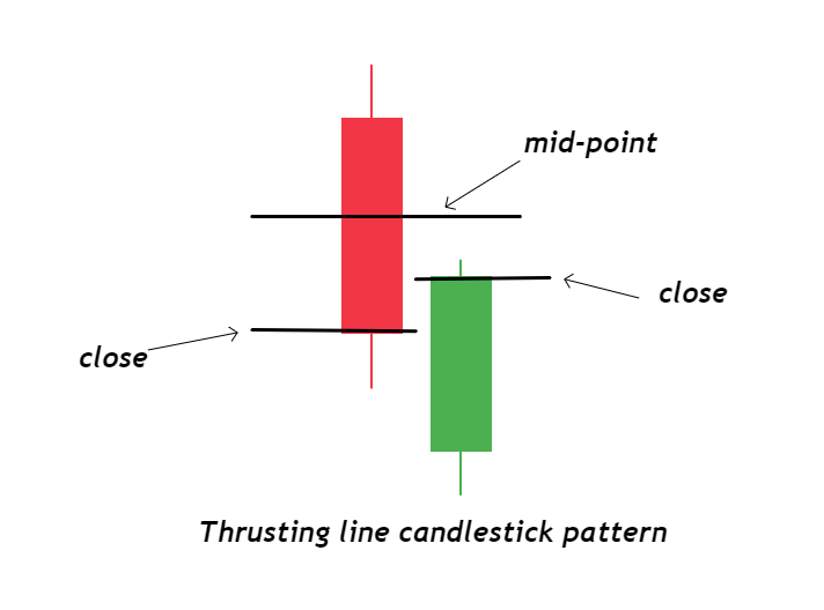
The white or bullish candle’s closing position is above the black candle. The close of the white candle is always lower than the mid position of the black candle.
How to identify a Thrusting line candlestick pattern?
It is composed of two candlesticks.
To identify this candlestick pattern, you must find a combination of a long black and white candle.
- In the first step, a long black candle will appear. A trader must be sure about the thrusting candlestick pattern at this stage.
- In the second step, a white candle will appear below the midpoint of the black candle. The close of the white candle is always above the close of the black candle.
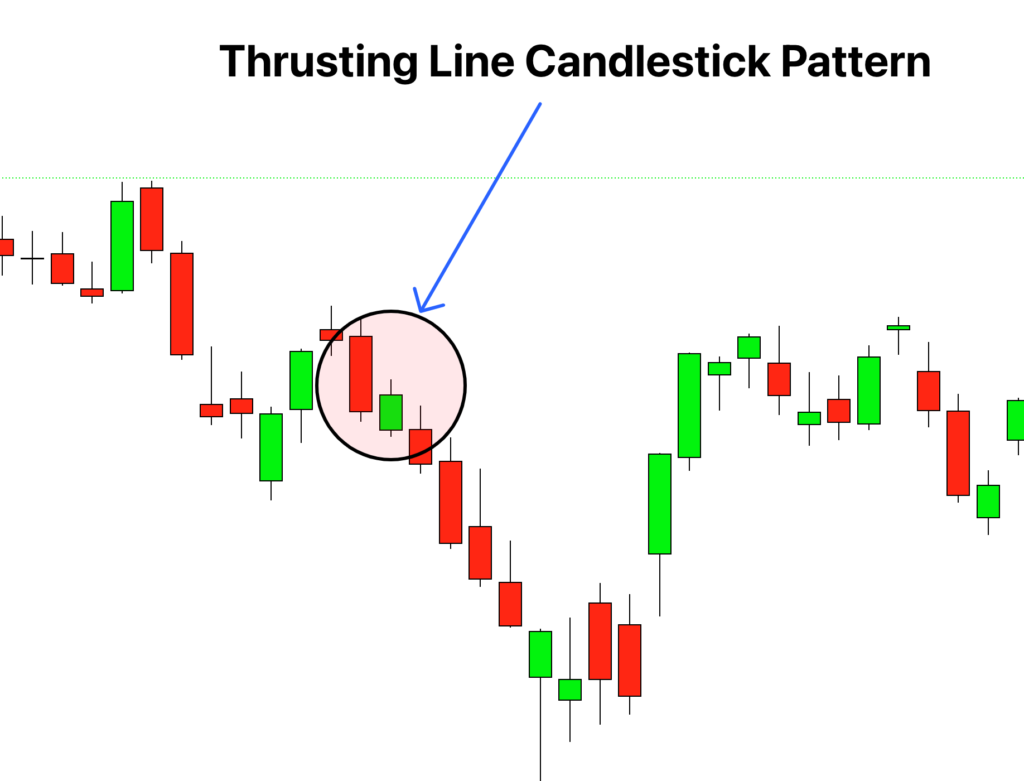
Such a combination on the chart will indicate that it is a thrusting line candlestick pattern.
| Features | Description |
|---|---|
| Number of candlesticks | Two The first one is a black candle The second one is a white candle |
| Prior Trend | If a thrusting candlestick pattern is a bearish continuation pattern, the prior trend will be a bearish one. If a thrusting candlestick pattern is a bullish reversal pattern the prior trend is still bearish in nature but in the future, it will be reversed in the favor of bulls. |
| Forecast | In most cases, the thrusting candlestick pattern is a bearish continuation pattern. So, the price will keep dropping. A dip in the price means the number of buyers will likely drop and short selling will take place. In some cases, the thrusting candlestick pattern shows a bullish reversal pattern. As the bulls are about to replace bears in the near future, the number of buyers will likely increase. |
| Candlestick Sequence | A thrusting candlestick pattern is the pattern of two candlesticks. The first candle in the sequence is a long black candle. The second candle is a bullish or white candle. The close of the second candle is always above the close of the first black candle but never equal or above the mid position. |
Mistakes to avoid while finding the Thrusting line pattern
A trader may observe some false signals. The thrusting line candlestick pattern can show a resemblance to the following candlestick patterns.
- On neck candlestick pattern
- Piercing candlestick pattern
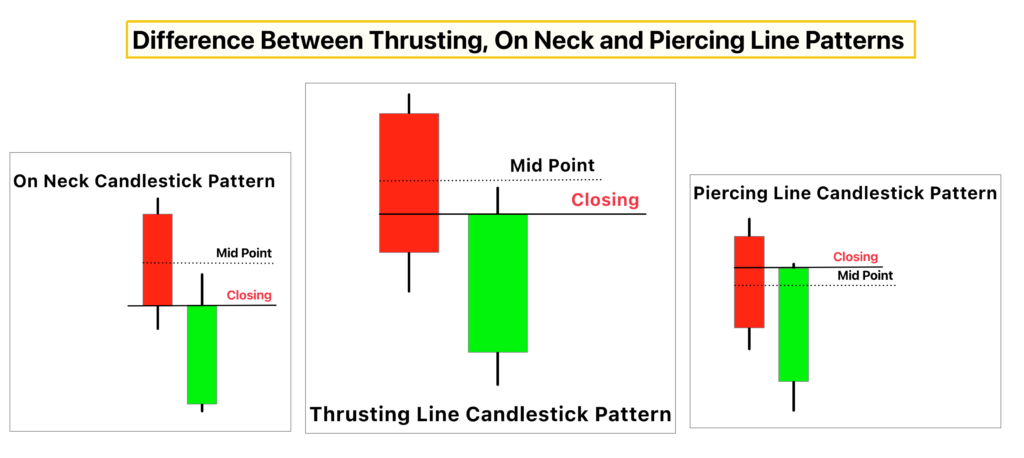
In an on-neck candlestick pattern, the bearish and bullish candles have the exact level of their respective close. In the case of the piercing candlestick pattern, the close of the white candle is positioned above the midline of the prior black candle.
The thrusting line candlestick pattern is unique as the close of the white candle is always positioned below the midline of the black candle. The close of the white candle is also always placed above the close of the first bearish candlestick.
A trader can identify a thrusting line pattern by positioning the white candle to avoid false signals.
The psychology behind the Thrusting Candlestick
The psychology behind the thrusting line candlestick pattern is explained in two steps.
Bearish continuation pattern
In the case of a bearish continuation pattern, you are well aware that the already dipped market will fall further down in terms of pricing. Generally, people tend to sell their assets in a bearish market to avoid further losses or profits. Short selling is expected as the black candles appear in a candlestick chart.
Long-term traders who follow a position trading style will likely hold their positions. They wait for the higher price to get a significant profit.
Bullish reversal pattern
Sometimes a thrusting line candlestick pattern shows a bullish reversal nature. It means soon; the bulls will replace the bears in a candlestick chart. The appearance of a bullish candlestick pattern implies the number of buyers will increase. As the bullish reversal nature appears in the chart, traders tend to buy assets. So, if this candlestick pattern exhibits bullish reversal, traders will likely buy assets soon.
Thrusting line candlestick trading strategy
The trading strategy involves the confluence of the resistance zone as it is a bearish continuation pattern or a bullish reversal pattern.
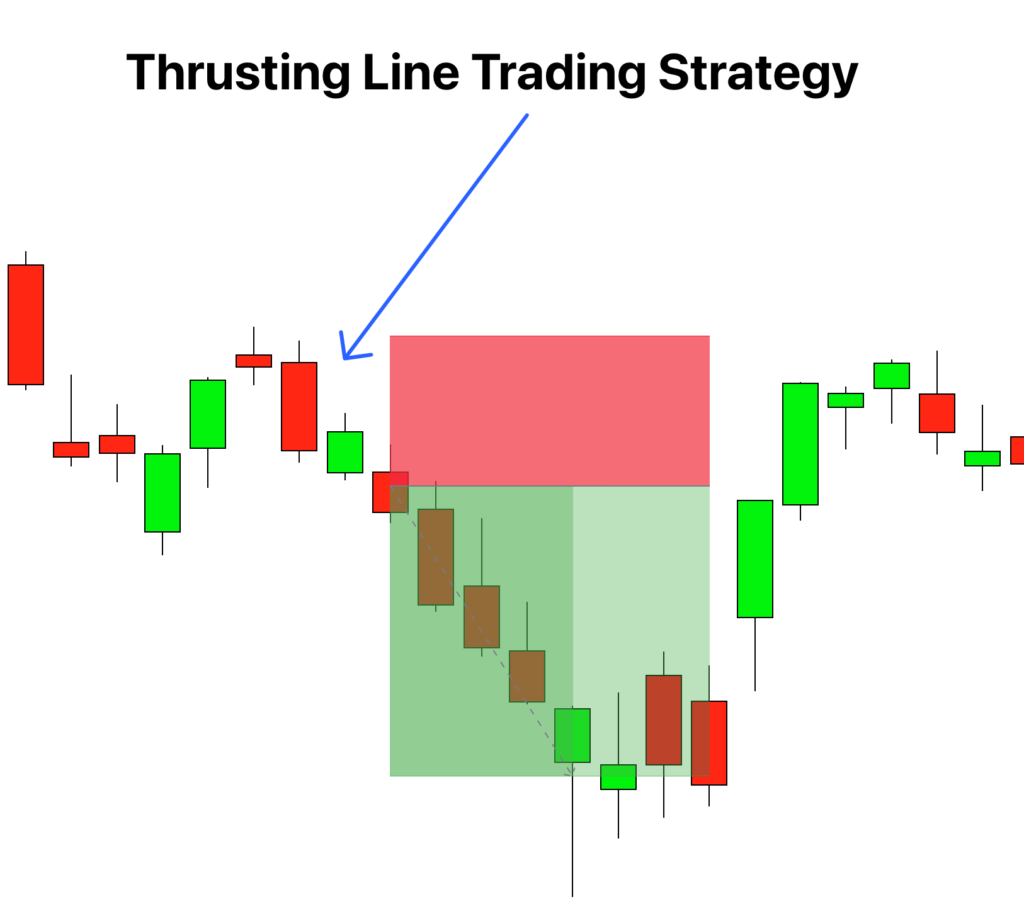
Entry
The price can go higher or lower as a thrusting line candlestick pattern can go either way, like flipping a coin. The trader will wait for the price to rise above the first candle’s high or dip below the low of the second candle. With a high price, a trader will take a long trade. On the other hand, a short trade is an option for a trader if the price shows a dip.
Stop loss
There are multiple choices for the placement of a stop loss. If the candlestick pattern exhibits a bearish continuation pattern, then place the stop loss at the pattern’s high or higher than the currently appearing candle.
If it signals a bullish reversal pattern, then place stoploss under the low of the candlestick pattern. or you can also place it under the low of the currently appearing candle.
Take profit
To take profit levels, kindly use the ATR trailing stop indicator. It will automatically close the trade when the price trend reverses.
Drawback
A thrusting line candlestick pattern is like a double-edged sword that can cut from any side. The price can move above in case of a bullish reversal pattern. The price can also drop if it is a bearish continuation pattern. That’s why i will not recommend to use this candlestick pattern alone.
The bottom line
A thrusting line candlestick pattern is either a bearish continuation or a bullish reversal pattern. It consists of a long black candle and a shorter white candle. It is easy to identify this candlestick pattern as the close of the white candle always appears above the close of its prior bearish candle.