Definition
The chart patterns that indicate a continuation of the bearish trend in the financial market are the bearish continuation patterns.
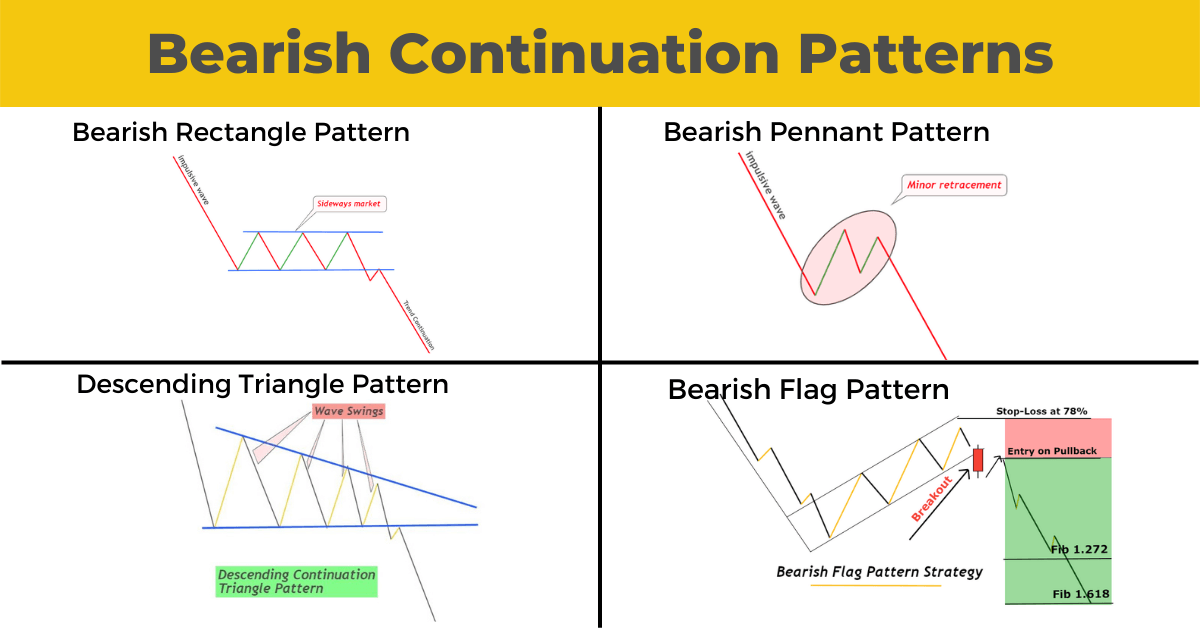
There are four major types of bearish continuation patterns that retail traders use in technical analysis. They find these patterns on the candlestick chart of different financial markets and forecast the bearish trend.
The best thing to learn about these continuation patterns is that these patterns forecast only with the trend. They don’t forecast the price against the trend. That’s why the winning probability of trend continuation patterns is always slightly more significant than the trend reversal patterns.
Types of bearish continuation patterns
Bearish continuation patterns include:
- Bearish pennant pattern
- Bearish flag pattern
- Descending triangle pattern
- Bearish rectangle pattern
These four patterns give only a sell signal. You’ll always open a sell trade after the formation of these patterns. Or you can also keep your sell trade open after forming bearish continuation patterns to gain more profit.
How do we identify the bearish continuation patterns?
You must learn to identify the repeated price patterns to find the high probability chart patterns. I have explained the structure of each price pattern. However, you can also learn in full detail by clicking the learn more button at the end of each pattern.
Bearish pennant pattern
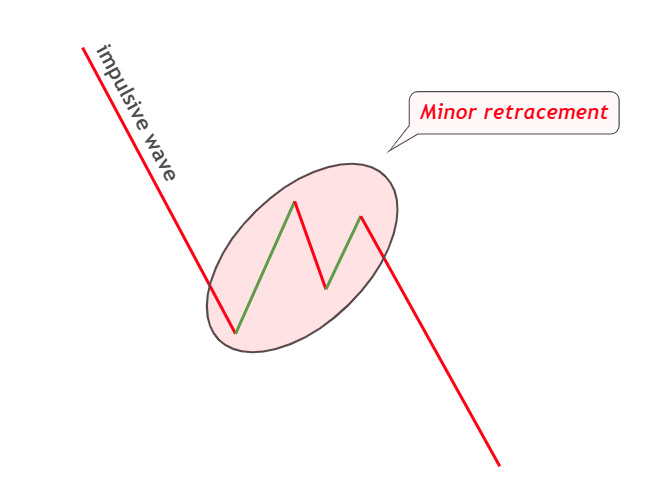
When a minor retracement forms after a big bearish impulsive wave, it is a bearish pennant pattern, as shown in the image below.
There are three to four small waves within the minor retracement. And each successive wave will be smaller in size. After forming three to four waves, the price will break the structure in the downward direction, and a bearish trend will start.
The bearish impulsive wave should have a strong trend of sellers and look like a pole of a flag. At the same time, the minor retracement will act as a small flag at the end of the pole. This is the simple price structure behind the bearish pennant pattern.
Descending triangle pattern
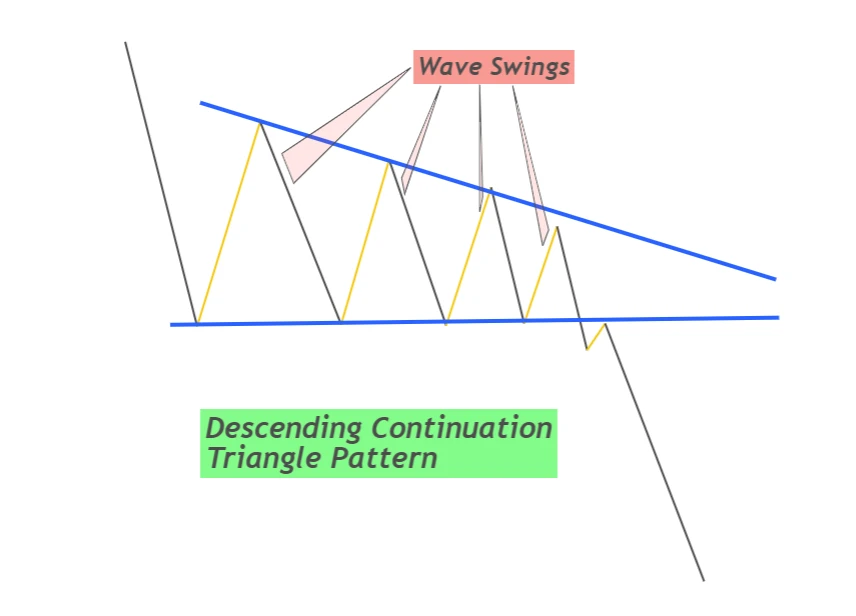
The descending triangle pattern is a price structure that resembles the path of a ball bouncing on the floor with a decrease in momentum on each bounce.
Here floor will act as a support zone, and the path of the ball will act as price waves. In this pattern, the price will bounce from a support zone, and each successive bounce will be smaller than the previous bounce. Look at the image below for a better understanding of this chart pattern.
The first price wave will be the largest wave then smaller waves will form. After forming three to five waves, the price will break the support zone, and a bearish trend will start.
Descending triangle pattern is a strong indication of bearish trend continuation, and it is the most straightforward and widely used pattern in technical analysis in trading.
Bearish flag pattern
To some extent, the bearish flag pattern has a concept similar to the bearish pennant pattern. The major difference is in the size of the flag.
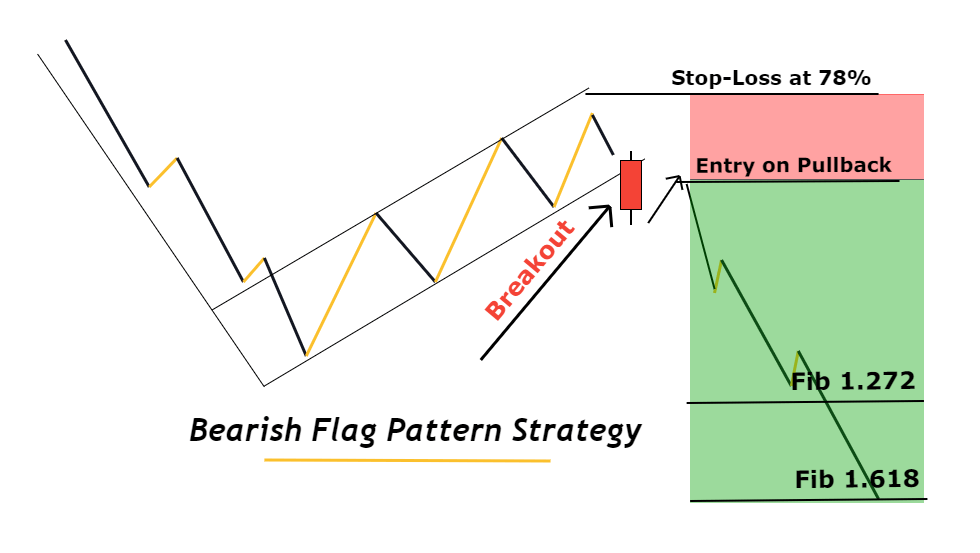
A minor retracement forms in case of a bearish pennant pattern, while a large retracement will form in case of a bearish flag pattern.
A flag has two components, a pole and a flag. The pole represents the bearish impulsive wave, while the flag shows the bullish retracement. In this pattern, the retracement will form within a bullish channel. When the price breaks the channel, then a bearish trend will start.
You must check three things for the identification of bearish flag patterns.
- Bearish impulsive wave (pole)
- Bullish retracement wave within price channel (Flag)
- Breakout of the price channel
After finding these three price patterns, you are ready to open a sell order.
Bearish rectangle pattern
A rectangle pattern in trading is a symbol of a sideways/consolidation market structure. But if a consolidation forms after the end of a bearish trend and breaks in a bearish direction, it is also a symbol of a bearish trend continuation.
Look at the image below to understand the price structure.
In the first phase, you will see a bearish trend or formation of lower lows and lower highs. Then in the second phase, a sideways price structure will form like a rectangle. The price will break the rectangle in the third and last phases, and a new bearish trend will form.
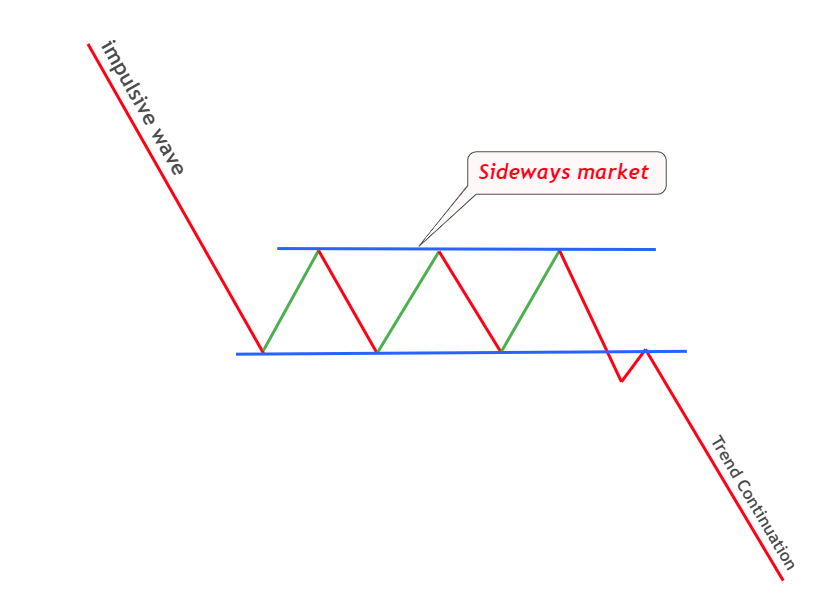
Keep in mind that the rectangle pattern must break in the downward direction. If it breaks in the upward direction, then it will act as a trend reversal pattern.
Conclusion
If you learn these four patterns, you can only become a profitable trader by adding risk management. You don’t need to learn many chart patterns but a few patterns only. Simplicity is the key to success in trading. If you make a complex trading strategy, trading psychology will overcome you, and you will lose.
So make things simple and start trading by following rules.


