
Price rejection refers to the phenomenon in which price tests and validates a support or resistance level in technical analysis. The wicks or shadows of candlesticks show the price rejection on the chart. It is a trend reversal pattern.
In technical analysis, traders widely use the concept of price rejection to determine the strength and weakness of a particular support or resistance level. Because it is difficult to determine the strength of a zone or trend line, but after the price rejection, it becomes easy to determine that a trend reversal is about to happen in the market.
I will explain the price rejection on candlestick charts in detail in this article, so read the full article.
How to find the price rejection on the chart?
Before understanding the price rejection, you must know about the wick or shadow of the candlestick.
Upper wick
The upper shadow shows that the price went up and then came down again. It also indicates that buyers want to increase the price, but many sell orders from big institutions and banks decreased the price.
Lower wick
The lower shadow represents that price went down and then again came back. It also indicates that sellers must be more vital to decrease prices. Many buy orders are preventing the sellers from decreasing the price, that’s why lower wick forms.
Identify the price rejection.
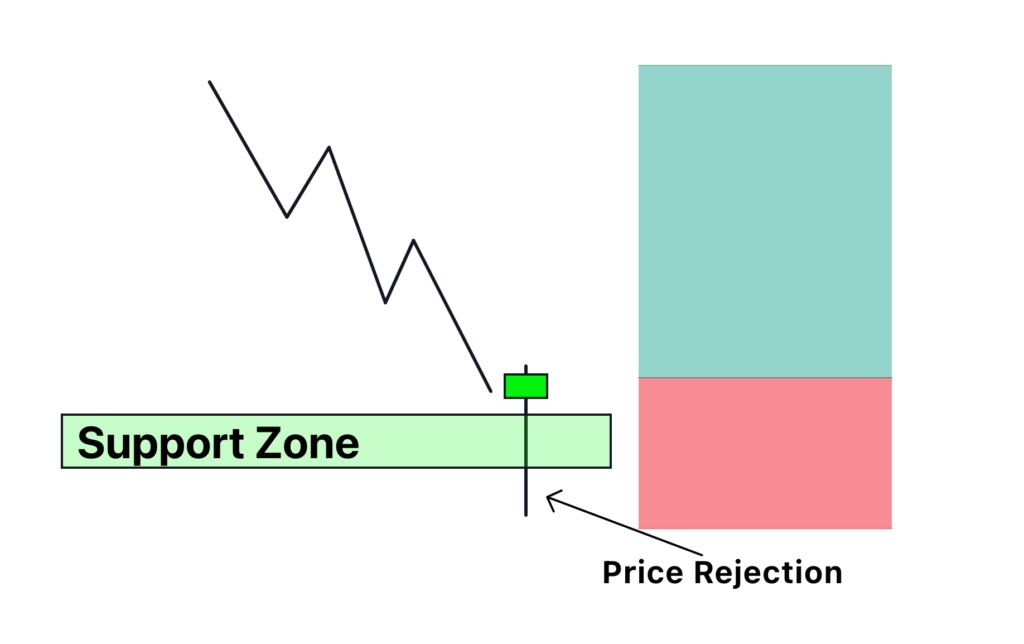
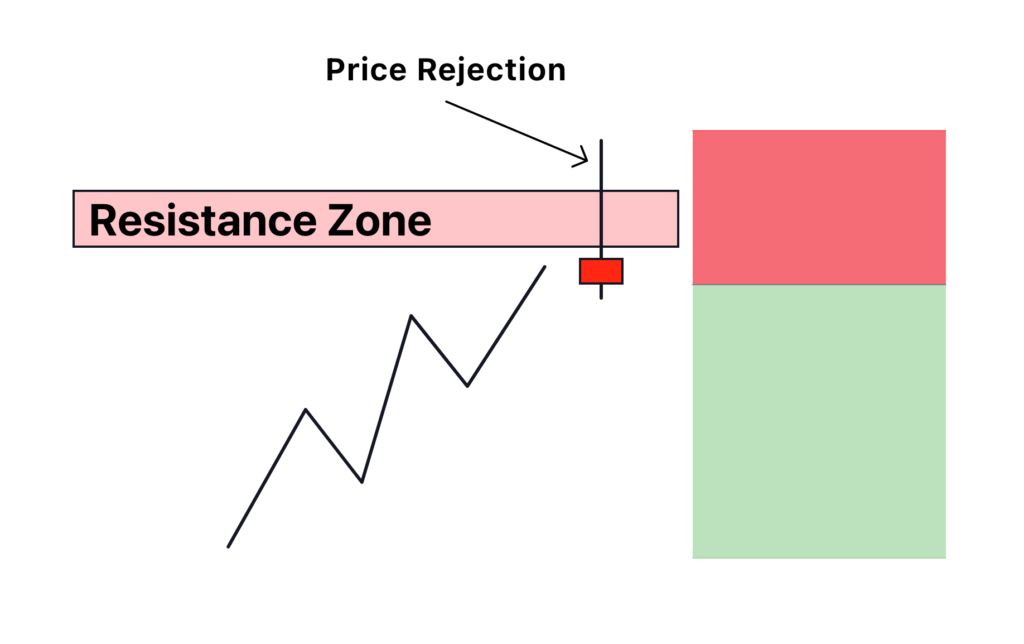
- First, wait for the price to reach a strong support or resistance level.
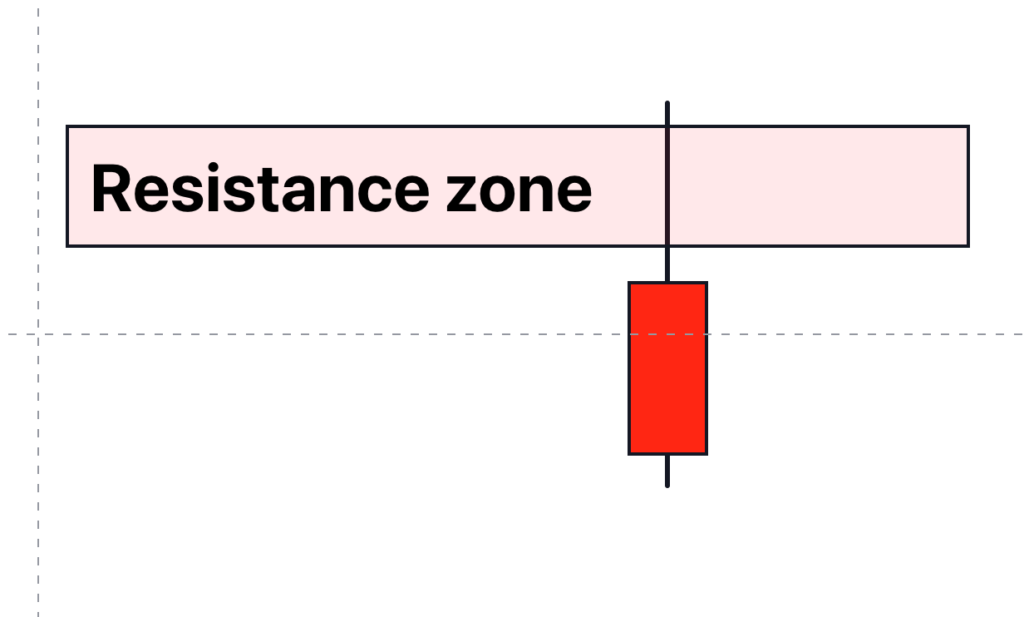
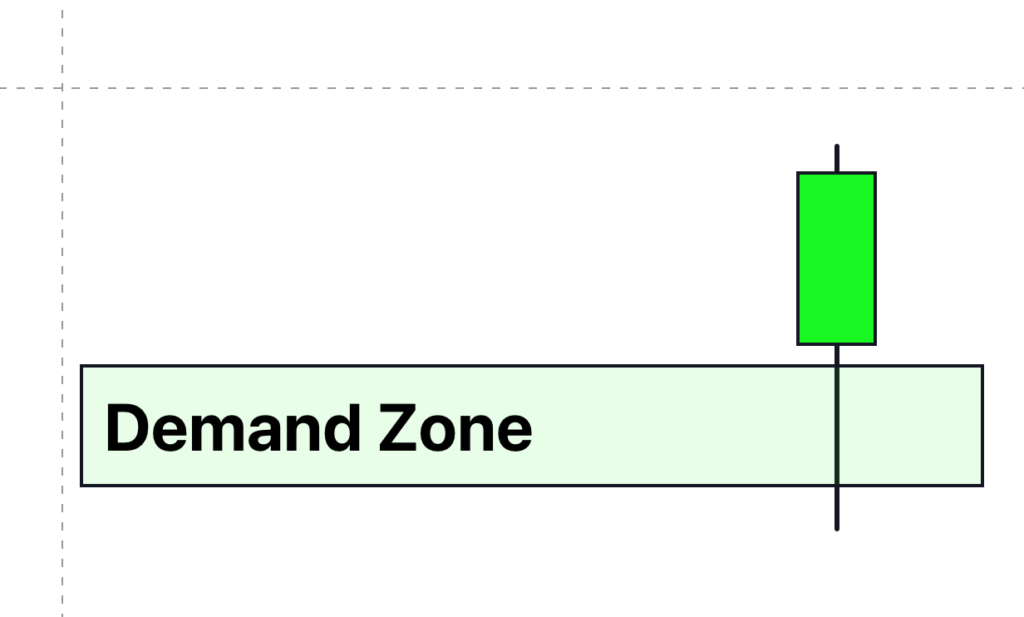
- At the support or resistance level, candlesticks will make large wicks opposite the trend. For example, wicks or shadows will form on the upper side at the resistance zone, while at the support zone, wicks or shadows will form on the lower side of the candlesticks.
- These wicks or shadows act as price rejections in forex trading.
Significance
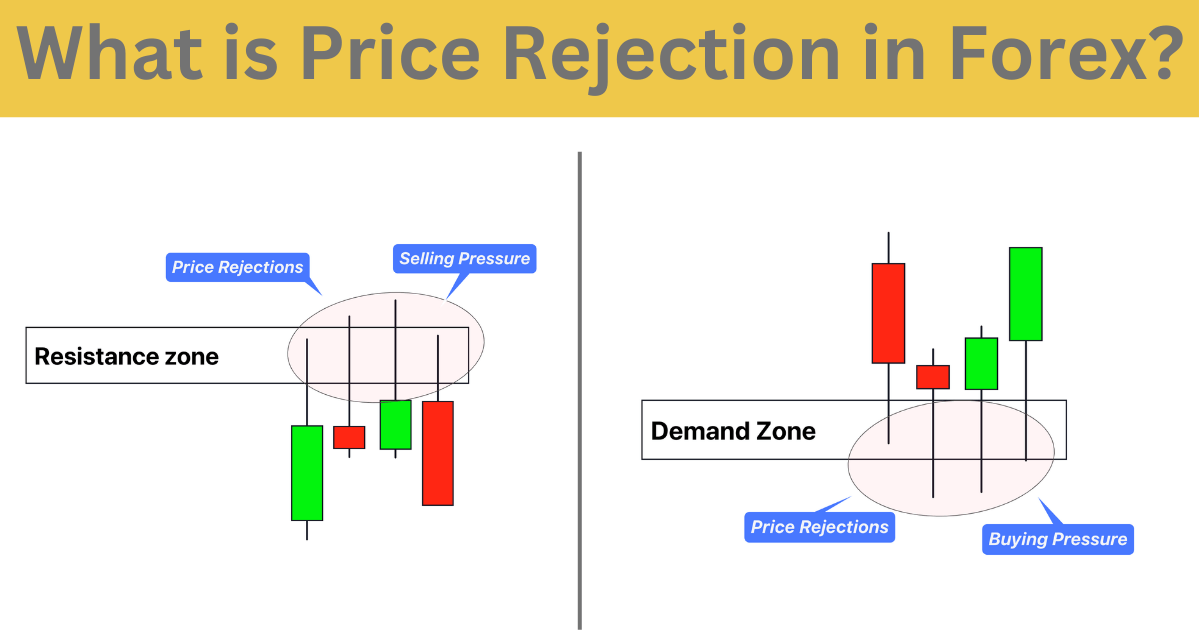
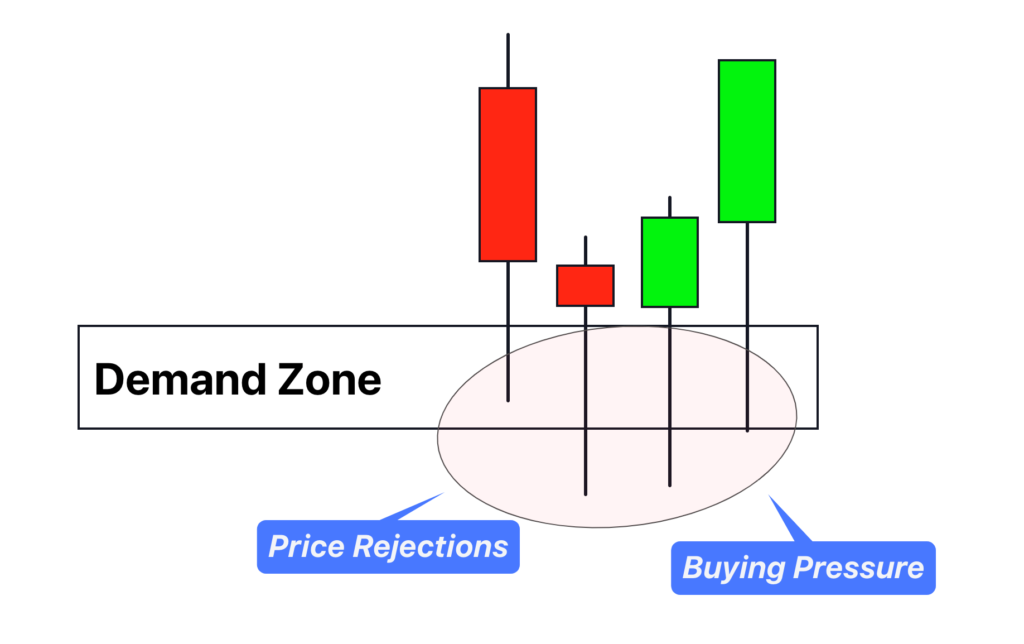
The price rejection at a particularly crucial level represents the buying and selling pressure.
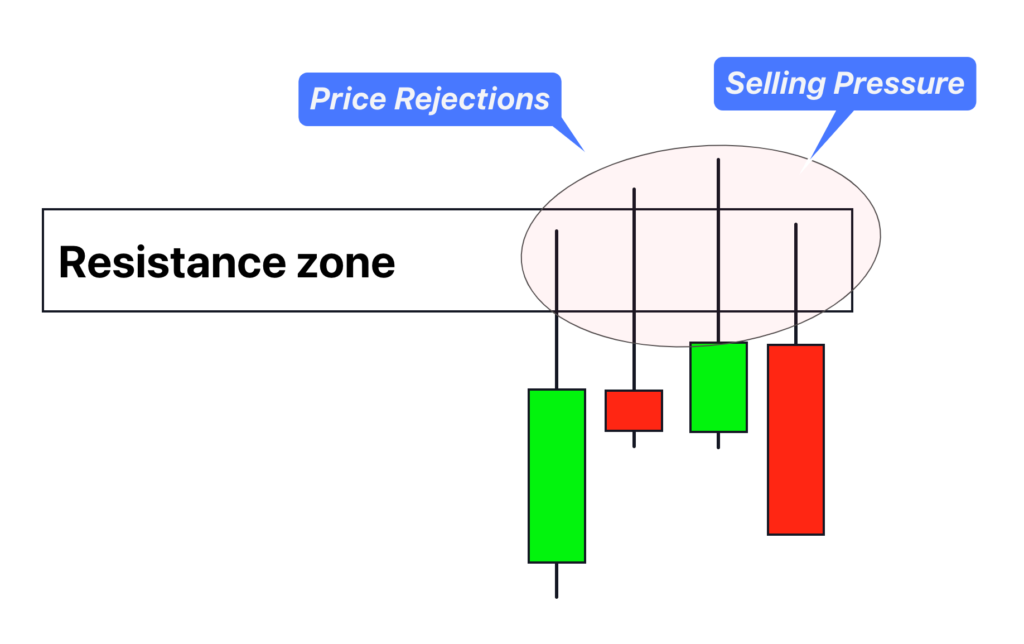
If the rejections form on the upper side of candlesticks, then it means there is much selling pressure in the market.
While if the rejections form on the lower side of candlesticks, then it means there is a huge buying pressure in the market
What does the price rejection tell retail traders?
It confirms the validation of a support or resistance level. For example, if you are unsure whether a support zone will be valid, then you can use the price rejection to confirm it.
Because price rejection shows that market makers want to reverse the trend, but with a false breakout, false breakout traps the retail traders. After trapping retail traders, the institutional traders place their orders, and a trend reversal occurs. This false breakout is a rejection of the level.
For example, if a price rejection occurs at the support zone, there are many pending buy orders below the support level, and the price has tested that level to confirm those buy orders. If the buy orders exceed the sell orders, the price will come back and close inside the support level after the breakout. This step confirms that buyers are stronger, and a trend reversal will happen from the support zone.
How to trade the price rejection pattern in forex?
There are many ways to trade with price rejections. It includes
- Support and resistance
- Key levels
- Candlestick patterns
The pin bar is one of the most critical candlestick patterns that help find the rejection. The pin bar candlestick’s big upper and lower wick shows a strong price rejection. That’s why when a bullish pin bar forms at a support or critical level, it is a buy signal. On the other hand, if a bearish pin bar forms on the resistance zone or key level, then it is a sell signal.
In the same way, it works in trading. The perfect and small example is the pin bar with a long rejection that acts as a tail of the pin bar. If many rejections form, the buy or sell pressure increases.
The bottom line
Price rejection is one of my favorite parameters in technical analysis to determine the strength and validation of a price level or zone. I will also recommend that all traders learn this because it will help them accurately forecast the market.
If you’re a beginner, you can start analysing the rejection from the pin bar candlestick pattern.
Before trading on a live account, backtest this price pattern.