
Introduction
An Accumulative swing index indicator is a technical trendline indicator that indicates a long-term trend in a market and a potential trend reversal.
The developer of this indicator is Welles Wilder. It is an upgrade to the swing index. This indicator is equally effective in stocks, forex, and crypto trading. ASI provides a decent picture of the price swing in a market that helps a trader to make informed decisions. Furthermore, this indicator can indicate a trend reversal in a trading market.
Purpose of using ASI indicator
This indicator can fulfill the basic objectives that an indicator can offer. The main objectives of ASI are,
- To indicate a long-term trend.
- To provide information about the price swing.
- To generate buy/sell signals.
- To indicate a trend reversal.
Significance
ASI is a powerful yet very simple and user-friendly indicator that can improve your decision-making. It can help you in both short and long trades. The luxury this indicator provides you is as follows.
- ASI can identify a long-term trend which can help you to see a clear picture of the market.
- This indicator identifies the trend reversal that can help you to make better decisions in terms of entry and exit in a trading session.
- It can generate buy/sell signals.
- It gives you information about the strength of price swings in a volatile market.
- It gives information about the overbought and oversold phenomenon of an asset.
The Mathematical formula
The calculations for ASI are as follows.
ASI = previous ASi + current SI
SI = swing index
To calculate the swing index (SI), we can use the following formula.
SI = 50 x ❴C -Cy+0.5 x (C-O) + 0.25 x (Cy-Oy) ❵ / R
C = current close price
Cy= prior close price
O = recent open price
Oy = prior open price
R = the highest range
Working of ASI
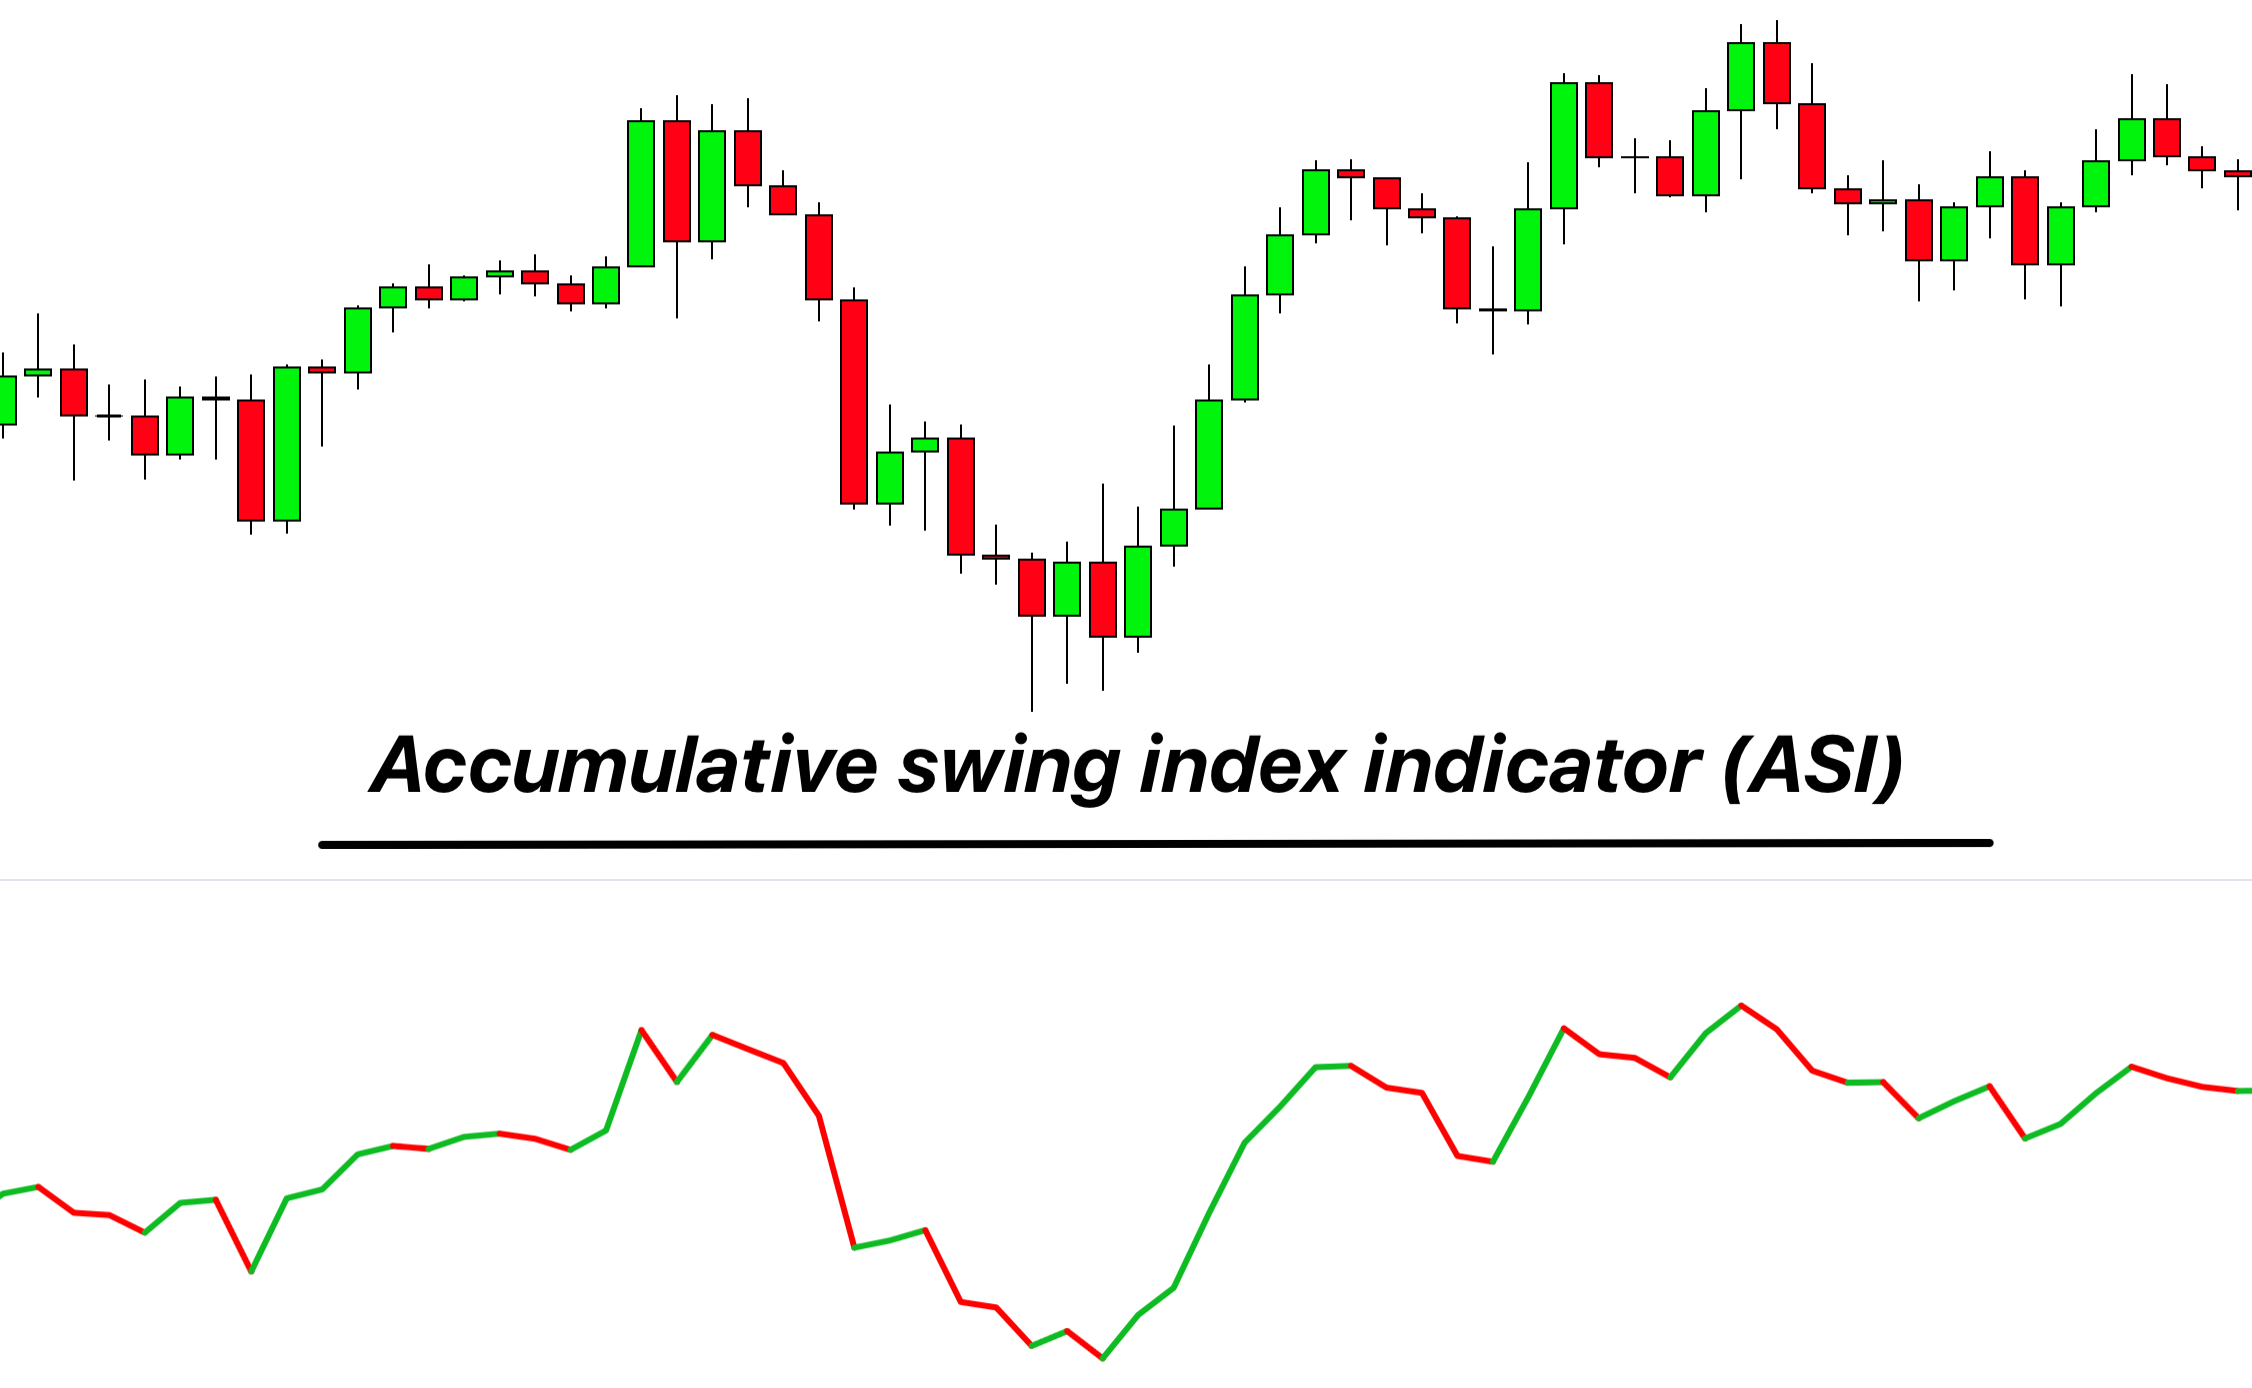
Accumulative swing index indicator is very easy to eyes and understand on a trading chart. It forms a trend line that displays below the candlestick chart. This trendline is of two colors. A user can change these colors according to his choice. We prefer to use green and red colors for the ASI trendline.
The green color shows a bullish sentiment, while the red color shows the control of bears in a trading market.
ASI as a trend indicator
As the trendline displays the green/red color and the ASI value is high. It indicates a strong trend. The green color with a high ASI value is a strong bullish trend. The trend is strongly bearish if the trendline is red and the ASI value is high.
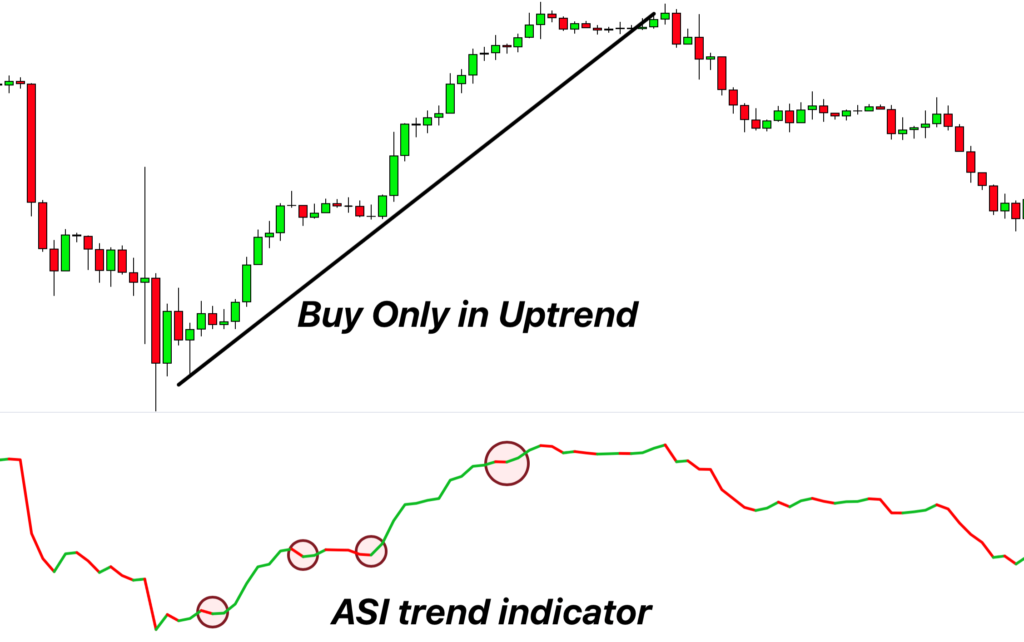
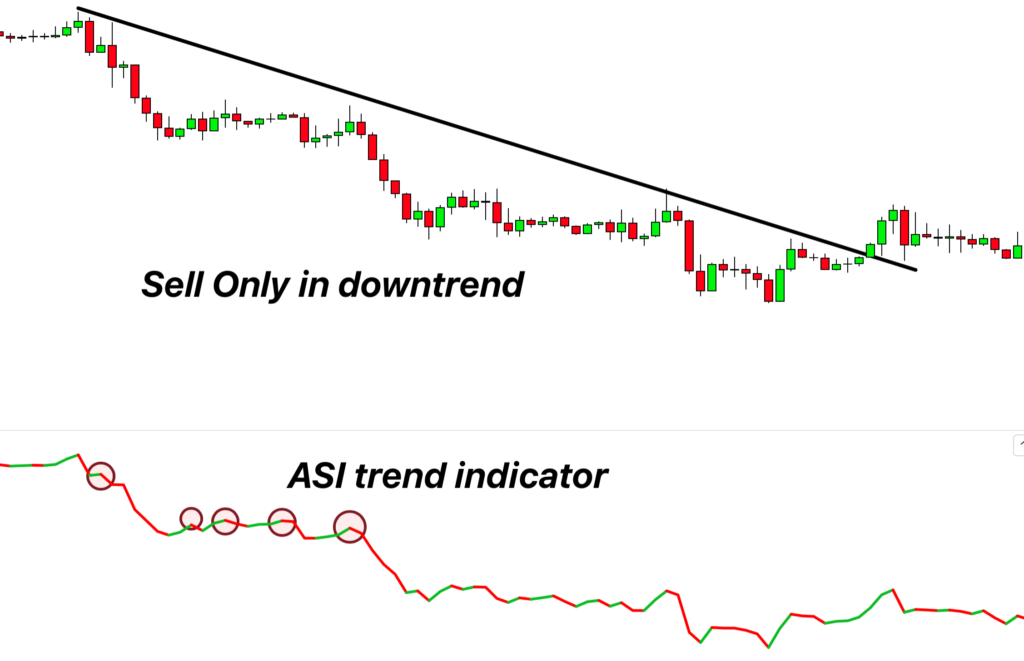
ASI as a trend reversal
The smaller ASI values represent a shorter and weaker trend. It may mean that the market is about to take a reversal. The color change of the ASI trendline also indicates a trend reversal. If the color changes from green to red, it means the market is about to take a bearish reversal. On the other hand, as the bulls begin to gain power, the color of the ASI trendline turns green.
Best settings
A user has the luxury to change the ASI setting according to his personal choice and trading experience. A user can change the color of the trendline if he wishes to.
ASI uses the limit move value for its input. You can change it according to your trading experience and set goals.
Accumulative swing index indicator Trading Strategy
The trading strategy with ASI uses the trendline color and ASI value. We can formulate a good trading strategy with the help of this indicator in the following steps.
Entry and Exit
ASI is well equipped to indicate a strong trend and trend reversals. Keep an eye on the ASI value. When the ASI value is bigger and the trendline is green, it is a good time to buy an asset. When the color change from green to red. It indicates an upcoming bearish reversal, and it is time to sell your asset and exit your trade.
The same principle applies to a bearish trade antagonistically regarding trendline color.
Tip: you should use the dynamic trend line or moving averages to determine the trend and use ASI indicator to only open or close trade with the trend. For example, only open buy trades in a bullish trend while only open sell trades in a bearish trend.
Risk management
Risk management is an essential part of any trade. There is not a single trading indicator that can guarantee you a 100% success rate. So, it is vital to manage your risks. When you are forming a trading strategy with ASI, place your stop loss level to significant swing lows and highs.
Take profit
To make a profit and increase the potential of a high-profit margin, use an Accumulative swing index in conjunction with the moving average.
You can also close the trade once the color will change. for example, if the color changes from green to red, then close the buy trades and vice versa.
Click here to get access to ASI indicator
Success ratio
ASI is a good indicator as it involves a complete set of calculations and a decent way of representation on a trading chart. The success ratio of this indicator is on the winning side, but total reliance on ASI can sometimes ruin your trading experience. The confluence of this indicator with RSI, moving averages, or support/resistance zone can take the success ratio higher than 70-90%.
| Pros | Cons |
|---|---|
| It can identify a trend strength. | ASI can generate false signals in choppy market. |
| It can indicate a trend reversal. | The over-divergence of the prices in a market can affect the working of ASI. |
| It generates the buy and sell signals. | This indicator requires using other technical trading tools for proper reliance. |
| ASI can help you to form a trading strategy. | |
| It gives an idea about the price of an asset. | |
| This indicator can inform you about price swings. |
Conclusion
An accumulative index indicator is a decent technical trading tool that helps you to identify long-term trends and reversals. You can form a trading strategy around this indicator. The proper confluence of ASI with RSI and moving averages can impact your trading experience in a positive way.