
The Best exit indicator is a technical indicator that helps traders to determine the most profitable level to close the trade in financial markets. it is also known as take profit level indicator
Forex trading involves buying and selling. The success of a trader is based on two crucial aspects. The first is when to enter a trade, and the second is when to exit a trade.
In this blog, I will highpoint the importance of exit strategy and the best possible indicators to find the exit points in a trade.
Importance of accurate exit in trading
A proper exit point in trading can directly affect your profits and trading experience. The importance of appropriate exit points is mentioned below.
Effect on profit levels
A good, technically analyzed exit point can increase your profit by many folds. Some premature exits from the market can significantly affect your profit levels. Trading is all about finding a trend correctly and then taking maximum advantage of the trend. New or emotional traders exit the trade once they begin to see things in their favor. On the other hand, seasoned and mature traders wait for the appropriate exit points to get the maximum profit from a trade.
Minimize the loss
The identification of suitable exit points in a trading session helps you to minimize your losses. You cant find a trader on this planet who hasn’t suffered in the forex market. A good trader minimizes his losses by exiting the trade as soon as things start to become messy.
Protect the profits
Traders often suffer a situation where they make a good profit. Once the trend begins to reverse, the profit levels significantly drop. In this situation, a trader has two options. The first option is to exit the market to protect your profits. The second option is to hold your position and wait for the reverse in the case of a long trade. An intelligent trader finds an excellent exit to protect his profits once the market is facing a reversal.
So, the exit from a trade is as important as the entry into a trade.
How to identify Exit points?
There are several ways a trader can use to develop an exit strategy. Some of the common ways to find an exit point are given below.
- Chart patterns
- Candlestick patterns
- Trading indicators
In this blog, we primarily focus on using trading indicators to formulate an exit strategy.
Chart patterns
A trading chart and its ups, downs, and moving trends themselves create signals for the entry and exit points. Chart patterns are a basic and straightforward way to find an exit point in a trading strategy.
The most common chart patterns are
- Double Top and bottom chart patterns
- Head and shoulders,
- Rising and Falling wedge chart patterns.
These chart patterns signal a continuation or reversal trend of the market in the near future. It helps a trader to formulate his trading strategy.
Candlestick patterns
Technical traders focus more on the candlestick patterns as they provide a better success ratio. These candlestick patterns indicate a bullish or bearish reversal in the market. Some candlestick patterns also indicate a continuation pattern of the market. A trader can benefit from these candlestick patterns to formulate his exit strategy.
Some of candlestick patterns examples include
- Doji candlestick patterns,
- Pin bars,
- Ladder top
- Hikkake pattern etc
Trading indicators
Trading indicators are important tools in the modern forex world. Technical traders are consistently using trading indicators to formulate their trading strategies.
These indicators provide unique information about the market trends to determine the entry and exit points.
We will discuss three important exit indicators that help a trader improve his trading strategy.
- Moving averages
- Bollinger bands
- Relative strength index (RSI)
These indicators help a trader find the proper exit points to experience a better trading lifestyle by maximizing the chances of profits.
List of the best exit indicators
We can’t determine a single trading indicator that provides us with complete information with 100% accuracy. Every indicator is unique in itself, with different pros and cons. Some indicators calculate moving averages, while others may use complex mathematical formulas. Different indicators facilitate in different ways under different situations.
Here is the list of top exit indicators:
- Fair Value Gap Indicator
- Psychological Indicator
- Moving Average
- MACD indicator
- Bollinger Bands
- RSI indicator
Now I will explain each indicator in detail.
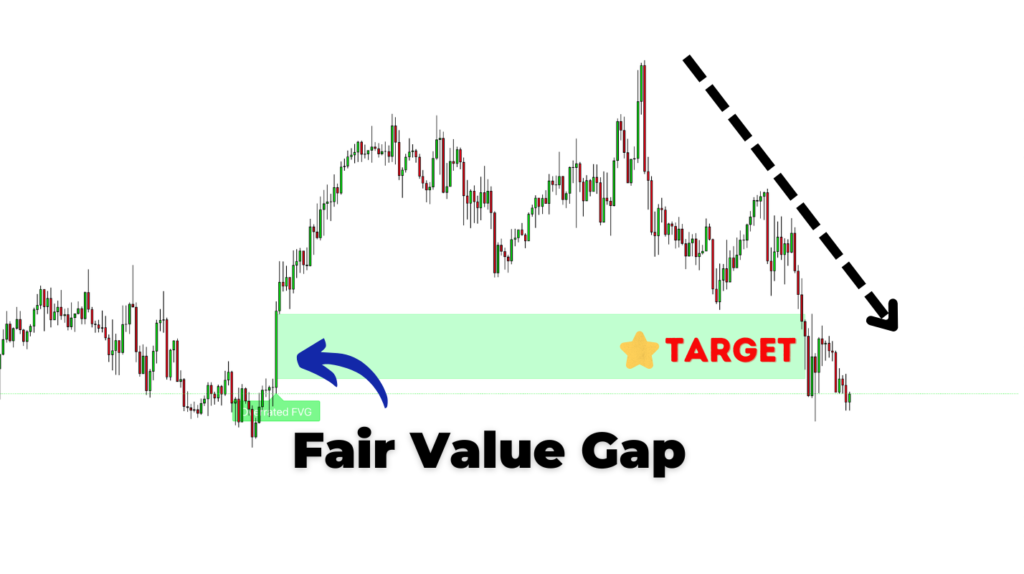
1. Fair value gap indicator
The FVG indicator is the best exit indicator and I also use it personally. The beauty of the fair value gap is that it is based on price action and natural phenomena.
There are two types of fair value gaps on the chart.
- Undervalued fair value gap
- Overvalued fair value gap
This indicator finds these gaps in the price chart and draws the zones. These zones act as a magnet and they attract the price. Price always returns to the zone to fill the gap.
That’s why we can use these zones as trade exit price levels. For example, the price is overvalued and it will decrease in the future. then we can close the sell trade at the overvalued zone.
2. Psychological indicator
The Psychological indicator helps traders to find the best exit point in trading by using the Renko charts and average true range.
It is very simple and effective to use. even a beginner trader can use it accurately. it is made up of bricks of red and green colors.
- Close the sell trade when the color will change from red to green.
- Close the buy trade when the color will change from green to red.

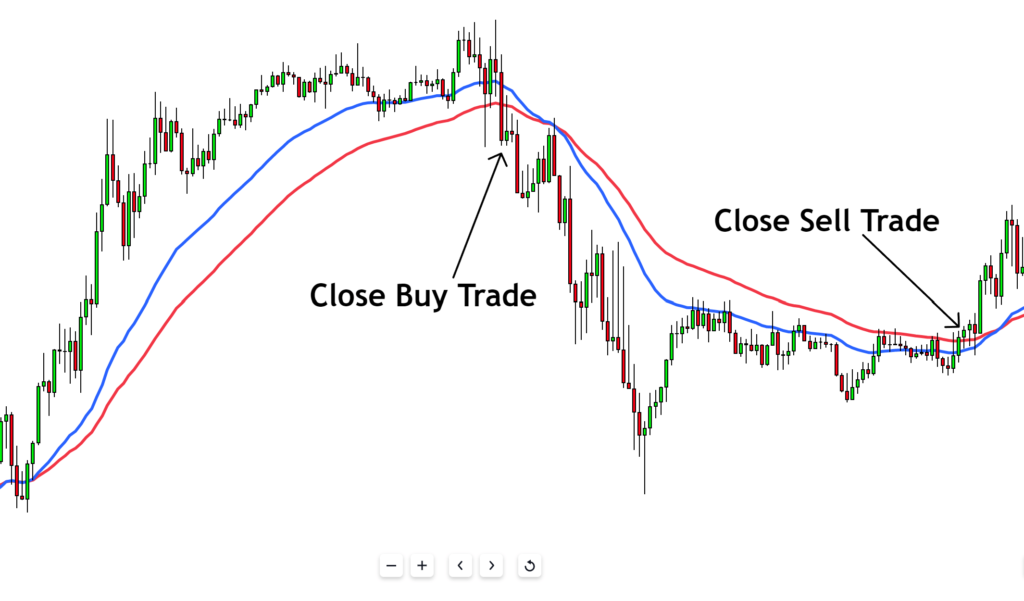
3. Moving Averages
It is a basic and simple indicator that calculates the average prices over time to provide information. There are some advanced types of moving average indicators that are given below.
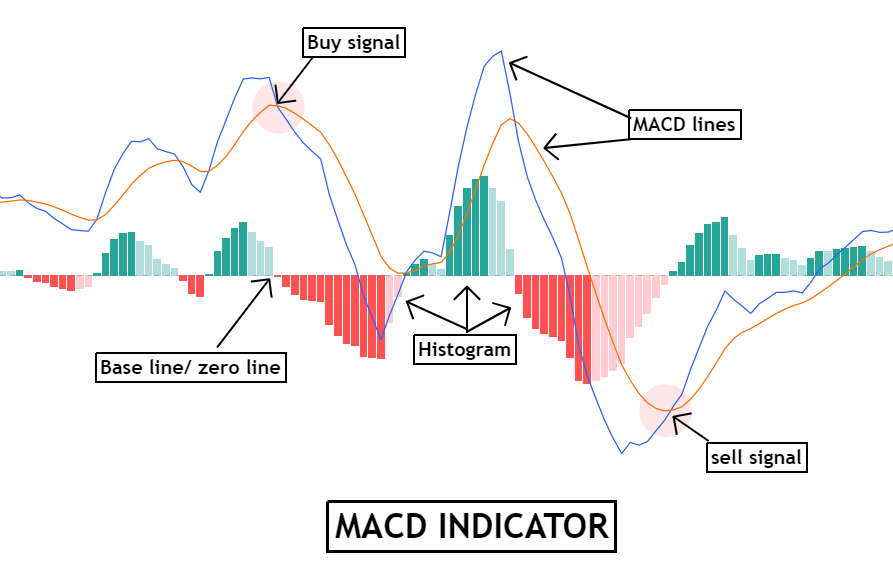
4. MACD
The complete form of MACD is “moving average convergence divergence.” It is derived from the moving averages as it also calculates moving averages. As its name suggests, it deals with convergence and divergence with respect to moving averages.
The essential components of a MACD indicator are
- MACD lines,
- Zero line,
- Histogram.
How MACD works?
MACD forms the MACD lines with the help of a relationship between two exponential moving averages of the price of an asset.
The formula of MACD
MACD = 12 Period EMA – 26 Period EMA
*EMA stands for exponential moving averages
MACD is displayed with a histogram. The zero line is the central and pivotal line. It is also called a baseline. If the MACD lines move above the baseline, it indicates a bullish market sentiment. It indicates a buying signal. On the other hand, if MACD lines move below the baseline. It suggests a bearish trend in the market. Once a bearish trend displays, a trader can form his exit strategy.
Pros
- It is simple to use.
- It helps in determining the bullish and bearish trends.
- It provides information about the trend change.
- It generates technical signals.
- It helps a trader in forming an exit strategy.
- It provides information about bullish and bearish divergences.
Cons
- It can sometimes lag.
- Lagging can lead to miss opportunities.
- It can create false signals.
There is an advanced form of MACD, which is known as MACD 4C. The MACD 4C indicator uses four lines to make things more convenient and easy to understand. 
5. Bollinger bands
A forex trader often faces volatility in the market because of rapid business, which involves overbought and oversold phenomena.
In a volatile market, a trader can use Bollinger bands to formulate his exit strategy.
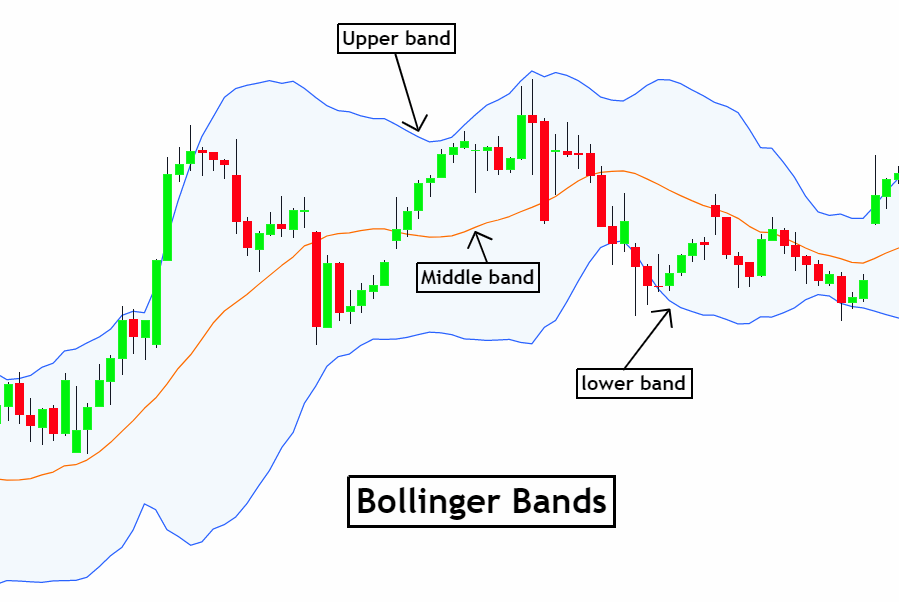
A Bollinger band is composed of,
- Middle band
- Upper band
- Lower band
How do Bollinger Bands work?
The formulation of the Bollinger Band involves complex mathematical formulas. The good news is it is very easy to use while forming a trading strategy.
As mentioned above, a Bollinger band is composed of three bands. The middle band is its anchor, which represents the moving averages. An upper band is formed above the middle band, while a lower band is below the middle band.
As the price of an asset reaches the upper band, it indicates that the asset is facing a bullish trend. It is called overbought. As the price touches the lower band, it signals the oversold behavior of the market.
A trade can formulate a good trading strategy in a volatile market with the help of a Bollinger Band indicator.
Pros
- It is an easy to eyes indicator.
- It identifies a volatile market.
- It can signal both overbought and oversold behaviors of the market.
- It is a user-friendly indicator.
Cons
- Some price actions might occur above or below the bands. There is a 10% probability of the price actions which don’t occur between the Bollinger bands.
- It can often create false signals.
- Bollinger Band usually requires other technical tools to work in a better way.
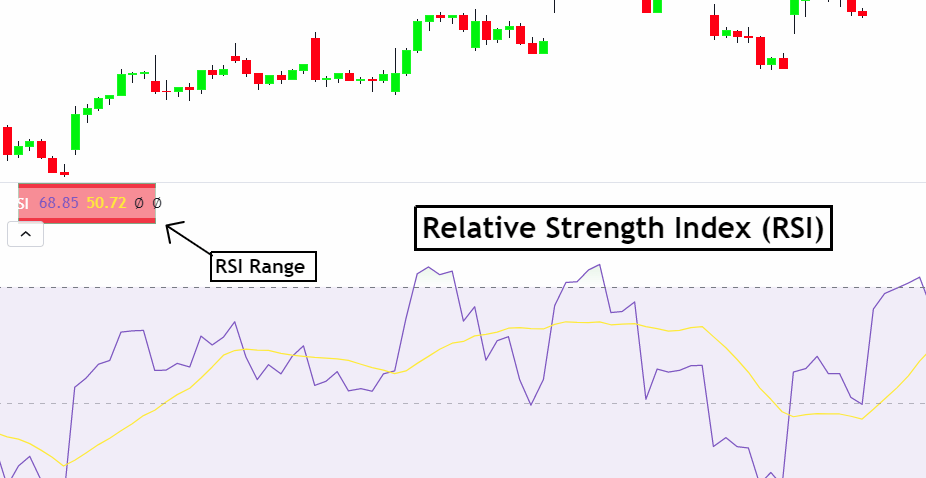
6. Relative strength index (RSI)
An integral part of any trading is to value an asset at the right price. The over and undervaluation of an asset can result in significant losses. To overcome this situation to form an exit strategy, I recommend you use the RSI indicator.
It is an oscillator that measures the speed and magnitude of the recent price change of an asset to determine the overvalued or undervalued situations in a market. It can also indicate a trend reversal in a market.
How does the relative strength index work?
RSI compares the high prices of assets on the days when the prices are above. On the other hand, it compares the asset prices when the prices are down. By comparing these prices, RSI provides the necessary information to a trader about the value of an asset.
This indicator actually makes a simple trader a well-informed trader.
The calculation of RSI involves complex mathematical formulas. The good news is this complex calculator is plotted on a trading chart with the help of numbers ranging from 0 to 100.
By reading these numbers, a trader gets the necessary information about the market. If the reading is below 30, it is an oversold signal. While the reading above 70 is an overbought condition.
Pros
- It is easy to use.
- It is a very user-friendly indicator.
- It indicates the valuation of an indicator.
- It can generate buy and sell signals.
- It provides information about the behavior of the price.
Cons
- It is less effective in short-term trends.
- It may provide false signals in case of a reversal in the market.
- It is not effective in a trading range.
RSI, with the combination of other trading tools, can totally change your trading experience to formulate a trading strategy.
The Final Verdict
The exit indicator trading strategy is directly proportional to the overall profits and trading experiences.
i will highly recommend the fair value gap exit indicator to intermediate and advanced traders. if you are beginner then i will recommend the psychological and MACD exit indicator.
An in-time exit can generate maximum profits, while pre-mature or delayed exits can significantly affect your trading experience.
A trader can use different technical analysis tools to formulate his/her trading strategy. Trading indicators can totally alter your trading experience by providing technical information.
The confluence or combination of different technical tools with trading indicators is used to formulate the best exit trading strategy.