
Definition
The Aroon Oscillator is a trend-following indicator that measures price changes and the trend’s strength in technical analysis.
Developed by Tushar Change in 1995, Aroon uses positive (Aroon up) and negative oscillators (Aroon down) to measure the highs and lows for a specific period.
As with most oscillators, Aroon oscillates between 0 and 100, where 50 acts as a midpoint.
Fun fact: Aroon means Dawn’s Early Light in Sanskrit. Tushar named it due to the oscillator’s potential to signal an upcoming trend.
Formula
The formula for the Aroon Oscillator is
Aroon-Up = 100 x (25 – Days Since 25-day High)/25
Aroon-Down = 100 x (25 – Days Since 25-day Low)/25
Aroon Oscillator = Aroon-Up – Aroon-Down
Calculations
To calculate the Aroon Oscillator, you need to follow certain steps.
First, you need to find out the Aroon up and down values. To calculate Aroon up, you should locate the 25-period high. After that, you need to subtract the values from 25, divide the overall values by 25 and multiply by 100.
To find the Aroon down oscillator, you need to find the 25-period low. After that, you need to subtract the result from 25, divide the overall values by 25 and multiply by 100.
It’s important to remember that a rating above 50 indicates that the price has reached a new high in the past 12.5 periods. Conversely, a rating below 50 means the price has reached a new low in the past 12.5 periods.
Best settings for the Aroon oscillator
The best settings for the indicator are
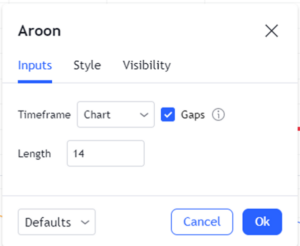
The default length is 14. You can use higher periods, and the oscillator will produce more reliable signals.
As with the other oscillators, you need to select a higher timeframe when applying the Aroon to lessen the false signals.
How to trade with the Aroon Oscillator?
There are two main ways to trade with the Aroon; locating the Aroon up and down and finding crossovers.
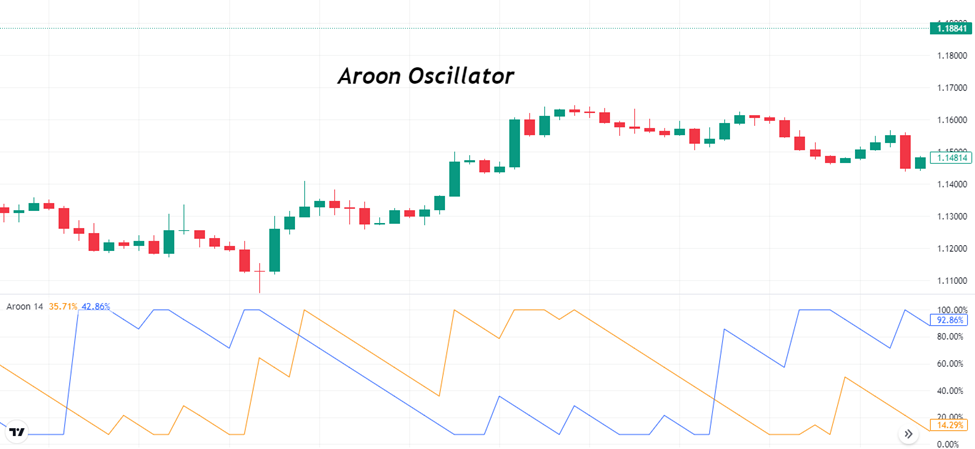
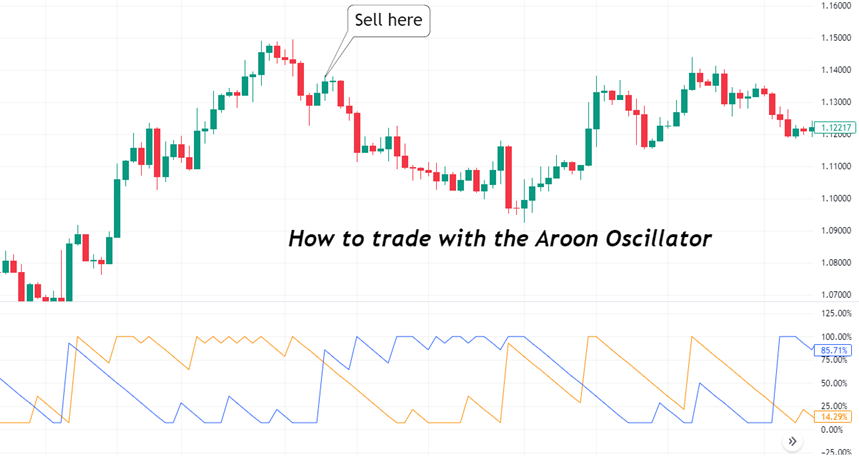
When the Aroon up goes above the 50 mark, it suggests a strong uptrend. On the other hand, when the Aroon down dips below 50, it marks a strong downtrend.
In the chart above, you can see when the orange line Aroon up goes above the 50 levels, it points to a bullish trend, whereas when the blue Arron down goes below the 50, it produces a bearish trend.
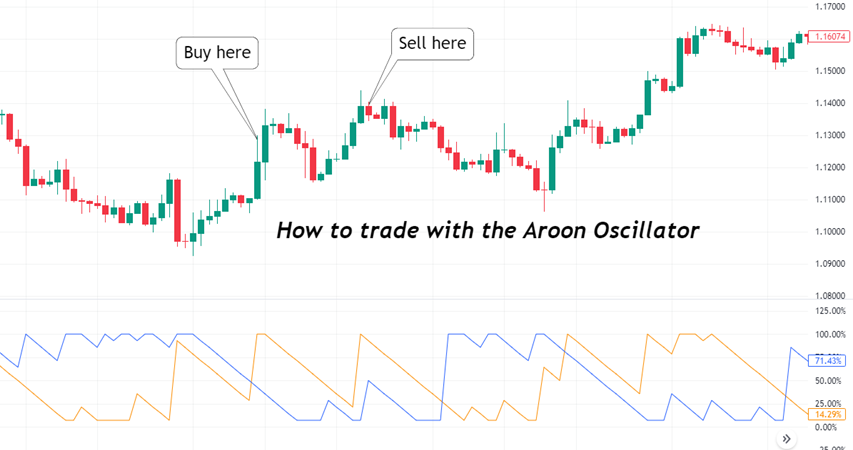
The other way to trade the Aroon is through crossovers. When the Aroon up crosses above the Aroon down, it signifies a bullish momentum. On the other hand, when the Aroon down crosses below the Aroon up, it’s a sign of a downtrend.
In the chart below, when the Aroon down crosses below the Aroon up, it gives us a potential short entry point.
It’s important to remember that when the Aroon up and down reach near their extreme, it’s a sign of a weak trend. For example, when the Aroon up reached near the zero level, it showed a weak uptrend. On the flip side, when the Aroon down reaches nearly 100, it shows a weak downtrend.
Also, when both Aroon up and down is below 50, it suggests price consolidation. It means you have to wait for either Aroon to take control and take your position.
Advantages of the Aroon Oscillator
- The indicator is relatively easy to understand.
- You can use the oscillator in multiple trading strategies.
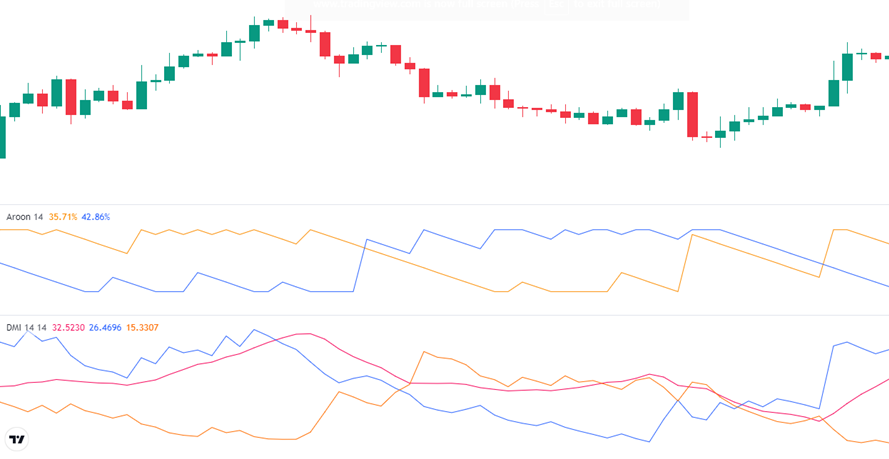
Aroon Oscillator vs. DMI
The DMI (Directional moving index) may look like the Aroon Oscillator. However, the difference lies in their calculations and the signal line.
The DMI plots a signal line along with the DMI+ and DMI-. The signal lines help in smoothing the positive and the negative DMIs. However, Arron doesn’t have a signal line.
The DMI calculates the difference between current highs/lows and the previous highs/lows. However, Aroon considers the previous periods only.
Summary
The Aroon oscillator combines the positive and the negative lines to identify the overall trend. It oscillates between 0 and 100, and 50 acts as a midpoint.
You can take trading positions by locating the Aroon up and down levels and the crossovers.
Although the indicator works fine on its own, you can use the Aroon along with others for further signal confirmation.