

Definition
The Bollinger band is a technical indicator used to forecast the market using the moving average and two standard deviation lines. Bollinger bands make it easy to find price reversal points on the chart.
It is a beginner-friendly indicator. The natural behavior of the Bollinger bands indicator makes it interesting, unlike other technical indicators.
In short form, the Bollinger bands indicator is denoted by BB’s indicator.
Who invented Bollinger bands?
Bollinger band tool was invented by a well-known trader John Bollinger. He has combined the natural phenomenon of the market and mathematical formulas to make the best technical indicator. This indicator has given a profitable edge to retail traders to analyze the market.
Nowadays, the Bollinger band is one of the famous technical indicators.
Essential components of Bollinger bands
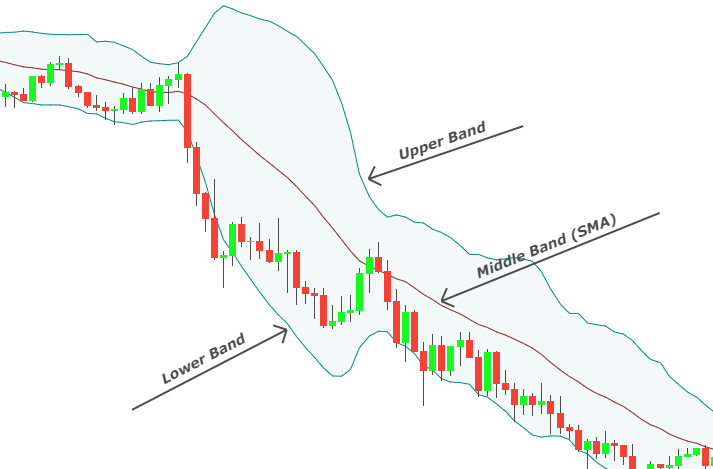
BB’s indicator has three major components:
- Middle Band: The middle line is a simple moving average with 20 periods.
- Lower Band: The lower band is a 2-standard deviation of the middle line, forming below the middle line.
- Upper Band: The upper band is a 2-standard deviation of the middle line from above the middle line.
What is the 2 standard deviation in the Bollinger band indicator?
Standard deviation is the dispersion of OHLC values from the mean value on the price chart. If the moving average line is at 1.12000 and the actual price is at 1.12500, then there is a high dispersion in the actual and moving average data.
You don’t need to understand it. Just take the simple concept by looking at the image below.
With 2 standard deviation, about 95% of price action happens within the two bands of this indicator.
Calculation of Bollinger bands indicator
There are two input values of the Bollinger bands indicator:
- Moving average period
- Standard deviation
By default, 20 period is used for moving average, and 2.0 is used for standard deviation.
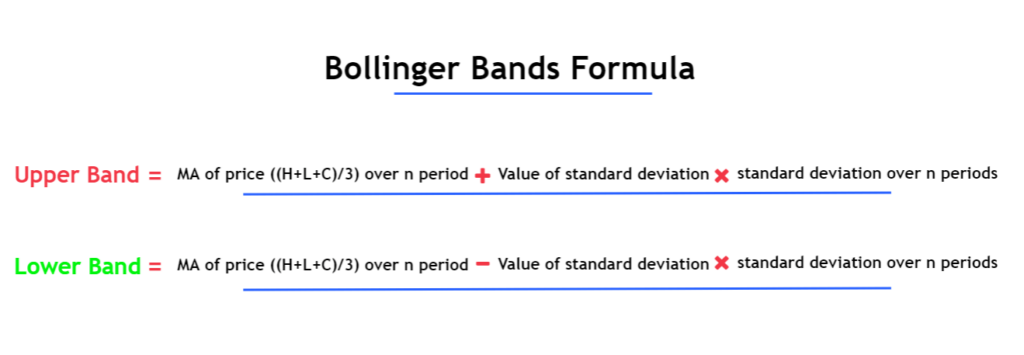
A mathematical formula is used for the upper and lower band.
If you want to learn about Bollinger bands’ settings, read this article.
Working of Bollinger bands
There are two principal phases of Bollinger bands:
- Squeezing phase
- Breakout phase
Squeezing phase
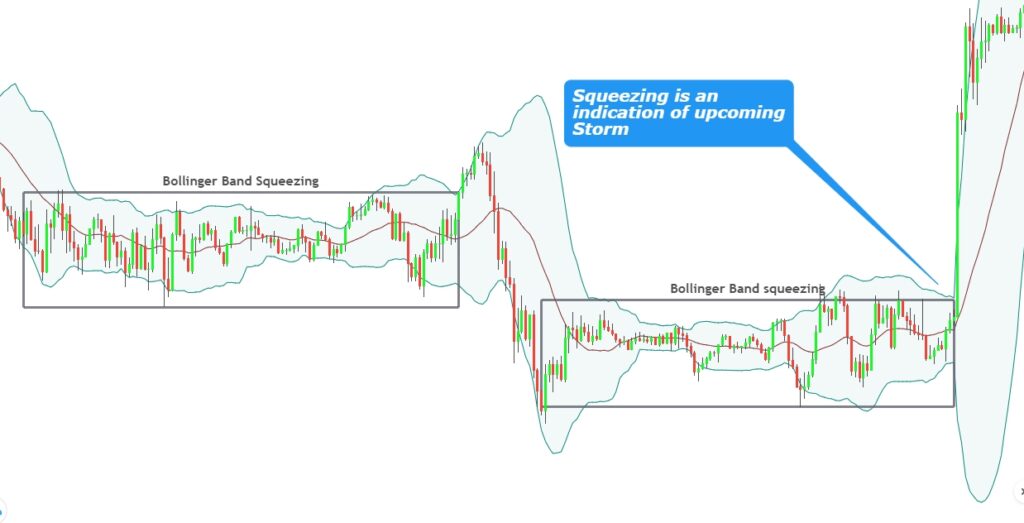
It is a natural phenomenon that there is always silence everywhere before the storms. The same phenomenon happens in the case of the Bollinger band’s squeezing phase.
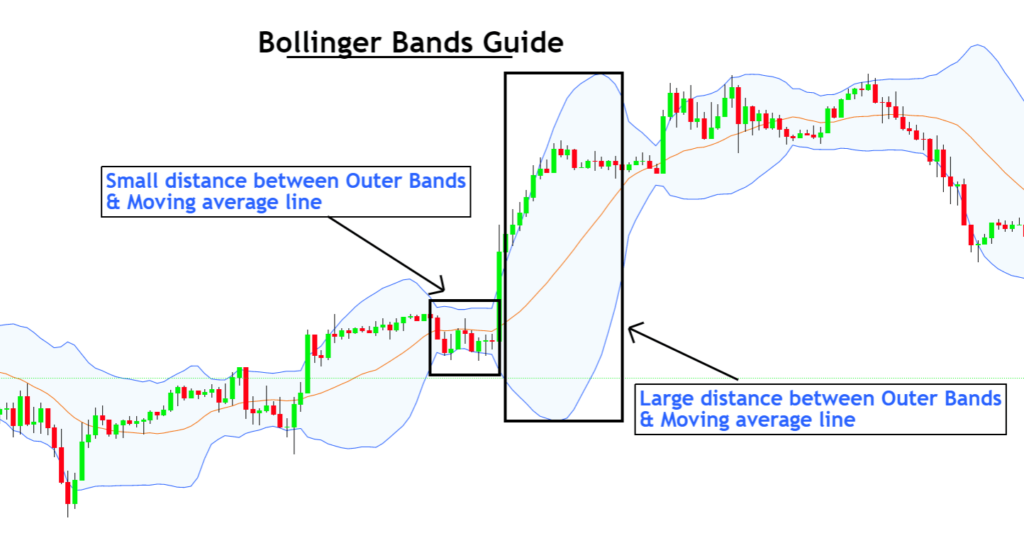
Before breakout, the upper and lower bands will start contracting and come closer to the middle moving average line. This is a sign of low volatility in the market and forecasts upcoming high volatility.
Breakout phase
The price will break the sideways range in the breakout phase, and a trend will start. The distance between the upper and lower bands will increase, showing that the volatility increased. Usually, traders look for a middle-moving average line breakout to forecast upcoming trends.
These are two essential phases of the market, and you should understand them to read the price action.
How to determine trends using Bollinger bands?
The best thing about the Bollinger band is that it can also show that either the market is in a ranging phase or a trending phase.
Bullish or bearish trend
If the price moves above the moving average line, the trend will be bullish. On the other hand, if the price moves below the moving average line, the trend will be bearish.
Range
If the price moves in the horizontal direction, this is the market’s ranging phase. Price will move above or below the moving average line.
How to trade Bollinger bands?
Many different strategies can be made using Bollinger bands. But the primary purpose is to learn the basic concept. Then it would help if you made your trading strategy depending on your temperament.
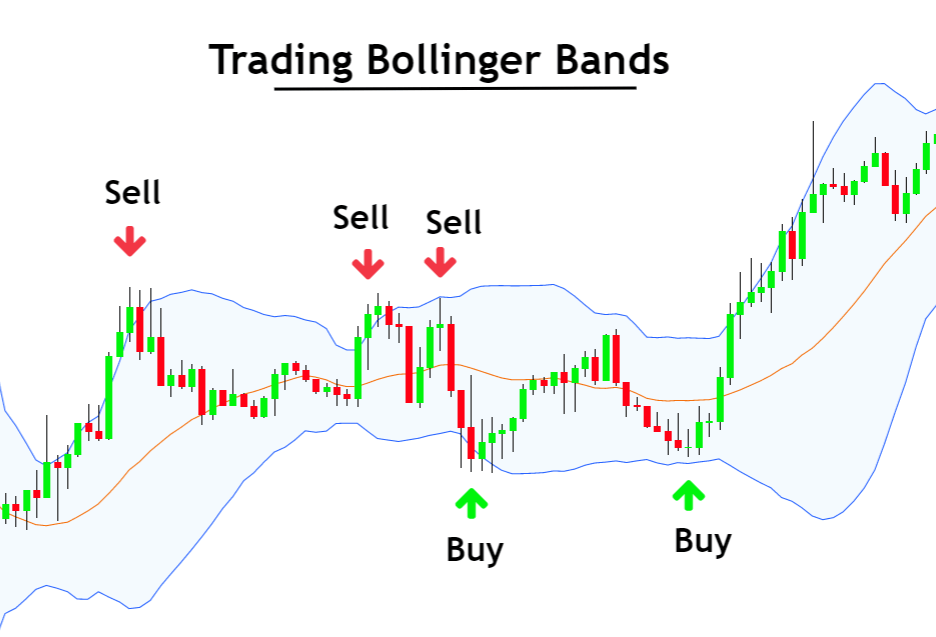
Sell signal
According to backtest results, 95% of price action happens within the outer bands. When the price touches the upper band, there is a sell signal. It would be best if you sold from the upper band.
Buy signal
When price touches the lower band, then a buy signal is generated. It would be best if you bought from the lower band.
You can also add other price action strategies to enhance the probability of winning. Like a formation of the bearish pin bar or bearish engulfing candlestick pattern at upper band will increase the probability of bearish trend reversal.
There are many other ways, like higher timeframe analysis of Bollinger bands.
Conclusion
Bollinger band is all one indicator that can be used for profitable trading. After learning this article, it does not mean that you will be able to make profitable trades. It takes time. It would be best if you gave time to backtest the market history daily.
Click here to learn more strategies related to the Bollinger bands.