
Definition
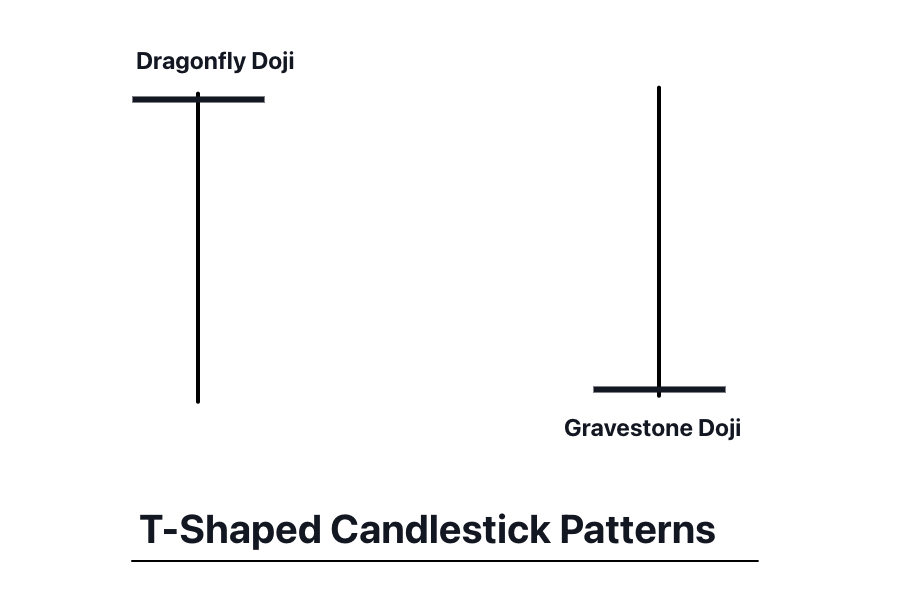
T shaped candlestick pattern is a pattern in which a candlestick has open, high,low, and close prices at the same or very close. This pattern resembles the English letter ‘’T’’.
The body of the candle is concise, and the wick is longer. The appearance of a T-shaped candlestick pattern indicates a trend reversal in the chart.
Types of T shaped candlesticks
Many types of candlesticks resemble the letter “T” our focus in this blog will address the types of candlesticks that have a very concise body and longer wick. As mentioned earlier, some traders also include Hammer and inverted Hammer candlesticks in the category. These patterns include candles with a bit longer bodies. Our blog focuses on targeting the genuine and authentic T-shaped candlestick. These types involve the following candlestick.
- Dragonfly doji
- Gravestone doji
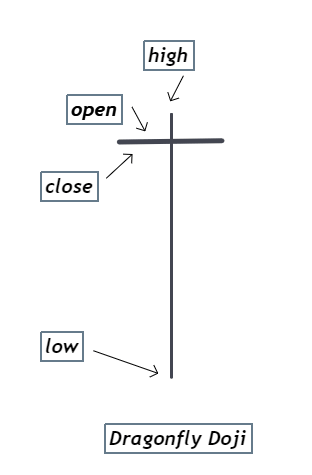
Dragonfly doji
It is a type of pattern in which the high, open, and close are at a similar level. The low is relatively at a greater distance. So, a proper T shape is formed.
This type of pattern indicates a trend change in the market. The candle following a dragonfly determines the sentiment of the market. A dragonfly doji usually means that the prior bullish trend can reverse into a bearish trend.
| Function | Description |
|---|---|
| Number of candlesticks | This pattern contains only a single candlestick |
| Prior Trend | It is an indication of the trend reversal. So, the prior trend can either be bullish or bearish. |
| Forecast | A candle that appears after the dragonfly doji is the determining factor for the prediction of future trends. If a bullish candle appears next to a dragonfly doji, the future is expected to show a bullish sentiment. The number of buyers will likely increase. In the case of a bearish candle appearing after a dragonfly, the number of sellers will dominate the market. |
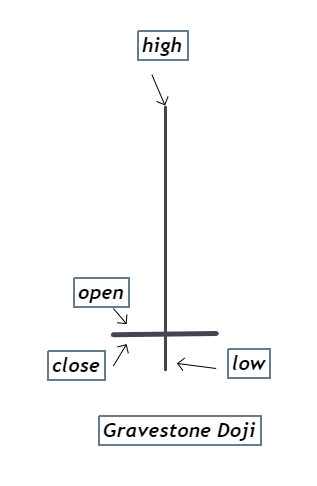
Gravestone doji
It is a type of pattern in which the low, open, and close are at a similar level. The high is relatively at a greater distance. It appears as an inverted T shape because of the upper longer wick.
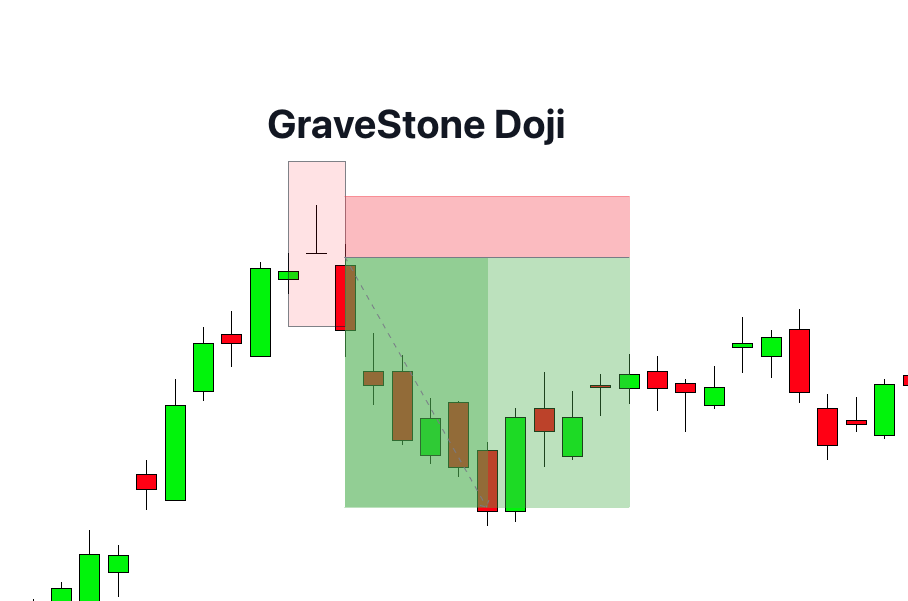
This type of pattern indicates a bearish reversal change in the market. The long upper shadow suggests that the bulls are fading away and bears are about to take control.
| Function | Description |
|---|---|
| Number of candlesticks | Gravestone Doji is composed of a single candle |
| Prior Trend | It is a bearish trend, so the prior trend is a bullish one. |
| Forecast | This pattern suggests that the bullish trend of the market is attempting to achieve new highs. but bears are about to fight back. The bullish sentiment begins to lose strength, and a bearish reversal trend is gaining control. The pattern indicates that number of sellers is going to increase in the near future. |
How to trade the T shaped Candlestick?
I have explained the simple trading strategy for both gravestone and dragonfly doji candlestick patterns.
Gravestone Doji Strategy
Entry: Some traders usually take short positions after the confirmation of this pattern. Seasoned traders wait for the next candle’s appearance to confirm the market sentiment.
Stop loss: It is placed at a higher level to the high of the candlestick pattern.
Take profit: You should use the relative strength index (RSI) and MACD to take profit while trading with a gravestone doji.
Dragonfly Doji Strategy
Entry: Traders usually wait for the appearance of the candle formed next to the dragonfly doji pattern.
Stop loss: If the bullish trend is confirmed, you should place the stop loss below the low of the pattern. In the case of a bearish trend, place it higher than the high of the dragonfly doji candlestick.
Take profit: Trading volume and relative strength index (RSI) enhances the probability of profit. I recommend you use them with dragonfly doji to take profit.

The bottom line
T shape candlesticks are formed with different high, open, close, and low levels. Based on this, we can form three types of candlestick patterns. T shape candlesticks are easier to find on the chart but are challenging to trade alone.