

Definition
A Hikkake candlestick pattern is either a bullish or a bearish pattern of 5 or 6 candlesticks which is used for short-term trend identification.
The developer of this unique pattern is Daniel L. Chelser. The salient features of this pattern are,
- It is used for the identification of a short-term trend.
- A Hikake pattern can exhibit both trends, i.e., uptrend and downtrend.
- It indicates high volatility in the market.
- At the end of the hikkake candlestick pattern, there is usually a breakout in the market.
- The breakout in the market can be of two ways (bullish/bearish).
How to identify the hikkake candlestick pattern?
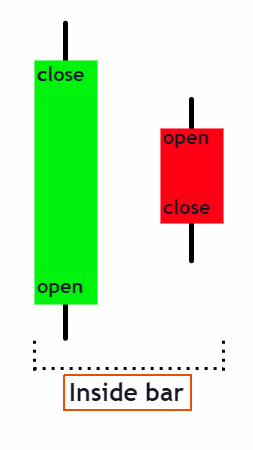
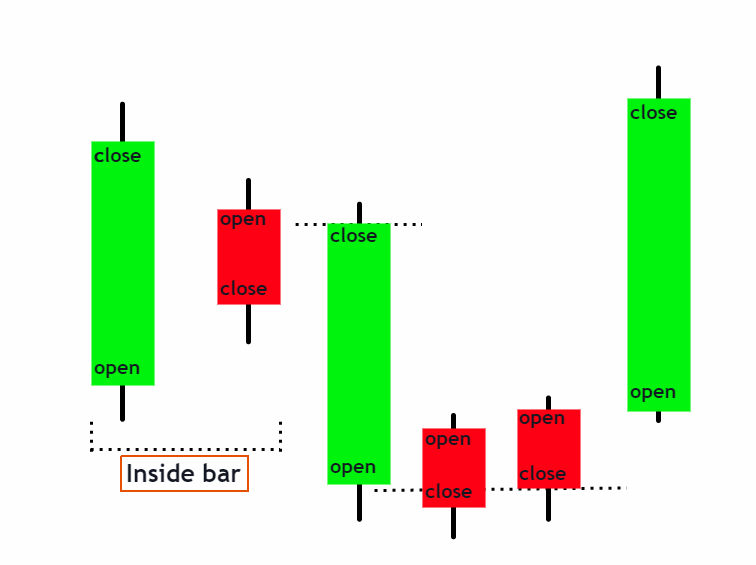
The identification of a hikkake candlestick pattern involves the appearance of an inside bar pattern on a candlestick chart. It is also referred to as a harami candlestick pattern.
As the inside bar pattern appears on the chart, the probability of the appearance of a hikkake pattern is always there.
- An inside bar pattern involves two candlesticks.
- The first candlestick is bullish.
- The second candlestick is a small-bodied bearish candlestick.
- The first bullish candlestick overshadows the second bearish candlestick.
The appearance of the inside bar pattern indicates a probability of the appearance of the Hikkake candlestick pattern. At this stage, we are still not sure about the nature of this pattern. As we know, this pattern can behave in both ways. The short-term trend can move in either way. There is an equal chance of a bullish and bearish trend after the inside bar pattern. To identify the trending nature of the Hikkake pattern, we need to understand the bullish and bearish setup of the pattern.
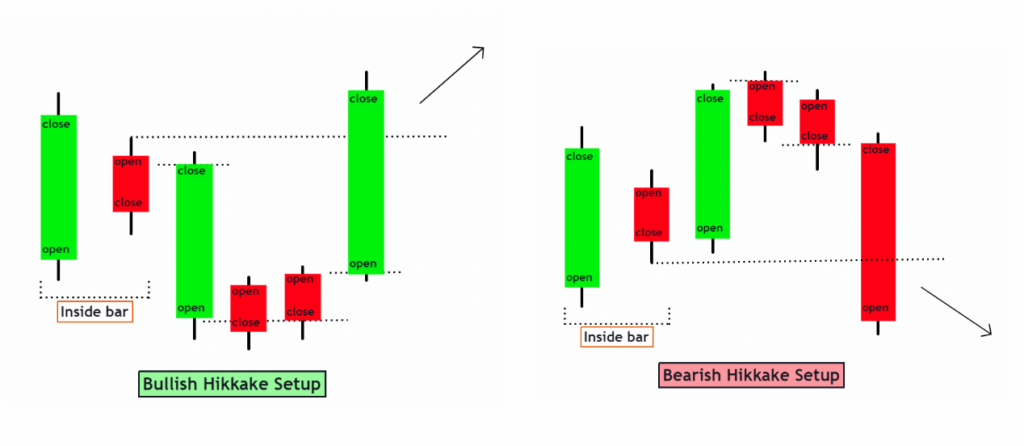
Bullish Hikkake
It is the type of pattern where the number of buyers dominates a market. It is a decent time to enter a market to benefit from the short-term bullish sentiment.
Keep in mind the open and close of the candlesticks in this pattern are very important for the identification of the pattern.
A bullish Hikkake is usually composed of 6 candles. In some cases, five candlesticks are also common.
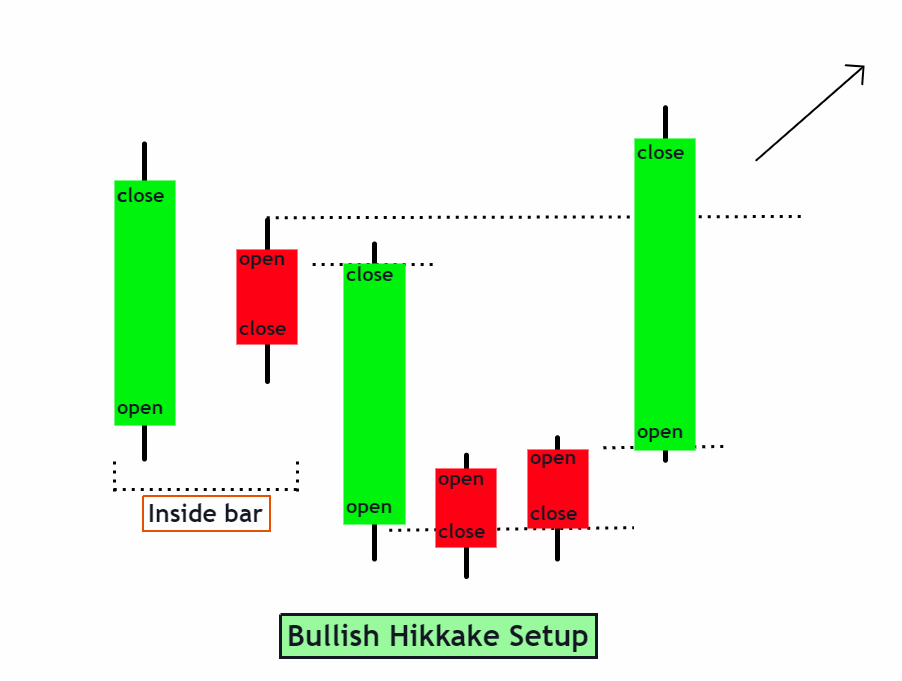
We can understand a bullish hikkake pattern from the following steps
Step 1.
Step one includes the formation of an inside bar pattern. It is also known as an inside day pattern.
This step includes a bullish candlestick. A bearish candlestick follows the first candlestick. The close of the first candlestick is at a higher position as compared to the open of the second candle. The first candlestick shadows the second candle, So the high of this candle is higher, and the low is lower than the second bearish candlestick.
Step 2:
Step two involves the appearance of a long-body candlestick. In the case of a bullish Hakkiki candlestick pattern, it is usually a white candle.
The close of the third candle is always at a lower level than the opening of the second bearish candlestick. The low of the third candle is significantly lower than the first two candlesticks.
Step 3:
This step involves the appearance of two candlesticks. In some rare cases, there is only one candlestick in this step. Step three involves the formation of two bearish candlesticks. The close of the first bearish candlestick is lower than the open of the prior bullish candlestick. The opening of the second bearish candlestick is higher than the prior bearish candlestick.
Step 4:
The step involves a long-bodied bullish candlestick. The opening of this candlestick is higher than the prior bearish candle. The high of the prior bearish candlestick is above the open of the last bullish candlestick.
The close of the last bullish candle is higher than the whole setup.
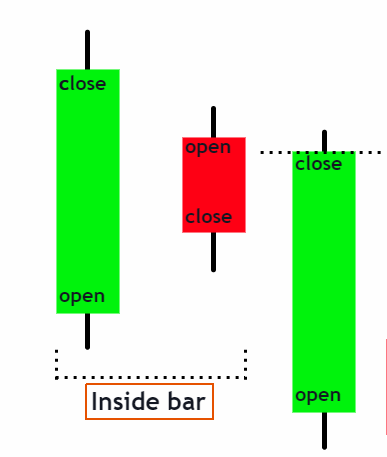
Bearish Hikkake
Bearish hikkake is a pattern that indicates a short-term decline in the market.
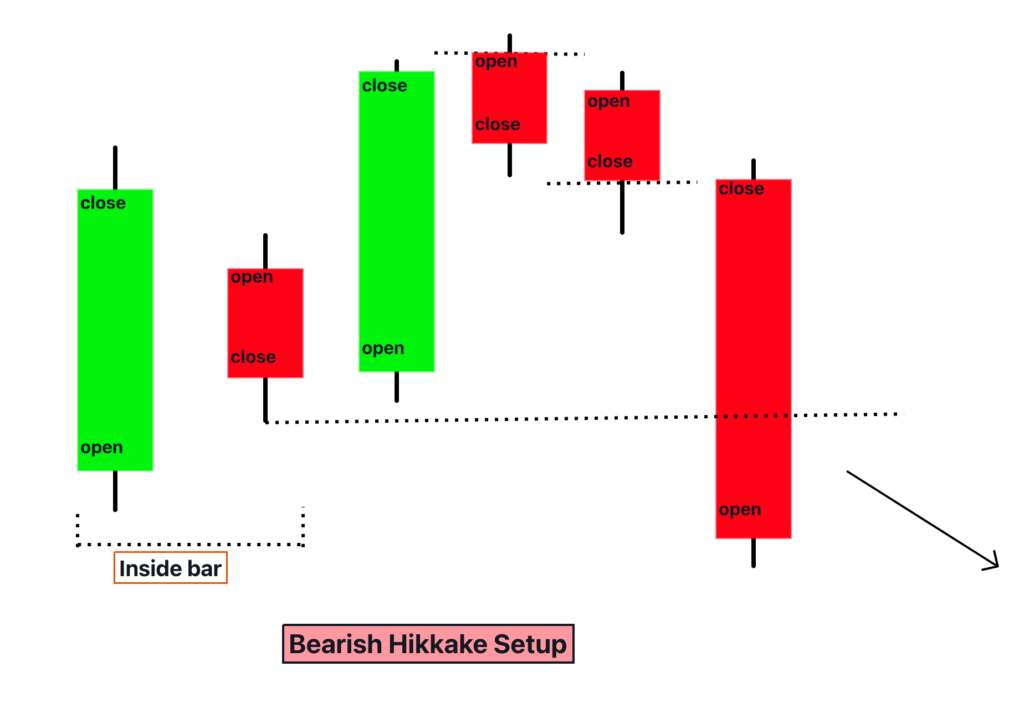
This candlestick pattern can be identified in the following steps.
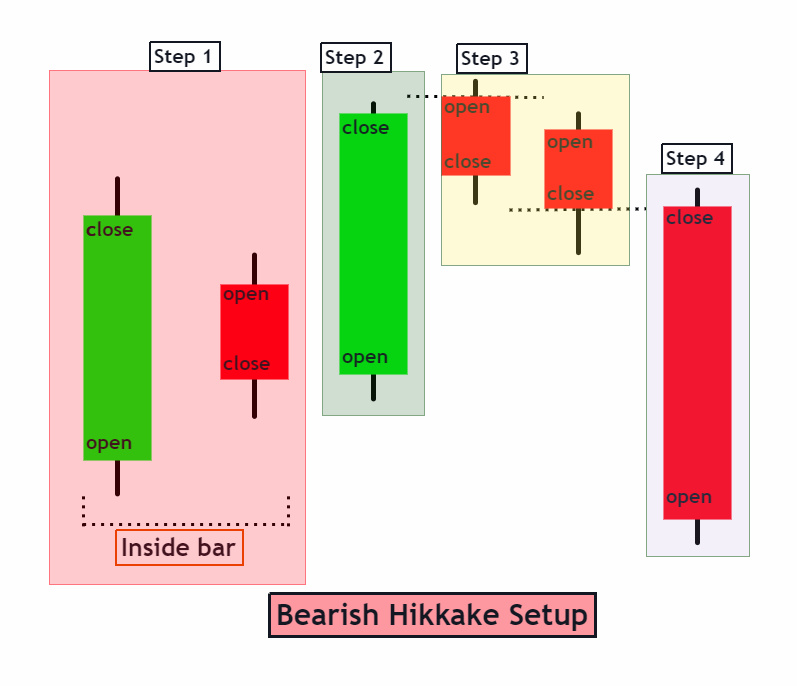
Step 1:
A bearish Hikkake pattern also involves the formation of the inside bar pattern, just like the bullish pattern.
It is identical to the prior mentioned trend.
Step 2:
Step two involves the formation of a long-bodied bullish candlestick. The open of the bullish candlestick is at a high level as compared to the low of its prior bearish candlestick.
The close of the third candlestick is higher than the prior two candlesticks forming an inside bar pattern.
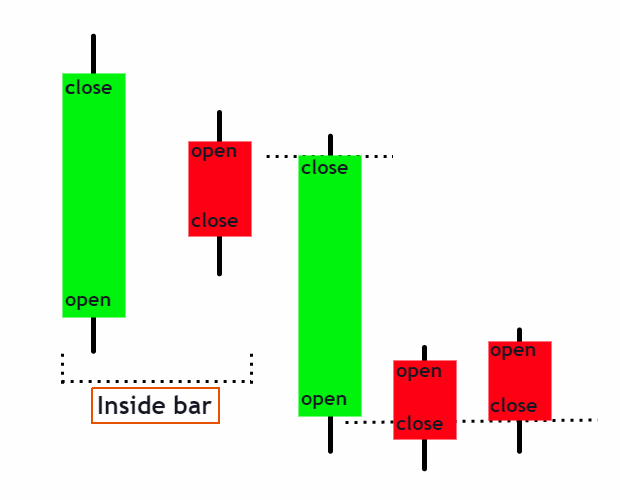
Step 3:
This step involves the formation of two bearish candlesticks. In some cases, there is only one candlestick in this step.
The open of the first bearish candlestick in this step is higher than the close of the prior bullish candlestick.
The second bearish candlestick appears just below the open of the first bearish candlestick. The close of the second bearish candlestick is significantly at a lower position than the prior candlestick.
Step 4:
This step involves the formation of a long-bodied bearish candlestick. The open of this candlestick is below the close of its prior bearish candlestick. The low of the long-bodied bearish candlestick is the lowest point in a bearish Hikkake setup.
Psychology of market makers behind the formation of hikkake pattern
Bullish setup:
The first two candlestick alert the market makers about a potential hikkake candlestick pattern. The positioning of the third candlestick confirms the bullish setup. The number of buyers comes in a good position for entry into the market at this stage. Traders can take benefit from the short-term price trend. They can also take benefit from the future bullish trend of the market once the price breaks an upward position at the end of a bullish Hikkake setup.
Bearish setup:
A bearish setup involves a similar mindset because of the formation of an inside bar pattern. At this stage, traders are not sure about the nature of the future trend. The third candlestick confirms the bearish nature of the Hikakke candlestick pattern. The short sellers become active to benefit from the decreasing prices.
Success ratio
The success ratio of this candlestick pattern is approximately 53.1%. So, it is regarded as a reputable candlestick pattern. The ratio of success further enhances if a confluence of this candlestick pattern is formed with support and resistance zone.
Conclusion
The hikkake candlestick pattern involves the short-term change in the market trend. This change can be of both natures, i.e., bullish and bearish. A market break can take place after this pattern is revealed on a candlestick chart.
It is a high success ratio candlestick pattern. One can equally benefit from this pattern either by taking a short-term position or placing a long trading position.