
Definition
The Shinohara intensity ratio indicator is a trend identification indicator that uses a strong and a weak ratio for predicting a market.
It is a basic and simple-to-use indicator that doesn’t involve fancy settings or complex measurements. The working of this indicator is the simple identification of the trend nature in a stock or forex market. It provides significant information about the trend change, so it can help a trader form a trading strategy around it.
Purposes of using SIR indicator
It is a very basic indicator with the sole purpose of identifying a trend. So the main objectives of this indicator are,
- To identify the nature of a market.
- To signal a bullish or a bearish trend.
- To indicate the trend reversal.
Significance
It is an old saying that “simplicity is the ultimate beauty.” The Shinohara intensity ratio indicator’s simplicity can help you set up a good trading strategy. This indicator can identify a trend in the market, and it is also capable of predicting trend reversals. So, it is a significant indicator. The main benefits a trader can enjoy with this indicator are,
- It can help you to identify a bullish trend,
- It can tell you when the bears are gaining control of the market.
- It can signal a trend reversal.
- It can help you identify the entry and exit points.
- It can help you to form a trading strategy.
Working of Shinohara intensity ratio indicator
The working of the Shinohara intensity ratio indicator is very basic and simple. This indicator comprises two ratios for its working.
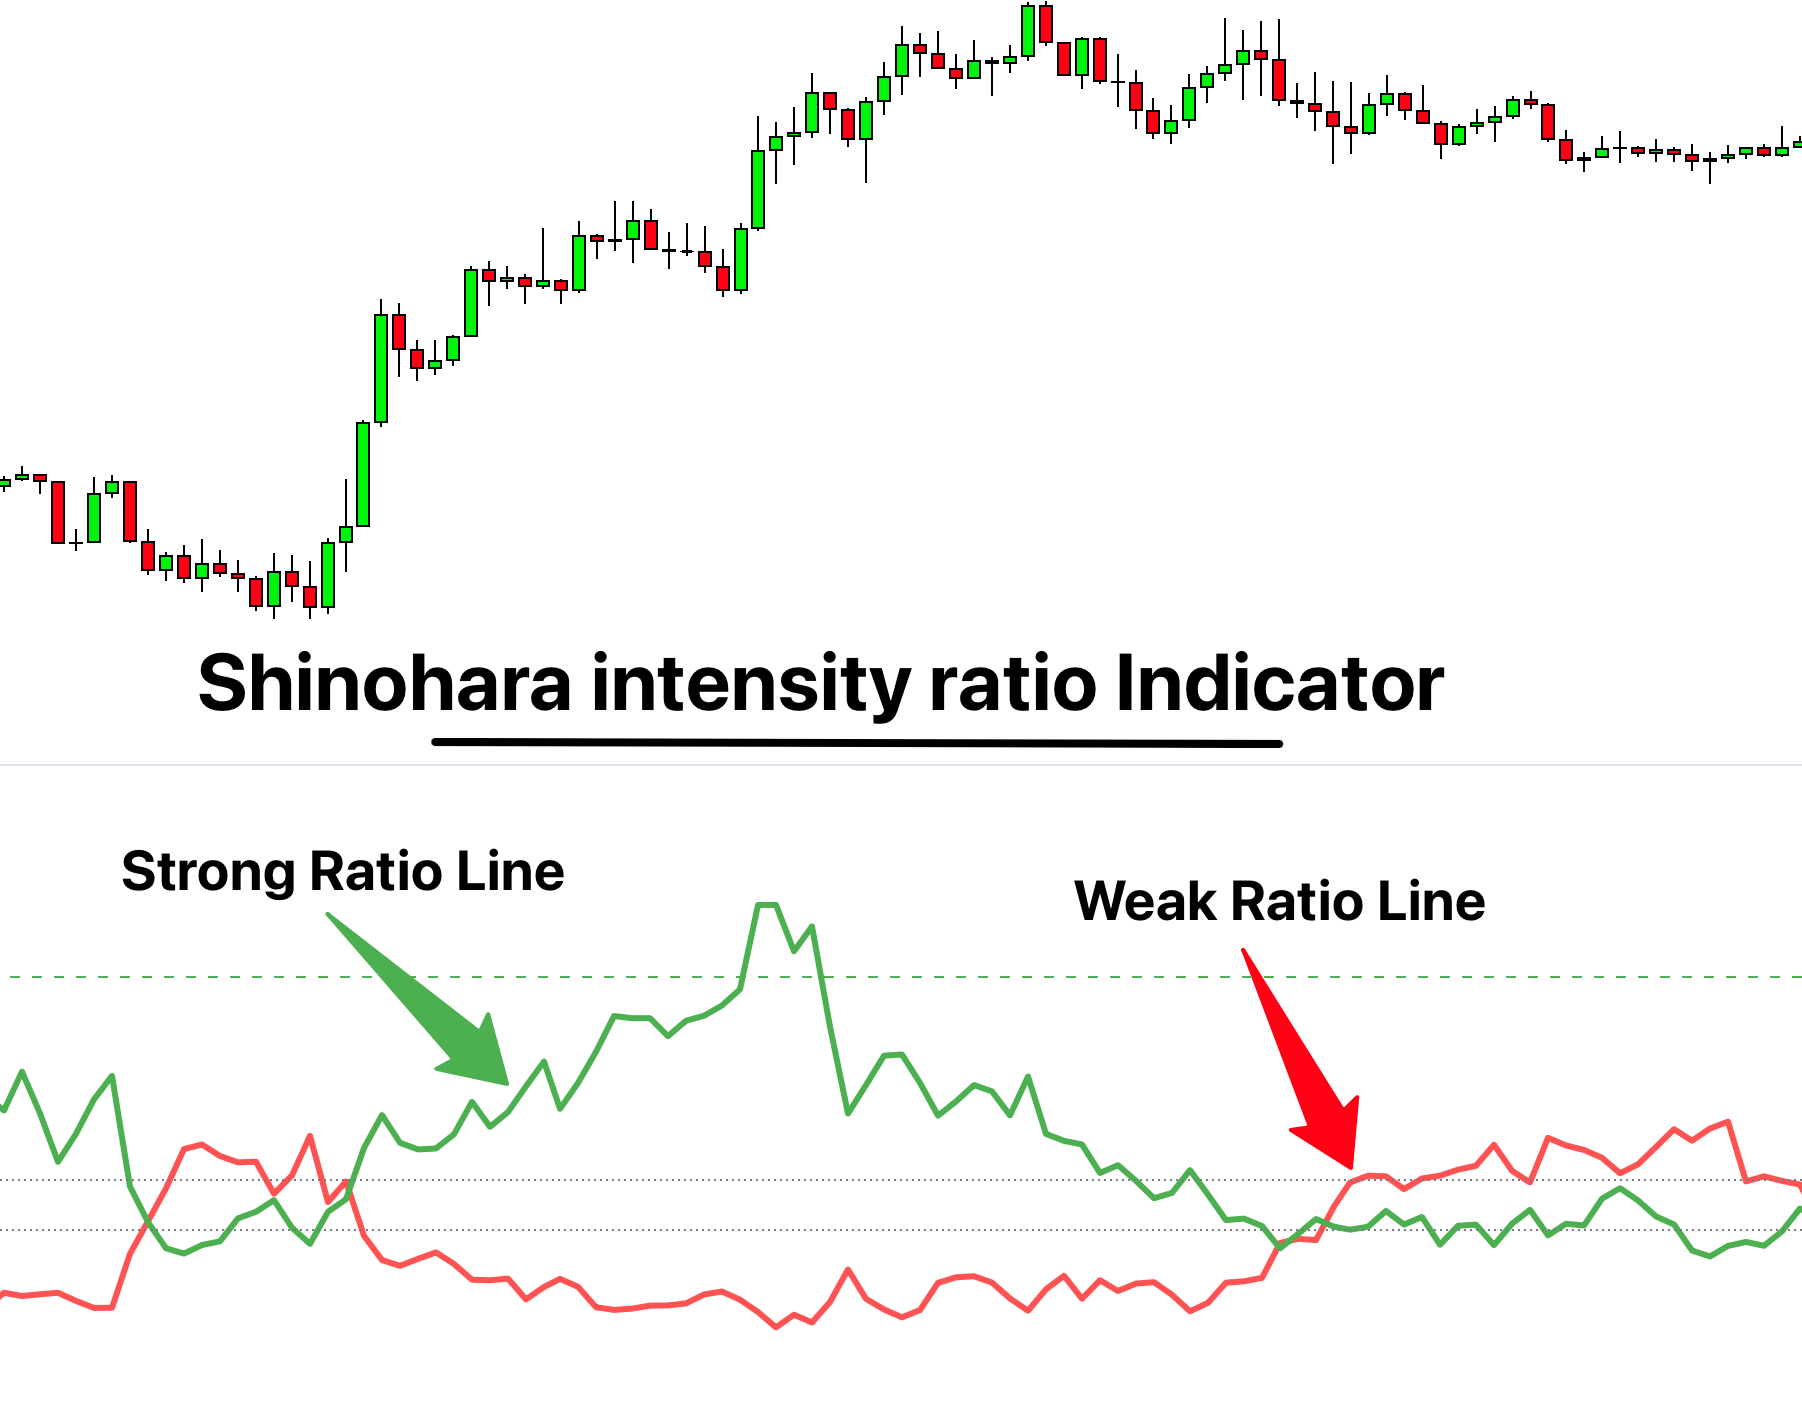
Strong ratio
It is the signal line of the SIR indicator. A strong ratio is usually represented in green color. This line acts as the signal line. It is frequently a more moveable and active line of the indicator. A strong ratio line helps you to identify the nature of a trend and find appropriate trading points.
Weak ratio
The weak ratio is usually red in color. We can also call it a red line. It is somehow a more stable and less vibrant line. The main property of this line is it doesn’t deviate much from the central position and stays close to the average prices range. It moves like a sloth. We compare the market volatility with the help of this line in relation to the strong ratio.
Indicator line
The indicator line is the fixed dotes line which represents the average prices of the market. It provides us with information about the deviation of prices from the average prices with the help of a ratio line. It also provides information about the fair prices of the assets. This fair value of the assets can help you to take a position in the market. If the prices are far away from the average prices, it means soon the prices will return to the indicator line. This phenomenon can help you to take a position in the market.
SIR readings
On the right-hand side, the SIR readings range from 0 to onwards. The difference between each reading is 100 points. So as the price move from 0 – 100, 200, 300, and so on. We can get a good idea about the prices of the assets.
Working of SIR
To understand the working of the SIR, I will name the strong and weak ratios with A and B lines.
- Weak ratio = line A
- Strong ratio = line B
We know that line A is a weak ratio, and it doesn’t deviate much. It is more of a static nature and stays in the somehow linear way.
Line B is a volatile line, and it moves more rapidly. As line B is above line A, it is a bullish market. It suggests that the number of buyers is at the dominating end.
As line B move below, it signals the trend reversal. It suggests that the market is about to dip, and soon the bears will gain control. As line B is below the weak raion line A, it means that the bearish sentiment of the market is obvious. At this point, the number of sellers is controlling the market.
If line B is above 400, it shows the overvalue of the asset, and it suggests that prices are well above their actual prices.
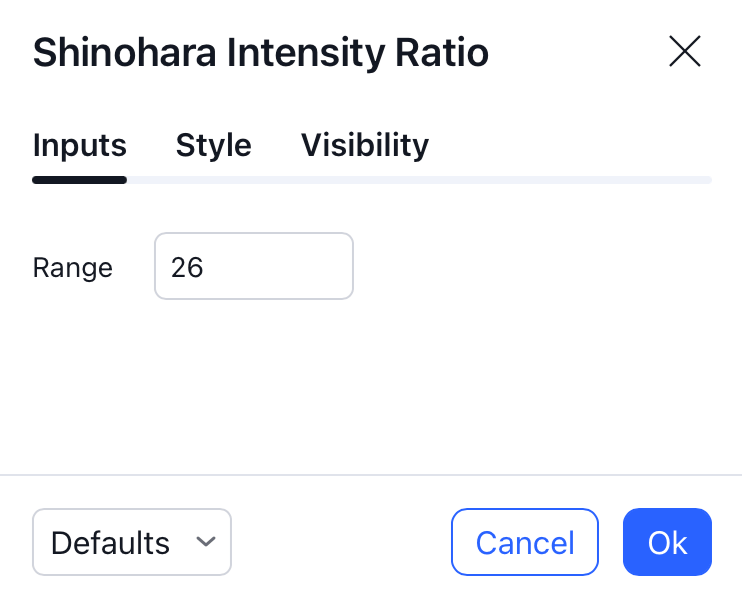
Best settings
The default setting of this indicator has a green color for the strong ratio and red color for the weak ratio. The input range for this indicator is 26.
Furthermore, a trader can use these settings according to his personal choice and trading experience.
Trading strategy
The trading strategy of this indicator involves three steps.
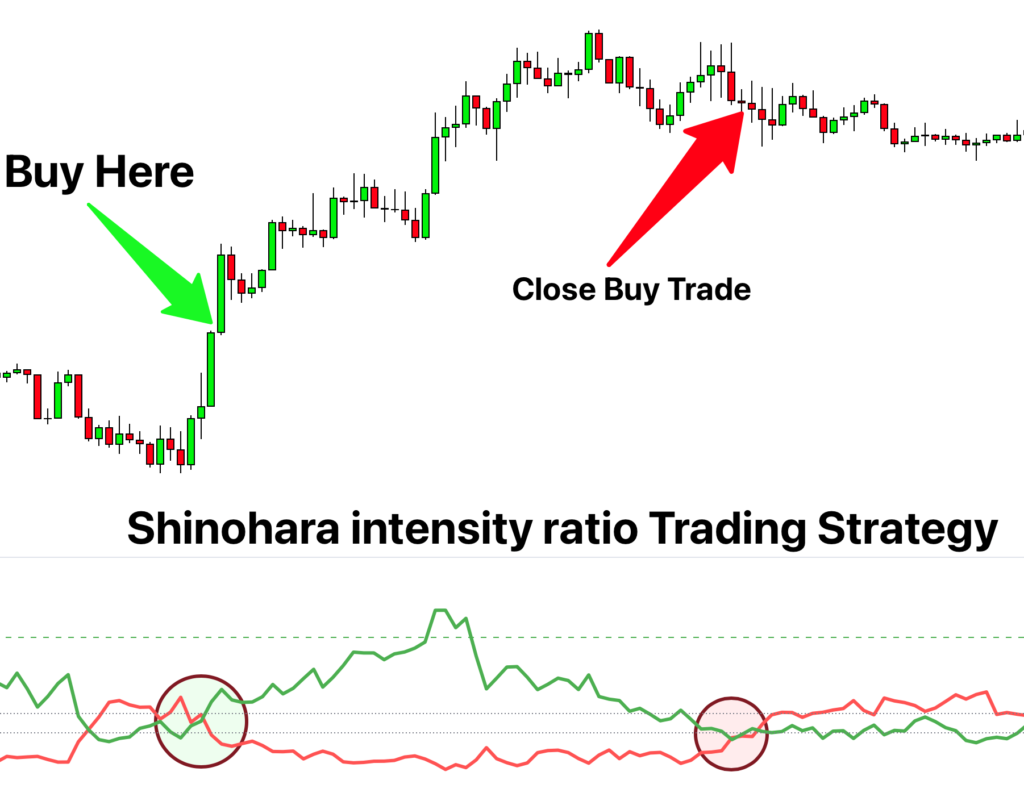
Entry and exit
As the strong ratio begins to move above the red line/weak ratio. It is a good time to enter a trade. Once the green line takes a dip and begins to fall, it is time to exit your trade.
On the other hand, for a bearish trade, you can enter a trade once the red line is above the green line.
Risk management
There is not much information available about this indicator’s testing. So I suggest you use this indicator with confluence to other technical tools to avoid risky trading. Moreover, place the stop loss below the previous low point in the case of a bullish trade. Put the stop loss above the prior high point in the case of a bearish trade.
Take profit
I suggest you use the support and resistance zones for taking the profit in conjunction with the SIR indicator.
Pros
The good sides of this indicator involve the following pros.
- It is a basic and easy-to-use indicator.
- It is a very simple indicator.
- It provides information about the trends of the market.
- It can help in identifying a trend reversal.
- It can help you in the formation of a trading strategy.
- It can work with a variety of currency pairs.
- It is equally helpful in stocks and forex.
Cons
- It can create false signals.
- There is very little data available about the success ratio of this indicator.
- It is not much reliable in a fast-moving market.
- It requires the conjunction of other technical trading tools.
Success ratio
There isn’t sufficient information about the success of this indicator. So a user should avoid putting total reliance on this indicator. Instead, use the confluence of this indicator with other well-established indicators.
This indicator is a good tool to require information about the market, but a total reliance on this indicator can produce unpredictable results.
The bottom line
The Shinohara intensity ratio indicator is a trend indicator that can sufficiently provide information about the market. This indicator is easy to use and very user-friendly, but I don’t suggest you rely on this indicator alone.