

Definition
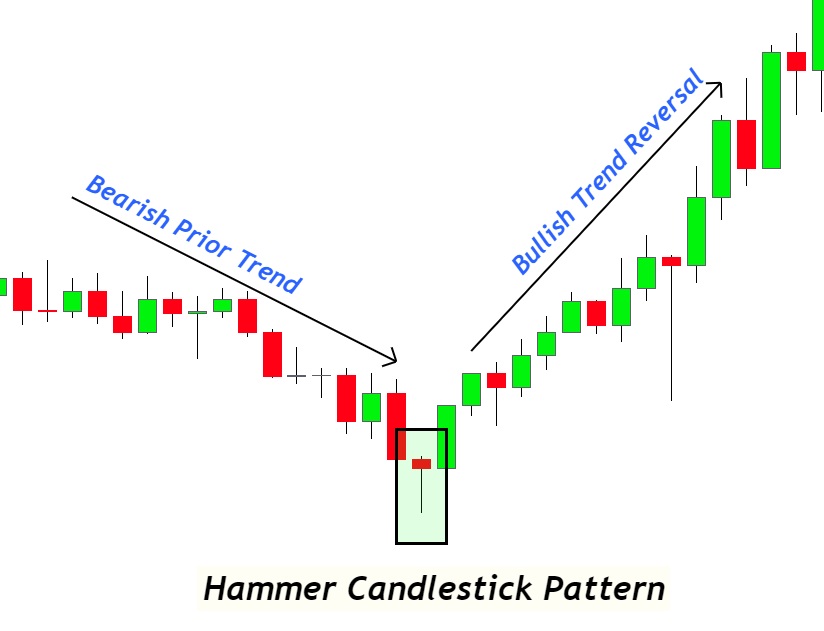
Hammer candlestick is a bullish trend reversal candlestick pattern with a long lower shadow and a small body on the upper side of the candlestick. After forming the hammer candlestick pattern, the price turns its bearish trend into a bullish trend.
The Hammer candlestick is also relevant to the bullish pin bar. Both show the exact trend reversal on the price chart. Retail traders widely use this candlestick pattern to predict the upcoming trend reversals in the market.
This article will teach you about the hammer pattern’s structure, importance, and trading strategy in forex or stock trading.
How to identify the hammer candlestick?
Finding a hammer candle on the price chart is easy, but identifying a good candlestick pattern is difficult because the market is full of noise that will confuse you with picking the correct candlestick pattern.
To identify a good hammer pattern, we will discuss three confluences:
- Structure of candlestick
- Location of candlestick
- Prior trend
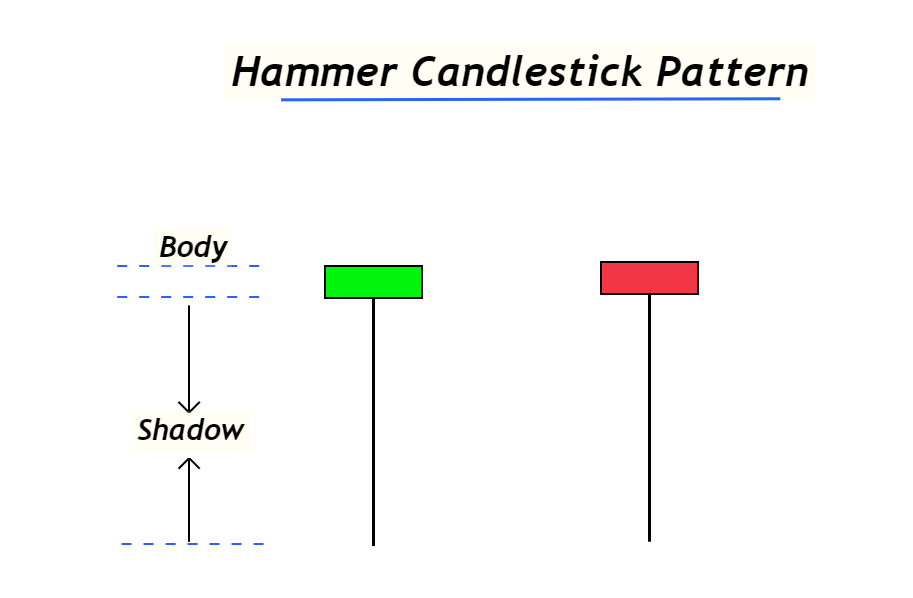
Structure
The hammer candlestick has a long shadow on the lower side of the total candlestick. Long means it should be more than 60 to 70% of the full candlestick size—a small body forms at the top of the candlestick with little or no shadow above the body.
Tip: The color of the Hammer candlestick does not affect the performance. It can be red or green, but the structure of the candlestick is the primary point to be noted.
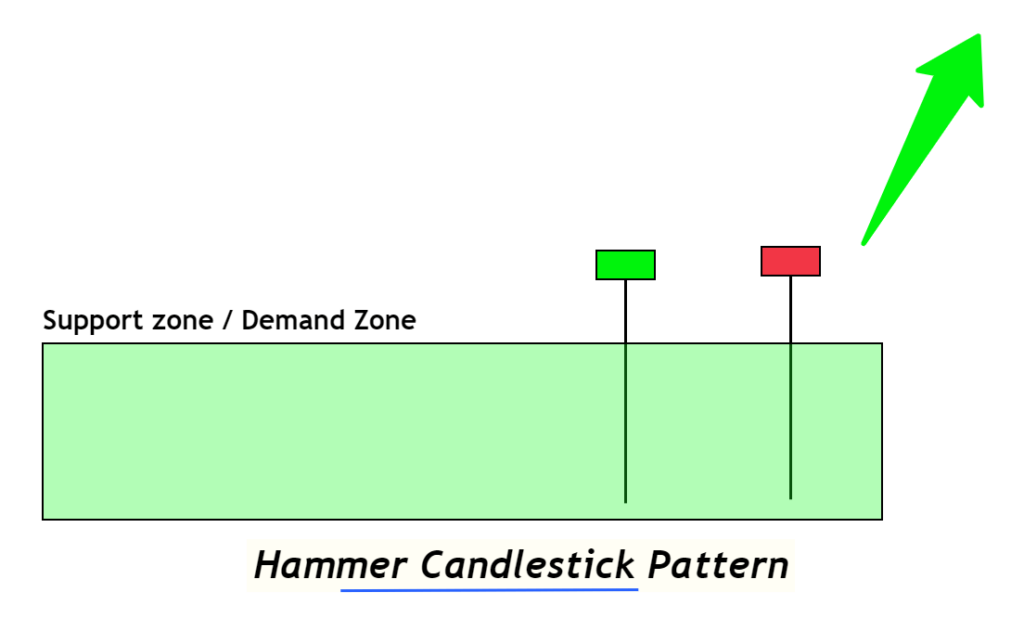
Location
The location of the candlestick pattern on the price chart is one of the essential parameters. This confluence will filter the good patterns from the crowd on the chart.
In the case of a hammer candle, it should form at the support zone or demand zone
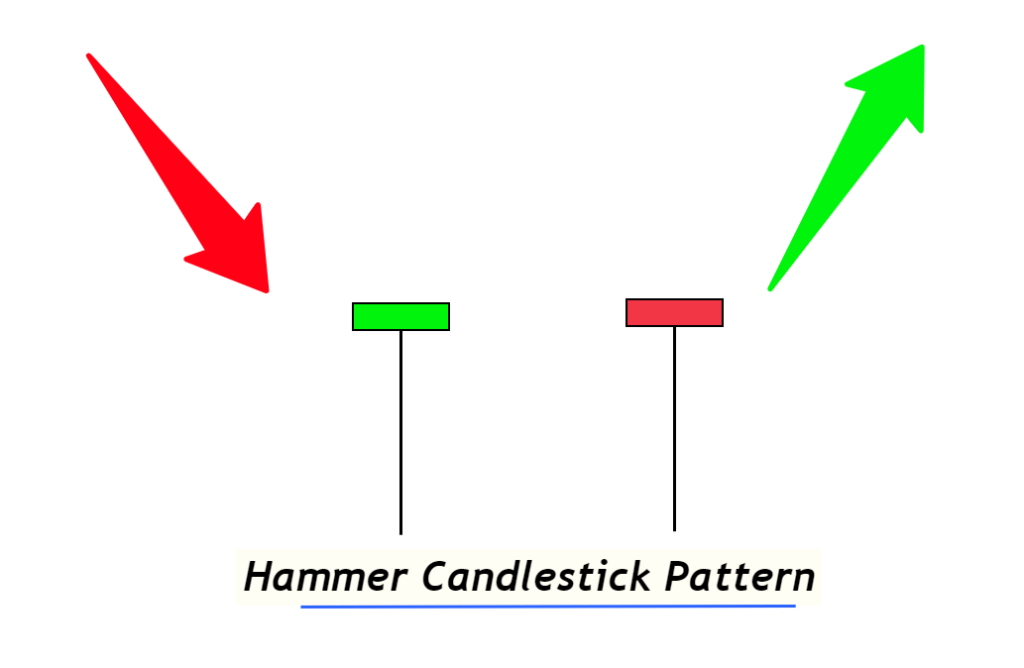
Prior trend
The prior trend to the hammer pattern is bearish. It must form after the formation of two to three bearish candlesticks.
If it forms within the range, then the sense of hammer pattern will completely change and fail to give a bullish trend reversal.
Tower Bottom Pattern: Information Table
| Features | Explanation |
|---|---|
| Number of Candlesticks | 1 |
| Prediction | Bullish trend reversal |
| Prior Trend | Bearish trend |
| Counter Pattern | Shooting star |
What does the hammer pattern tell traders?
Learning to identify the process behind the chart is necessary to become a professional trader.
For example, if a pin bar or engulfing candlestick forms on the chart, then a professional trader should know the activity of buyers and sellers behind the candlestick chart. It is the method of pro-price action traders.
So, sellers tried their best to keep the bearish trend dominant in the case of the hammer pattern. After a long bearish move with the false break of a specific support level, buyers come into the market in full force. From the support zone, the buyers dominate the seller’s power and push the market up to starting level. Then price closed above the 61.8 Fibonacci level of the total candlestick’s range. It shows that buyers are in full power and strong strength from the support zone. That’s why the price will bounce from the support zone, and a bullish trend reversal will happen.
This is what the hammer candlestick tells retail traders about the trend reversal.
Day Trading Strategy for hammer candlestick pattern
In this strategy, you’ll learn to trade with this candlestick pattern.
Please remember that a strategy is not made by using a single candlestick pattern. It is always made by the confluence of at least three technical tools. Because doing this will increase the probability of winning. And also, by the addition of risk management tools, we can make a winning trading strategy.

Find High Probability Trades with this ADVANCED Candlestick Patterns Course
The Ultimate Candlestick Patterns Course That Will Help You To Trade Better
Hammer candlestick as a support zone
The best confluence of candlestick patterns is the support or resistance zones since the hammer candlestick is a bullish pattern that will be used with a confluence of the support zone.
The support zone confirms the validity of the bullish trend reversal candlestick pattern. Both technical tools show the same bullish trend reversal, so when both patterns form instantly at the same point on the chart, the probability of bullish trend reversal increases.
Retail traders use this most straightforward strategy to predict the upcoming trend reversals on higher timeframes.
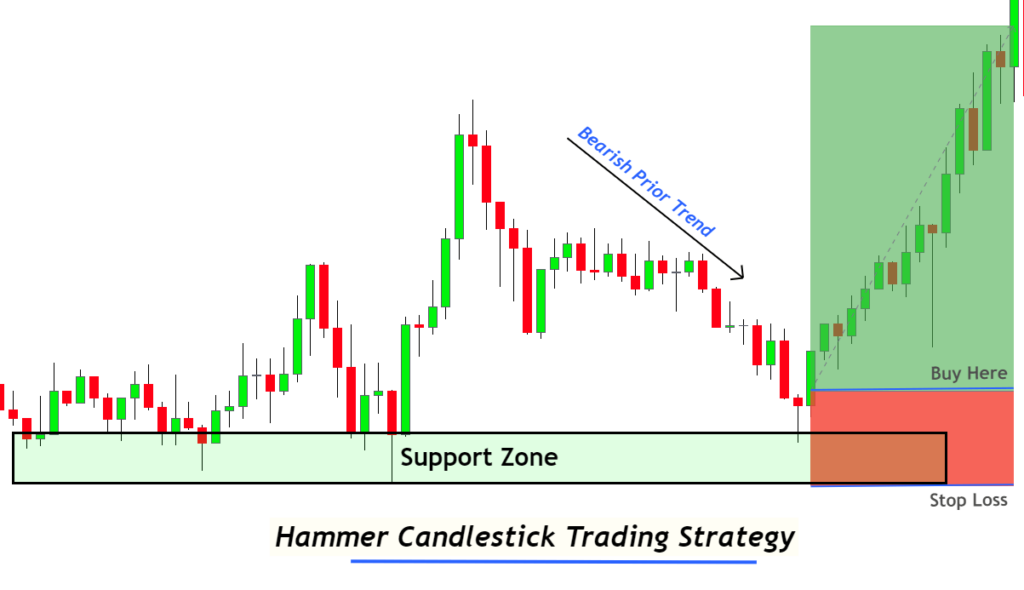
Open buy trade
When a bullish hammer candlestick pattern forms on the price chart, open a pending buy stop a few pips above the high candlestick. And place stop loss below the low of the hammer candlestick or the support zone. You should always choose the conservative way to set stop loss if you don’t have much trading experience.
Conclusion
Candlestick patterns play a vital role in the trend prediction of financial markets. On a higher timeframe, we can predict the trend with the help of candlesticks and then apply strategy in the direction of the trend on lower timeframes. This is the best multi-timeframe strategy that every trader should follow to increase the winning ratio of a strategy.
I also recommend you backtest the candlestick patterns properly after learning the psychology of each pattern because this will improve your trading skills significantly.
There is a difference in name only between hammer and bullish pin bar. Because the structure, location, and significance of both candlestick patterns are the same. Both are bullish trend reversal candlestick patterns.
According to professional traders, you should try to learn the sense and performance of candlesticks instead of learning the names. Because there are several candlestick patterns, and you cannot remember all of them. But if you understand the market behavior, then you can predict the action of each candlestick pattern.
The color of the hammer candlestick does not matter in technical analysis; only the price chart’s location, structure, and prior trend matter. The small body can have either green or red color. It will always predict a bullish trend reversal on the price chart.
The Hammer pattern will work on the candlestick chart of every financial instrument in this world. Because this pattern is made of a price action pattern, it shows the natural behavior of markets. So it does not matter whether you are trading stocks or forex. It will work perfectly.