
Definition
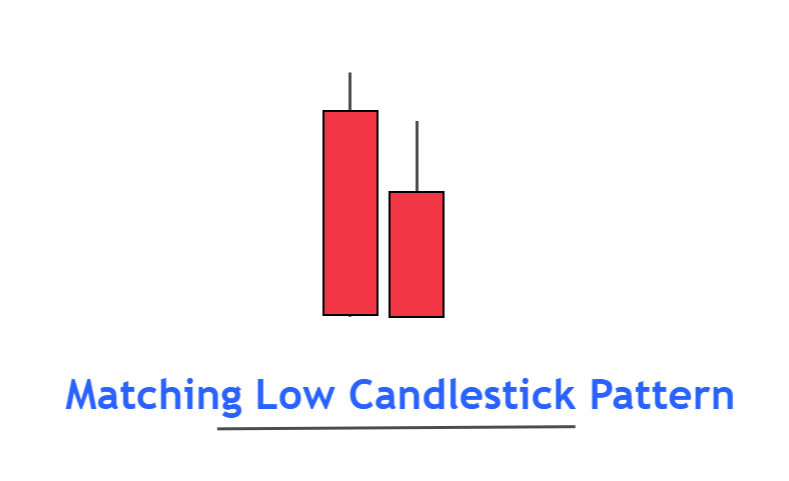
Matching low is a bullish trend reversal candlestick pattern that consists of two bearish candlesticks with the same closing price and no shadows on the lower side of candlesticks.
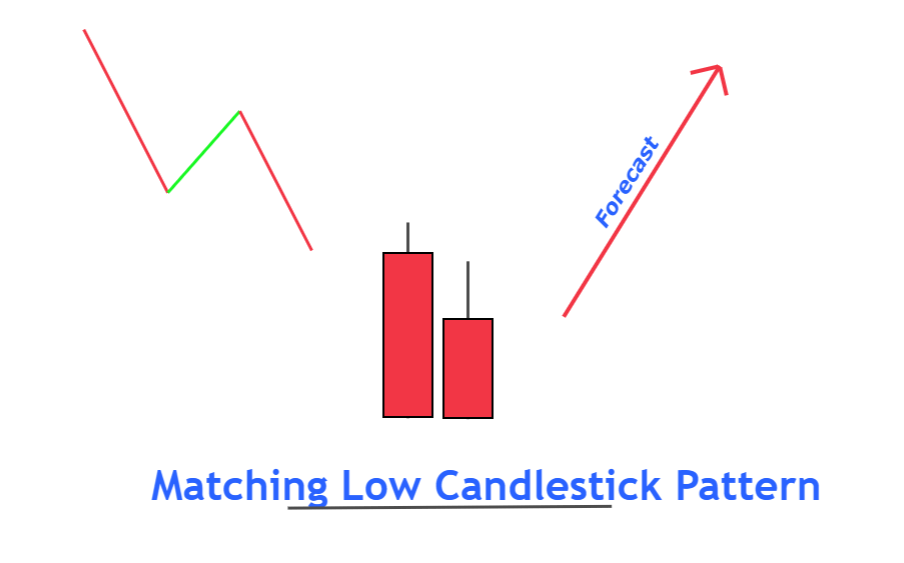
It will mostly form in stocks and indices. It is an indication of the beginning of a new bullish trend. Sometimes, a matching low pattern also acts as a bearish trend continuation pattern. But in most cases, it will act as a trend reversal pattern.
We will also discuss how to identify trend continuation or trend reversal in this pattern.
How to identify the matching low pattern?
The structure of the matching low pattern is made up of two bearish candlesticks.
Here’s the guide to find out matching low candlestick
- The first candlestick will be a big bearish candlestick that shows the high momentum of sellers in the market. The prior trend to this candlestick should also be bearish.
- The second candlestick will open with a gap up but within the previous candle range. Then it will close at the closing price of the previous candlestick. It will also be a bearish candlestick.
- On the lower side of both candlesticks, no shadows will form.
Matching Low Pattern: Information Table
| Features | Explanation |
|---|---|
| Number of Candlesticks | 2 |
| Prediction | Bullish trend reversal |
| Prior Trend | Bearish trend |
| Relevant Pattern | Matching high candlestick |
What does the matching low candlestick tell traders?
The psychology behind this pattern is that the sellers failed to make a new lower low. Buyers have created an intense level, and sellers cannot break that key level even after the second attempt.
Let’s read the price action.
When the first big body bearish candle forms, sellers are in complete control. They are controlling the market, and buyers are weak. Buyers are not even able to hold the price. That’s why the price is decreasing.
After closing the first candle, the second candlestick opens with a gap up. It shows that something is happening at that closing price because that key level caused the candle to open with a big gap up. After this, the second candlestick again closes at the closing price of the previous candle. It could not break the previous level to make a new lower low.
All the above price action shows that buyers are ready to increase the price, and a new bullish trend will start.

Find High Probability Trades with this ADVANCED Candlestick Patterns Course
The Ultimate Candlestick Patterns Course That Will Help You To Trade Better
Best trading conditions for matching low pattern
The location of a candlestick pattern on a price chart matters a lot in trading. For example, if a bullish reversal pattern forms at the top of the chart, you will not get the full potential of a trend reversal because it should form at the bottom of the price chart.
In the same way, matching low pattern will work well when it forms at
- Support zone/ demand zone
- Overbought conditions
A matching low pattern will also act as a trend continuation pattern during certain conditions. So, to tackle this, you will always have to wait until the third candle forms. The third candlestick should be a big bullish candlestick, a confirmation candle. It should close above the previous candle’s opening price.
In short, wait for a bullish candlestick formation before confirming a trend reversal.
Conclusion
It would be best to use matching low candlestick for technical analysis purposes instead of a direct trading strategy because this pattern will offer you few opportunities in trading.