
Introduction
Looking at nature, we often see patterns like the rings inside a tree trunk or the way ripples spread across water when you drop a pebble. In the market, we see similar patterns, but they appear on charts that track the prices of stocks over time. These are called chart patterns. They help people who buy and sell currencies make decisions by giving them a hint about what might happen next with the prices.
What Are Chart Patterns?
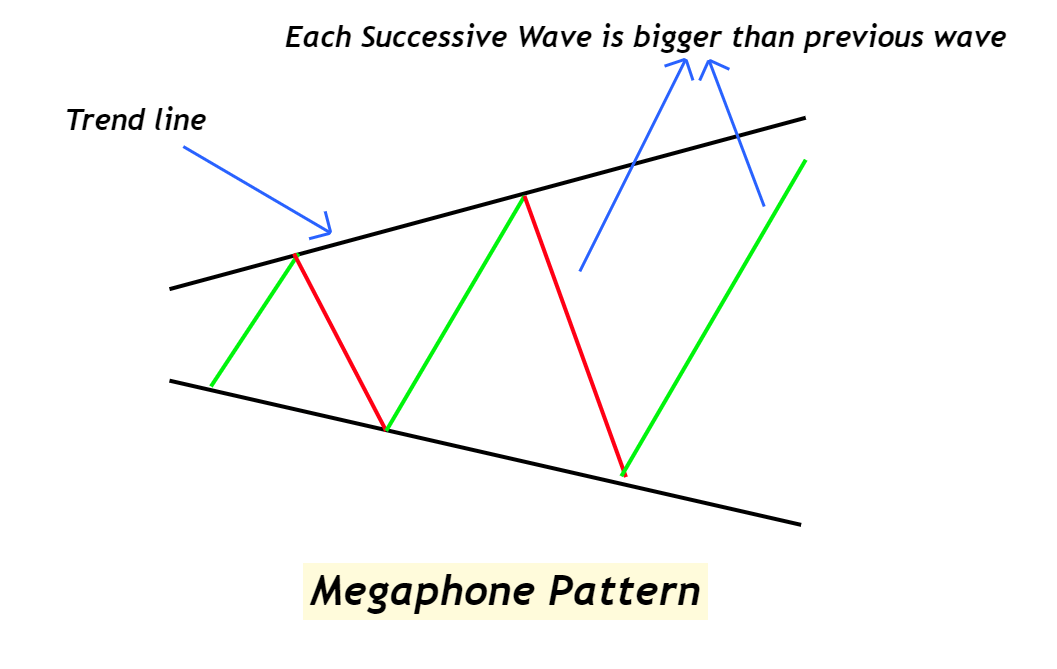
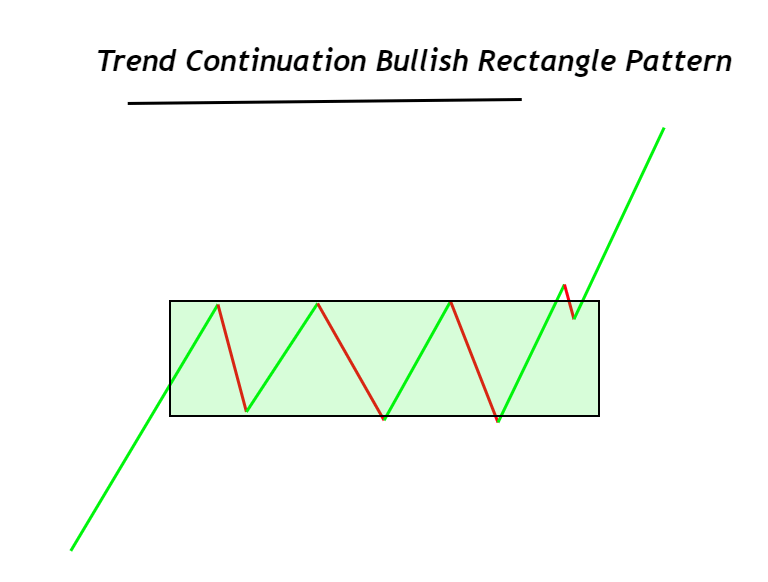
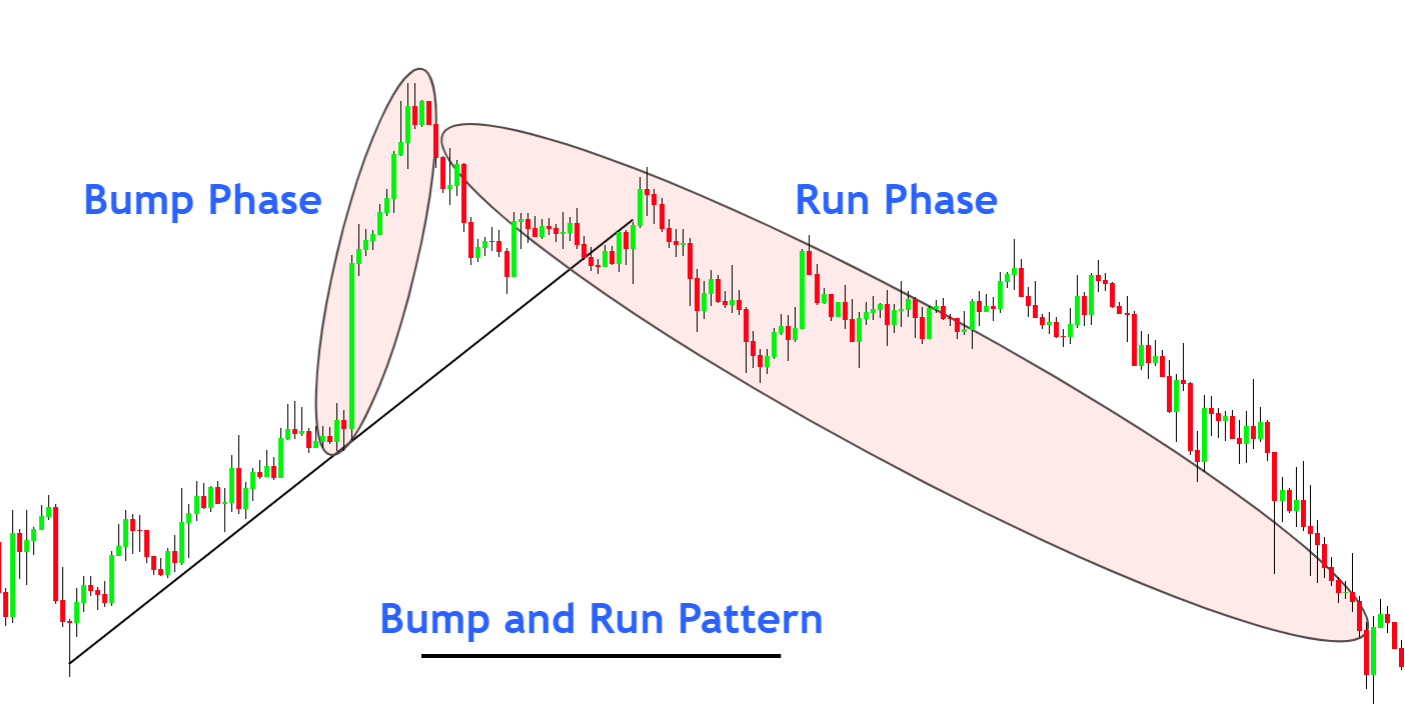
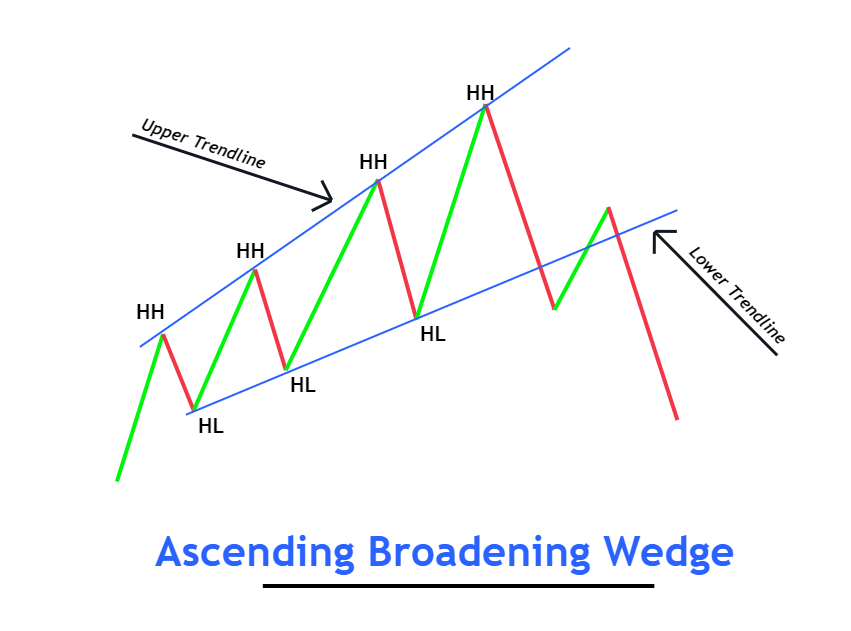
Chart patterns are shapes that show up on the charts where prices are plotted. They form because of the way people buy and sell stocks. When lots of people want to buy a currency pair, the price goes up. When many want to sell, the price goes down. These ups and downs can make shapes or patterns.
Traders look at these shapes to try and guess where the price will go next. It’s a bit like predicting the weather by looking at the clouds. If you know what different cloud formations mean, you can guess if it’s going to rain or be sunny. In trading, if you know what different chart patterns mean, you can make a better guess about whether the price of a currency pair will go up or down.
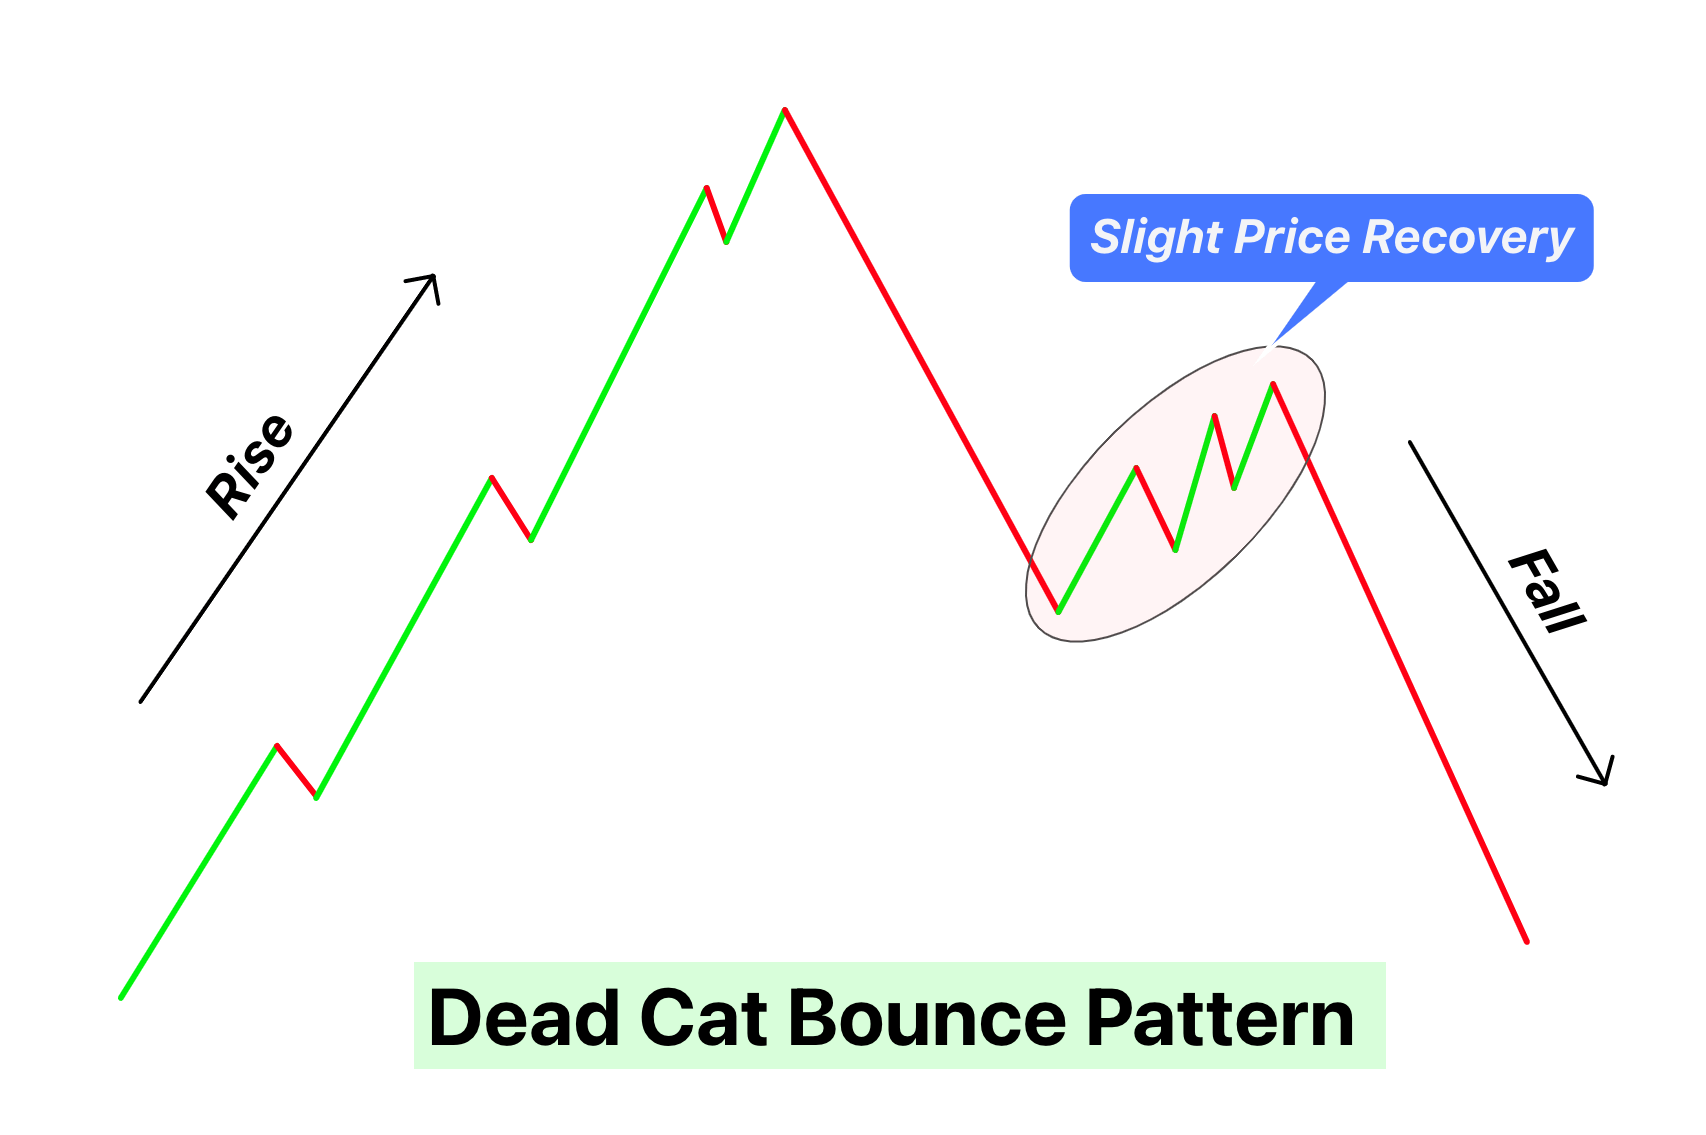
There are many different continuation and reversal patterns to learn to trade the market successfully. you can download the pdf file from the link below.
click here to download the chart patterns PDF
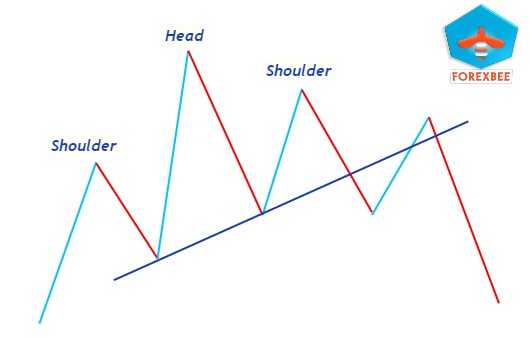
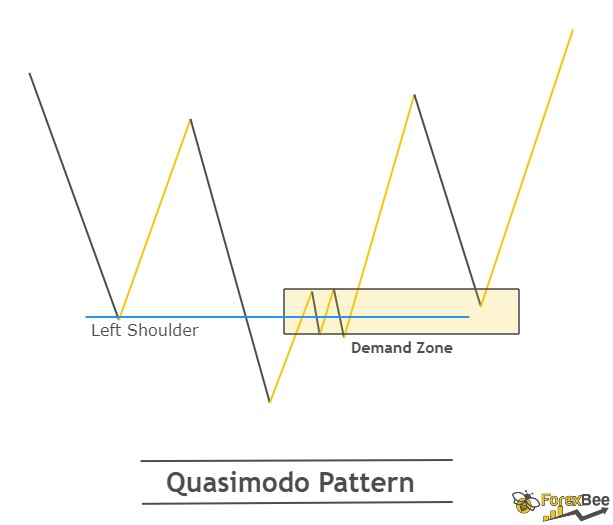
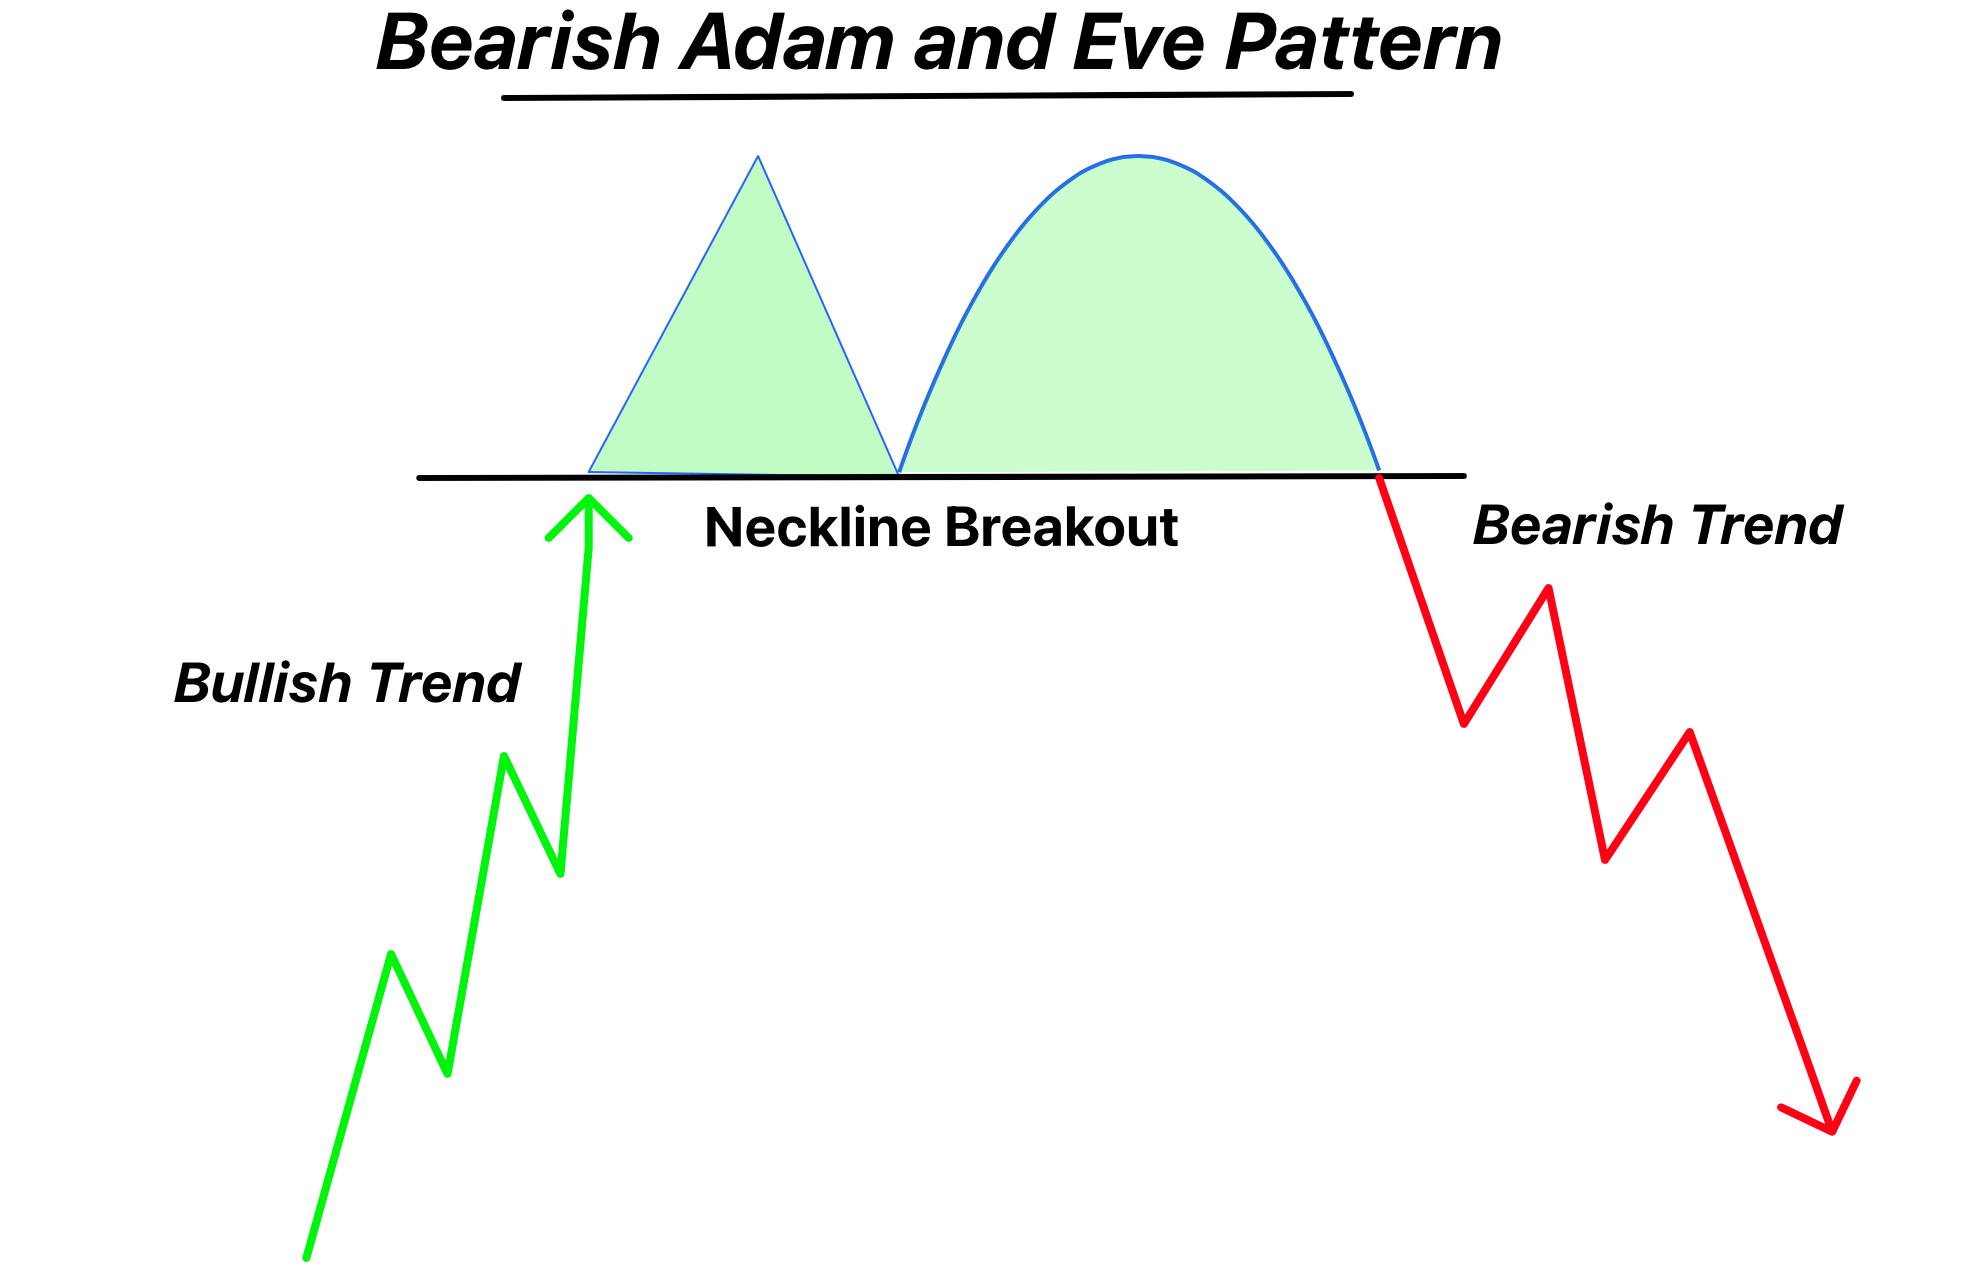
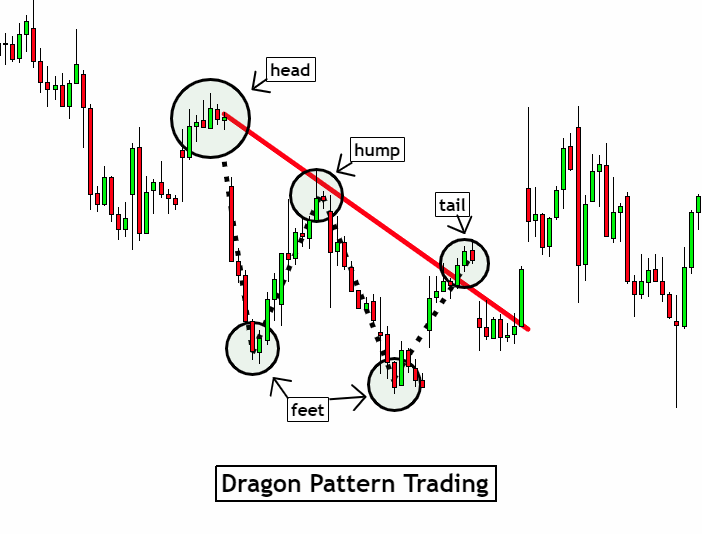
You can also learn each chart pattern online from the table below.
Conclusion
Each chart patternn has been explain with a proper strategy. a trader cannot master all the chart patterns. that’s why i suggest to pick a few chart patterns and then master those. i am sure you will become a better trader.
Nagyon jó
It good