
Definition
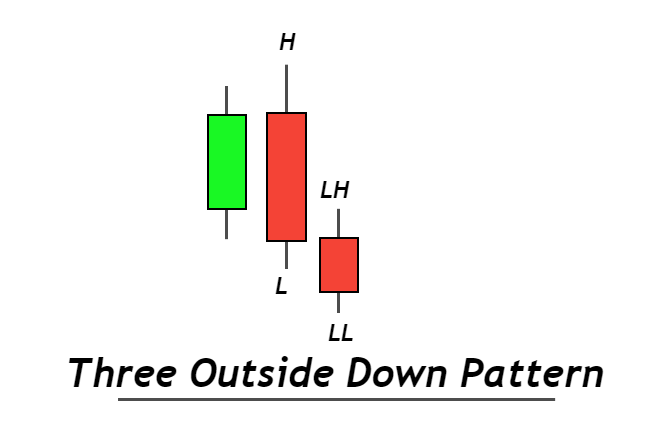
Three outside down is a bearish candlestick pattern that consists of three candlesticks in a specific pattern indicating a bullish trend reversal.
It consists of two patterns that help in confirming a trend reversal
- Engulfing candlestick pattern
- Lower low and lower high pattern
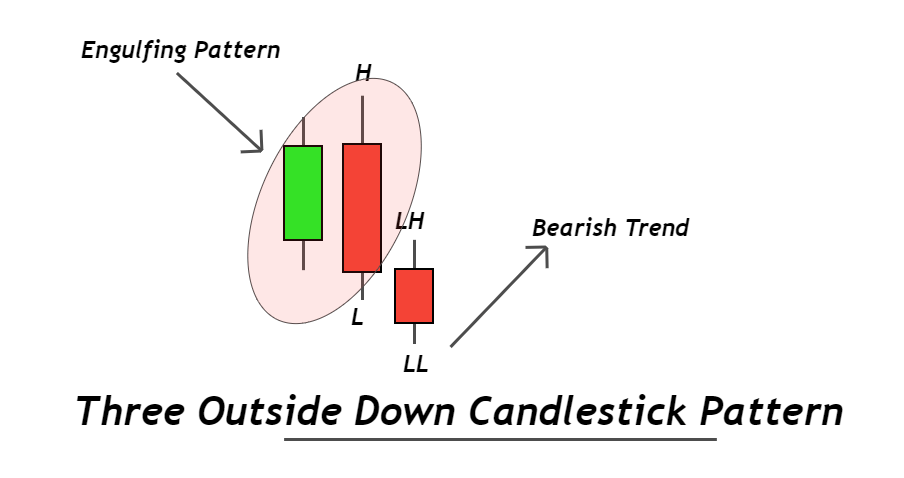
Engulfing candlestick acts as an outside bar and then a small candlestick making a lower low confirms that bullish trend has been changed into a bearish trend. Three outside down is a very useful candlestick pattern because of the confluence of trends.
How to identify three outside down candlestick?
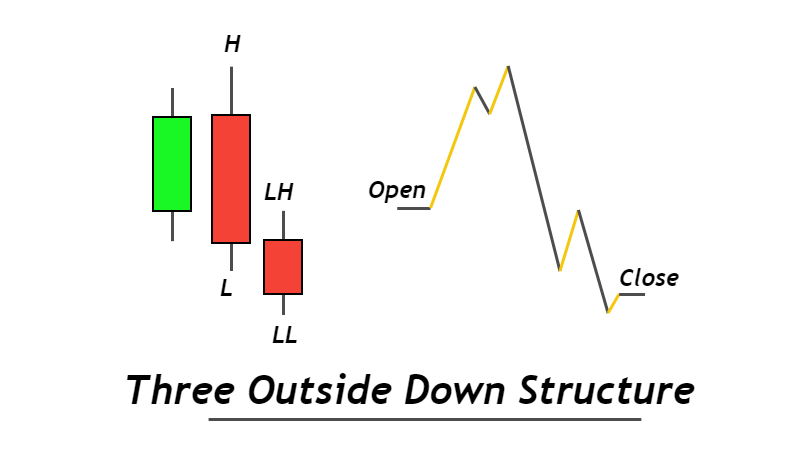
This candlestick pattern is made up of three candlesticks on the price chart. To find an ideal pattern on the price chart, follow the below procedure
- The first step is to identify a perfect bearish engulfing candlestick pattern on the chart. It can also be a outside bar pattern but bearish engulfing is a more powerful pattern
- After confirming engulfing pattern, a bearish candlestick forming lower low and lower high will form on the chart.
- When above two step will comlete then three outside down bearish pattern will form
Many false price patterns form daily on the chart. That’s why you should avoid false patterns.
If an outside or engulfing candlestick has a small body as compared to a wick then you should avoid it. Because large wicks indicate indecision in the market but large body indicates momentum of sellers/buyers.
If a Doji candlestick forms after the engulfing pattern then it will not be a three outside down pattern. Because the Doji candlestick represents a pause in trend and it will not reverse the price trend.
Three Outside Down: Information Table
| Features | Explanation |
|---|---|
| Number of Candlesticks | 3 |
| Prediction | Bearish Trend Reversal |
| Prior Trend | Bullish trend |
| Relevant Pattern | Engulfing candlestick |
What does three outside down tell traders?
Every candlestick pattern on the chart shows the story of trading activity behind the chart. For example, when a bearish engulfing candlestick form then it indicates that sellers have overcome the power of buyers. Now sellers are controlling the market and they want to bring the price down by starting a bearish trend.
Remember that the bearish trend has not been confirmed yet. Engulfing pattern only indicates that sellers have overcome the forces of buyers.
When a bearish candlestick forms after engulfing pattern then a bearish trend confirms. then sellers control the market.

Find High Probability Trades with this ADVANCED Candlestick Patterns Course
The Ultimate Candlestick Patterns Course That Will Help You To Trade Better
Best Trading conditions
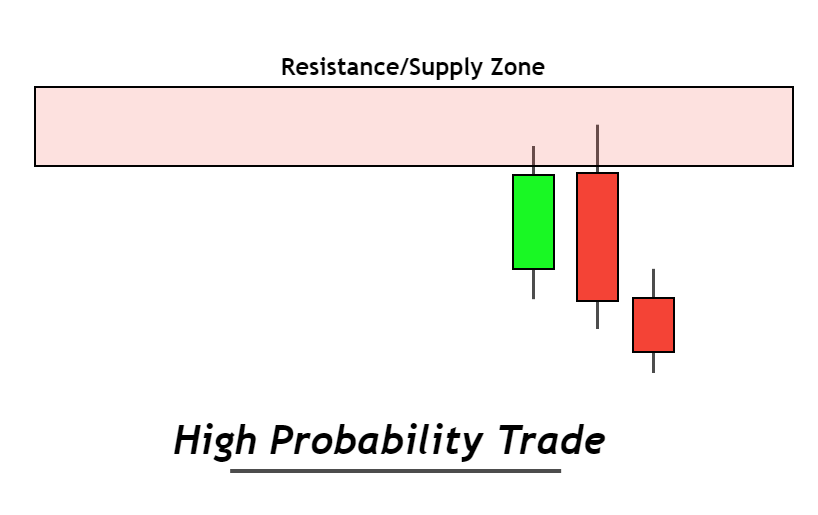
The best trading conditions for three outside down candlestick patterns are the following
- Supply and Resistance Level
- Overbought conditions
When a three outside down candlestick pattern forms at the supply or resistance zone then the probability of trend reversal increases. Because price usually bounces from the ley level.
If the price is in overbought conditions then it has a very high probability of bullish trend reversal. But if a three outside down pattern forms during overbought conditions then the probability of trade winning will also increase.
It is always recommended to filter the best trading conditions to make a powerful trading strategy.
How to trade three outside down pattern?
Any bearish chart pattern or indicator can be used for trading with three outside down candlestick patterns.
Here I will explain a simple three outside down trading strategy by adding some confluences.
Pro tip: You should always make your own unique strategy based on your own rules by filtering odds.
Confluences to add
There are three confluences you need to add in strategy to increase the winning ratio of this candlestick pattern.
- Higher timeframe analysis
- Resistance or supply level
- Fibonacci tool
Open a sell order
After confirming the three outside down patterns, the first step is to identify a bearish trend on a higher timeframe. Because a retail trader should trade in the direction of institutions instead of trading against them.
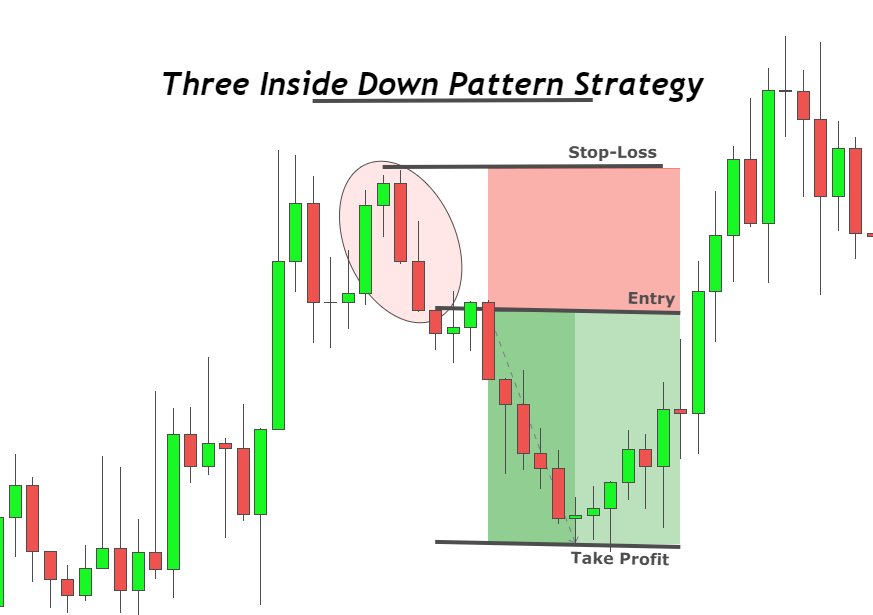
The next step is to check the key level either a Resistance or supply level. These levels will not only increase the probability of a trade setup but also help to adjust stop-loss levels.
After confirming the above two steps, open a sell order instantly.
Stop-loss Level
The Stop-loss level should be placed above the resistance or supply zone. It can also be adjusted above the high of three outside down pattern but a level above the key levels is a safe level.
Take-profit
Fibonacci extension tool is used to find the take profit levels. Draw Fibonacci from entry-level to the high of three outside down pattern and highlight the 1.618 and 2.272 Fibonacci extension levels. These two levels will act as take profit levels.
Risk management
The minimum risk per trade you should take will be 2% of the total account balance (for intraday & swing trading). The risk-reward ratio for this strategy is not high but it has a high winning ratio. You can use this pattern in your own way like using it with a head and shoulders pattern to get a high-risk reward ratio.
The Bottom Line
It is the best way to find out a high probability bullish trend reversal trade setup on the price chart. Technical analysis means to read the price chart technically to know the ideas of institutions.
This is the best method and you will learn to read the market with screen time.
Spare a lot of time for backtesting to learn the patterns of price.