
Candlestick pattern refers to a graphical pattern made by price using OHLC (open, high, low, close) data on the candlestick chart in technical analysis.
These patterns are further classified into two types
- Bullish candlestick patterns
- Bearish candlestick patterns
Best three bullish candlestick patterns
Bullish candlestick patterns refer to candlestick patterns that are indications of an upcoming increase in the price of a certain currency pair in forex. Here indication means forecast. According to the technical analysis, it is a confirmation to place a long position.
I will explain the three most reliable bullish candlestick patterns and how to trade these patterns in technical analysis.
- Bullish pin bar candlestick
- Bullish engulfing pattern
- Morning star pattern
Bullish pin bar
The bullish pin bar is a candlestick that, has a long wick and a small body, indicates buying pressure in a specific currency pair and upcoming reversal in price trend. The pin bar is the best candlestick and there are many secrets hidden within just a single candlestick pattern. The Long-tail of the pin bar is a clear indication of rejection of a certain price level.
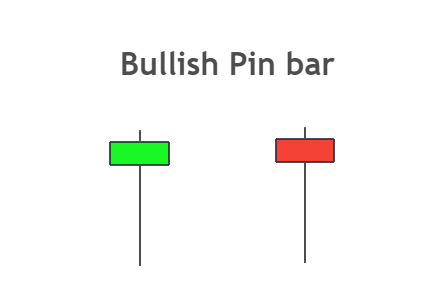
The body of the pin bar must be less than 25% of the total size of the candlestick. In the case of a bullish pin bar, the body must be at the top of the candlestick like in the graphical image above.
Another parameter for pin bar candlestick is that the closing of candlestick must be inside the range of the previous candlestick. It means the price gave a fakeout and then closed inside the previous level.
Fakeout refers to the process of stop-loss hunting by big traders and an indication of an upcoming big move in price
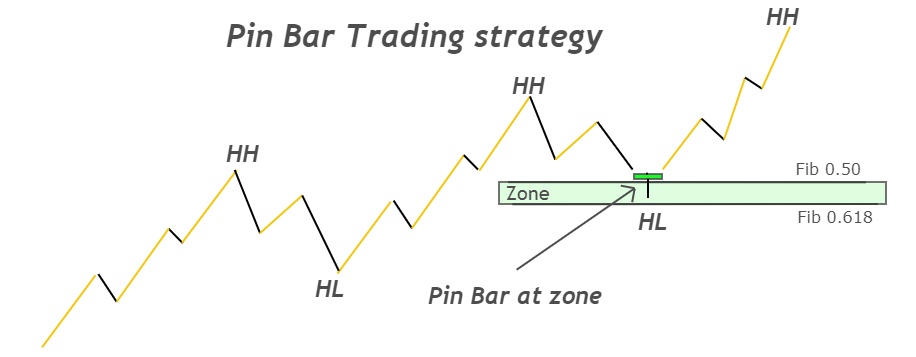
Pin bar strategy
A simple pin bar strategy consists of three simple steps.
- The first step of the pin bar strategy is to determine a bullish trend. The bullish trend means higher highs and high lows formation.
- Draw Fibonacci on the last wave and draw a zone between fibo 61.8 and fibo 50 level using the rectangle tool in tradingview.
- Wait for the formation of a bullish pin candlestick at this zone.
if you are looking at the H1 timeframe chart then you can switch to the m30 or m15 timeframe in search of a pin bar.
Place stop-loss always below the zone or below the pin bar and take profit level at the last high made by price or use Fibonacci extension level 1.618. Try to take some profit and break-even trade to make it risk-free.
Bullish engulfing pattern
A bullish engulfing pattern refers to a candlestick pattern that consists of two candlesticks in which the most recent candle will fully engulf (formation of Higher high and lower low) the previous candlestick. It is a trend reversal pattern.
In most cases, pin bar candlestick also originates from an engulfing pattern in a lower timeframe.
Look at the image below.
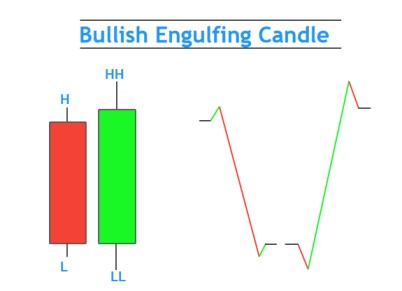
In the engulfing pattern body of the recent candlestick must also cover the body of the previous candlestick. It is a sign of a good and valid engulfing candlestick pattern.
Engulfing pattern strategy
Three easy steps to follow.
- Determine bullish trend (formation of Higher highs and Higher Lows)
- Use the Fibonacci tool on the recent impulsive move and draw a zone between Fibonacci 68.1 and 50 levels.
- Wait for the formation of engulfing pattern at this zone.
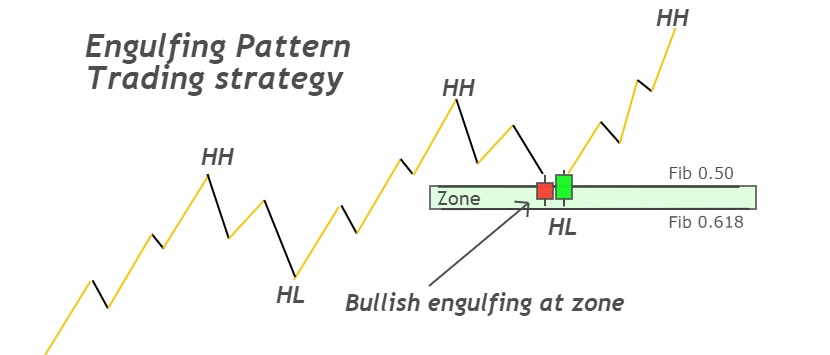
Entry-level will be just after the formation of engulfing candlestick pattern at zone.
The Stop-loss level will be below the zone always or below engulfing pattern (choose the safest option). It also depends on the situation.
Morning Star Candlestick Pattern
Morning star pattern is a candlestick pattern that consists of three candlesticks
- Big bearish candlestick
- Doji candlestick
- Big bullish candlestick
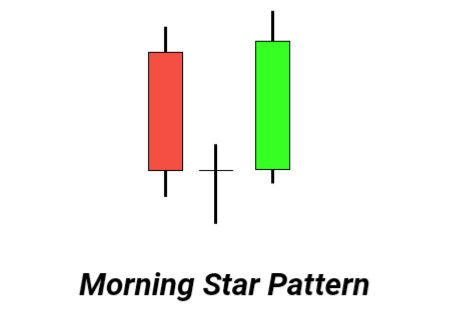
It is a reversal candlestick pattern. Formation of Doji candlestick just after big bearish candlestick indicates that after a bearish trend, now price is moving sideways in order to make a decision (either to go further down or to change the previous trend). After the Doji candlestick, the formation of a big bullish candlestick proves that market makers have decided to change the previous trend.
Morning star pattern trading strategy
Follow three simple steps and trade this candlestick pattern with the trend.
- Determine bullish trend (formation of at least two higher highs and higher lows)
- Draw a zone between Fibonacci 68.1 and 50 levels.
- Wait for the formation of the morning star pattern at this zone and place order just after the formation of this pattern at zone.
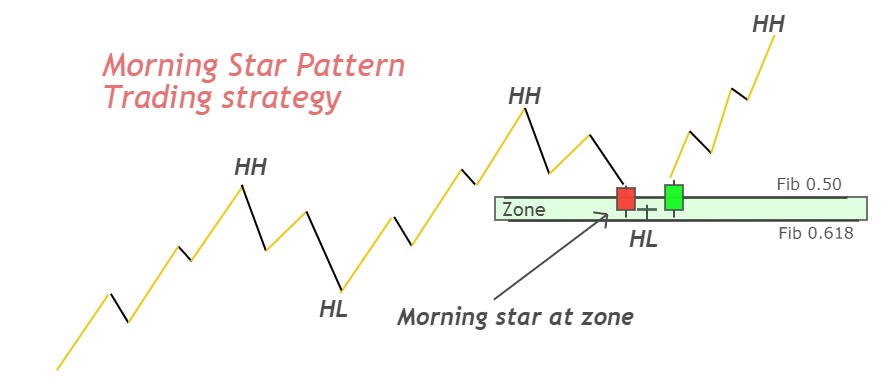
The Stop-loss level will be below the zone or below the candlestick pattern. Go with the safest option.
Money is just something you need in case you do not die tomorrow.
Yvan Byeajee
I hope you will like this Article. For any Questions Comment below, also share by below links.
Note: All the viewpoints here are according to the rules of technical analysis and for educational purposes only. we are not responsible for any type of loss in forex trading.