
what is MACD 4C indicator?
MACD 4C is defined as a modified and derivative indicator from the traditional Moving Average Convergence Divergence indicator (MACD).
It is an advanced form of the MACD indicator as it uses a better color scheme. This indicator provides essential information to traders about the nature of future market trends. MACD 4C also facilitates traders for the identification of change in the momentums of the market.
In the current trading scenario, technical traders are dominating the market with a better success ratio. To succeed in the trading universe, technical traders use different types of indicators. These indicators help them to understand the market trends. These signals also provide sufficient information about entry and exit points.
MACD is one of the most reputed and revered indicators in the trading world. The upgrade of the traditional MACD is MACD 4C indicator.
The salient features of MACD 4C are,
- Use of a histogram to indicate the market trend.
- Use of four colors to provide better information.
- It is a vastly used tool to identify the bullish and bearish nature of the market.
- It can aid a trader in determining an entry and exit point, thus helping the buy and sell of the assets.
- This indicator provides the luxury to use it for multiple currency pairs.
- A trader can use this indicator in customized settings according to his/her needs.
How to use the MACD 4C indicator?
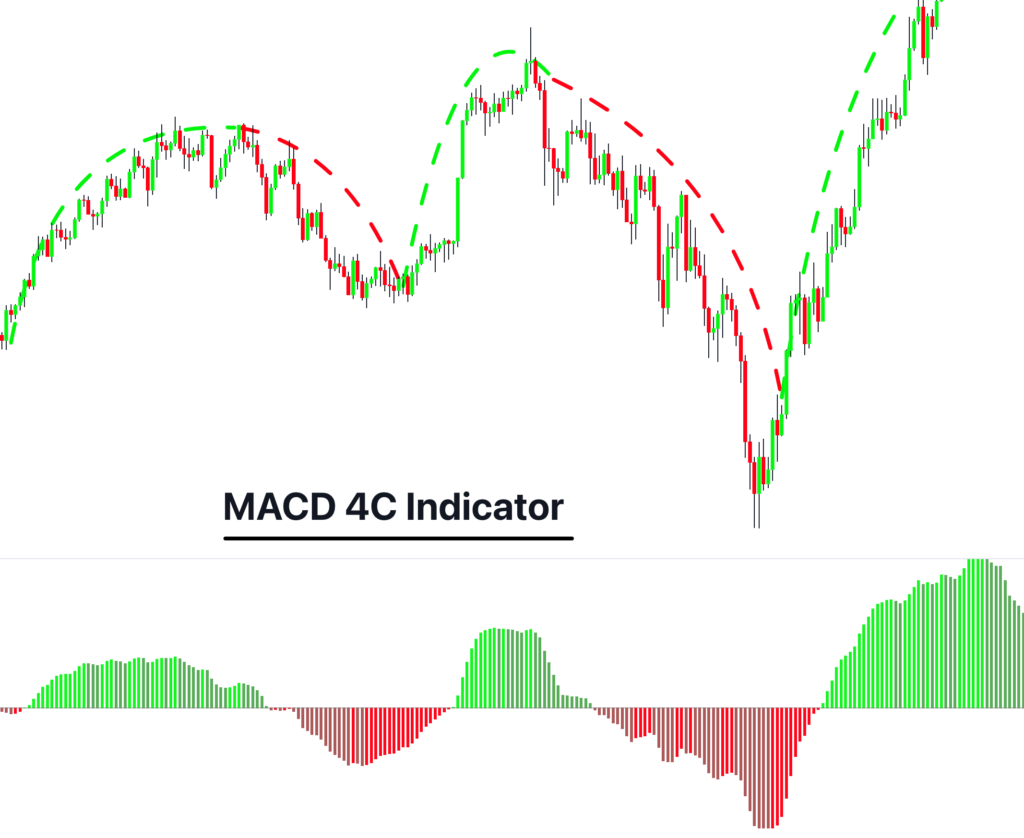
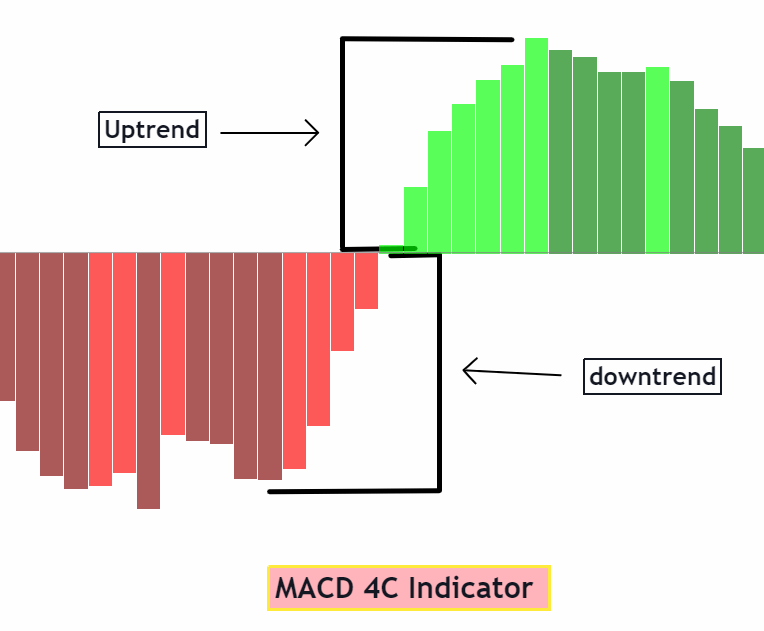
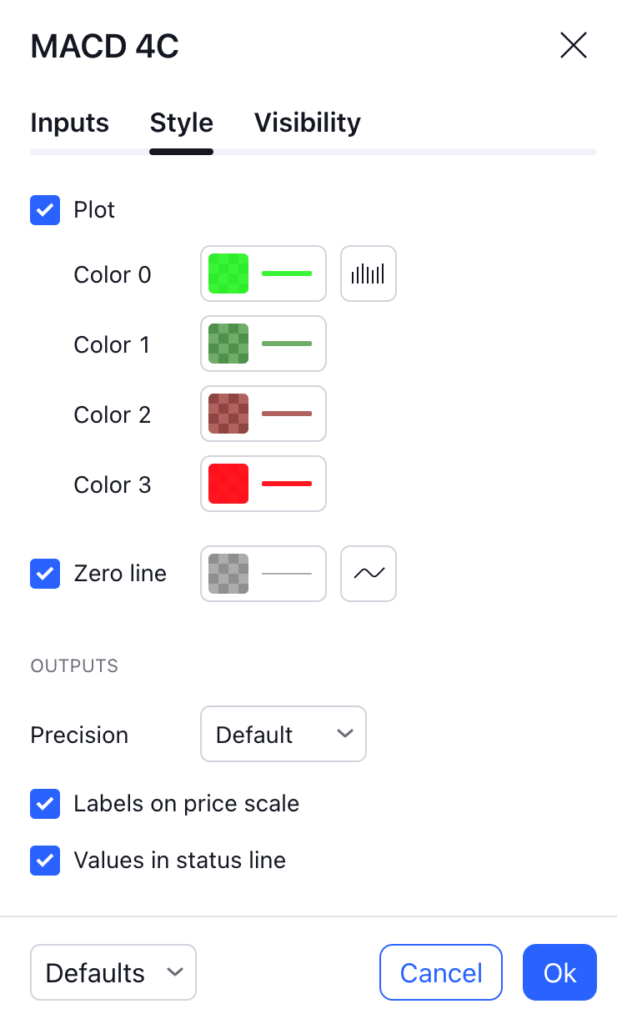
It is very convenient and easy to use a MACD 4C indicator. This is made possible by the use of 4 different colors. This indicator is usually represented in the histogram form.
Two colors represent the trend when it is above the zero line. On the other hand, two colors represent the movement of the trend below the zero line.
These four different colors provide us with different information. By understanding the scheme of colors of the histogram of this indicator, one can understand the market trend.
Color 1:
It indicates the formation of a bullish trend in the market. When bulls begin to dominate a market, the number of buyers begins to rise.
Color 2:
It represents the continuation of the bullish trend in the market. In a volatile market, the prices can exhibit a significant change. So, the identification of the continuation of the prices can provide valuable information to a trader about the market sentiment.
Color 3:
It represents the formation of a bearish trend. It is the time when bears begin to regain power and are ready to take on the bulls. As the bears regain power, the number of sellers begins to increase.
Color 4:
It represents the continuation of the bearish nature of the market. The continuation is essential to determine the strategy of trade in terms of selling.
Once you understand the color pattern, you are ready to use the MACD 4C indicator. I will further explain the use of this indicator below in the trading strategy.
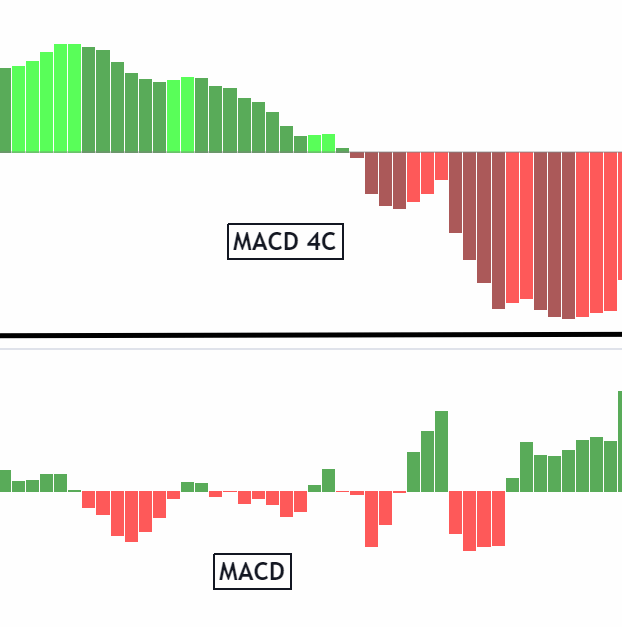
MACD 4C vs. simple MACD
MACD 4C is considered an upgrade of the traditional MACD indicator. The improvements offered by MACD 4C to a simple MACD are given below in the table.
| Features | Simple MACD | MACD 4C |
| No. of colors for the bullish trend | 1 | 2 |
| No. of colors for the bearish trend | 1 | 2 |
| No. of histogram colors | 1 | 4 |
| Display of Bullish continuation pattern | No | Yes |
| Display of Bearish continuation pattern | No | Yes |
| Accuracy in a volatile market | Produces several false signals | Much accurate |
| User friendly | Moderate level | Very friendly |
MACD 4C is a significant improvement over traditional and simple MACD indicator. The better color scheme makes it earlier and more convenient to use and understand. The feature of exhibiting a continuation pattern of the trend provides valuable information to traders about avoiding false signals. 
Best settings that a trader should use
MACD 4C indicator is a very user-friendly and easy to eyes indicator. A trader can customize the settings of this indicator to take maximum advantage according to his choices and preferences.
There are two inputs for the indicator.
- Slow moving average
- Fast moving average
The slow-moving average value is 12 and fast moving average value is 26.
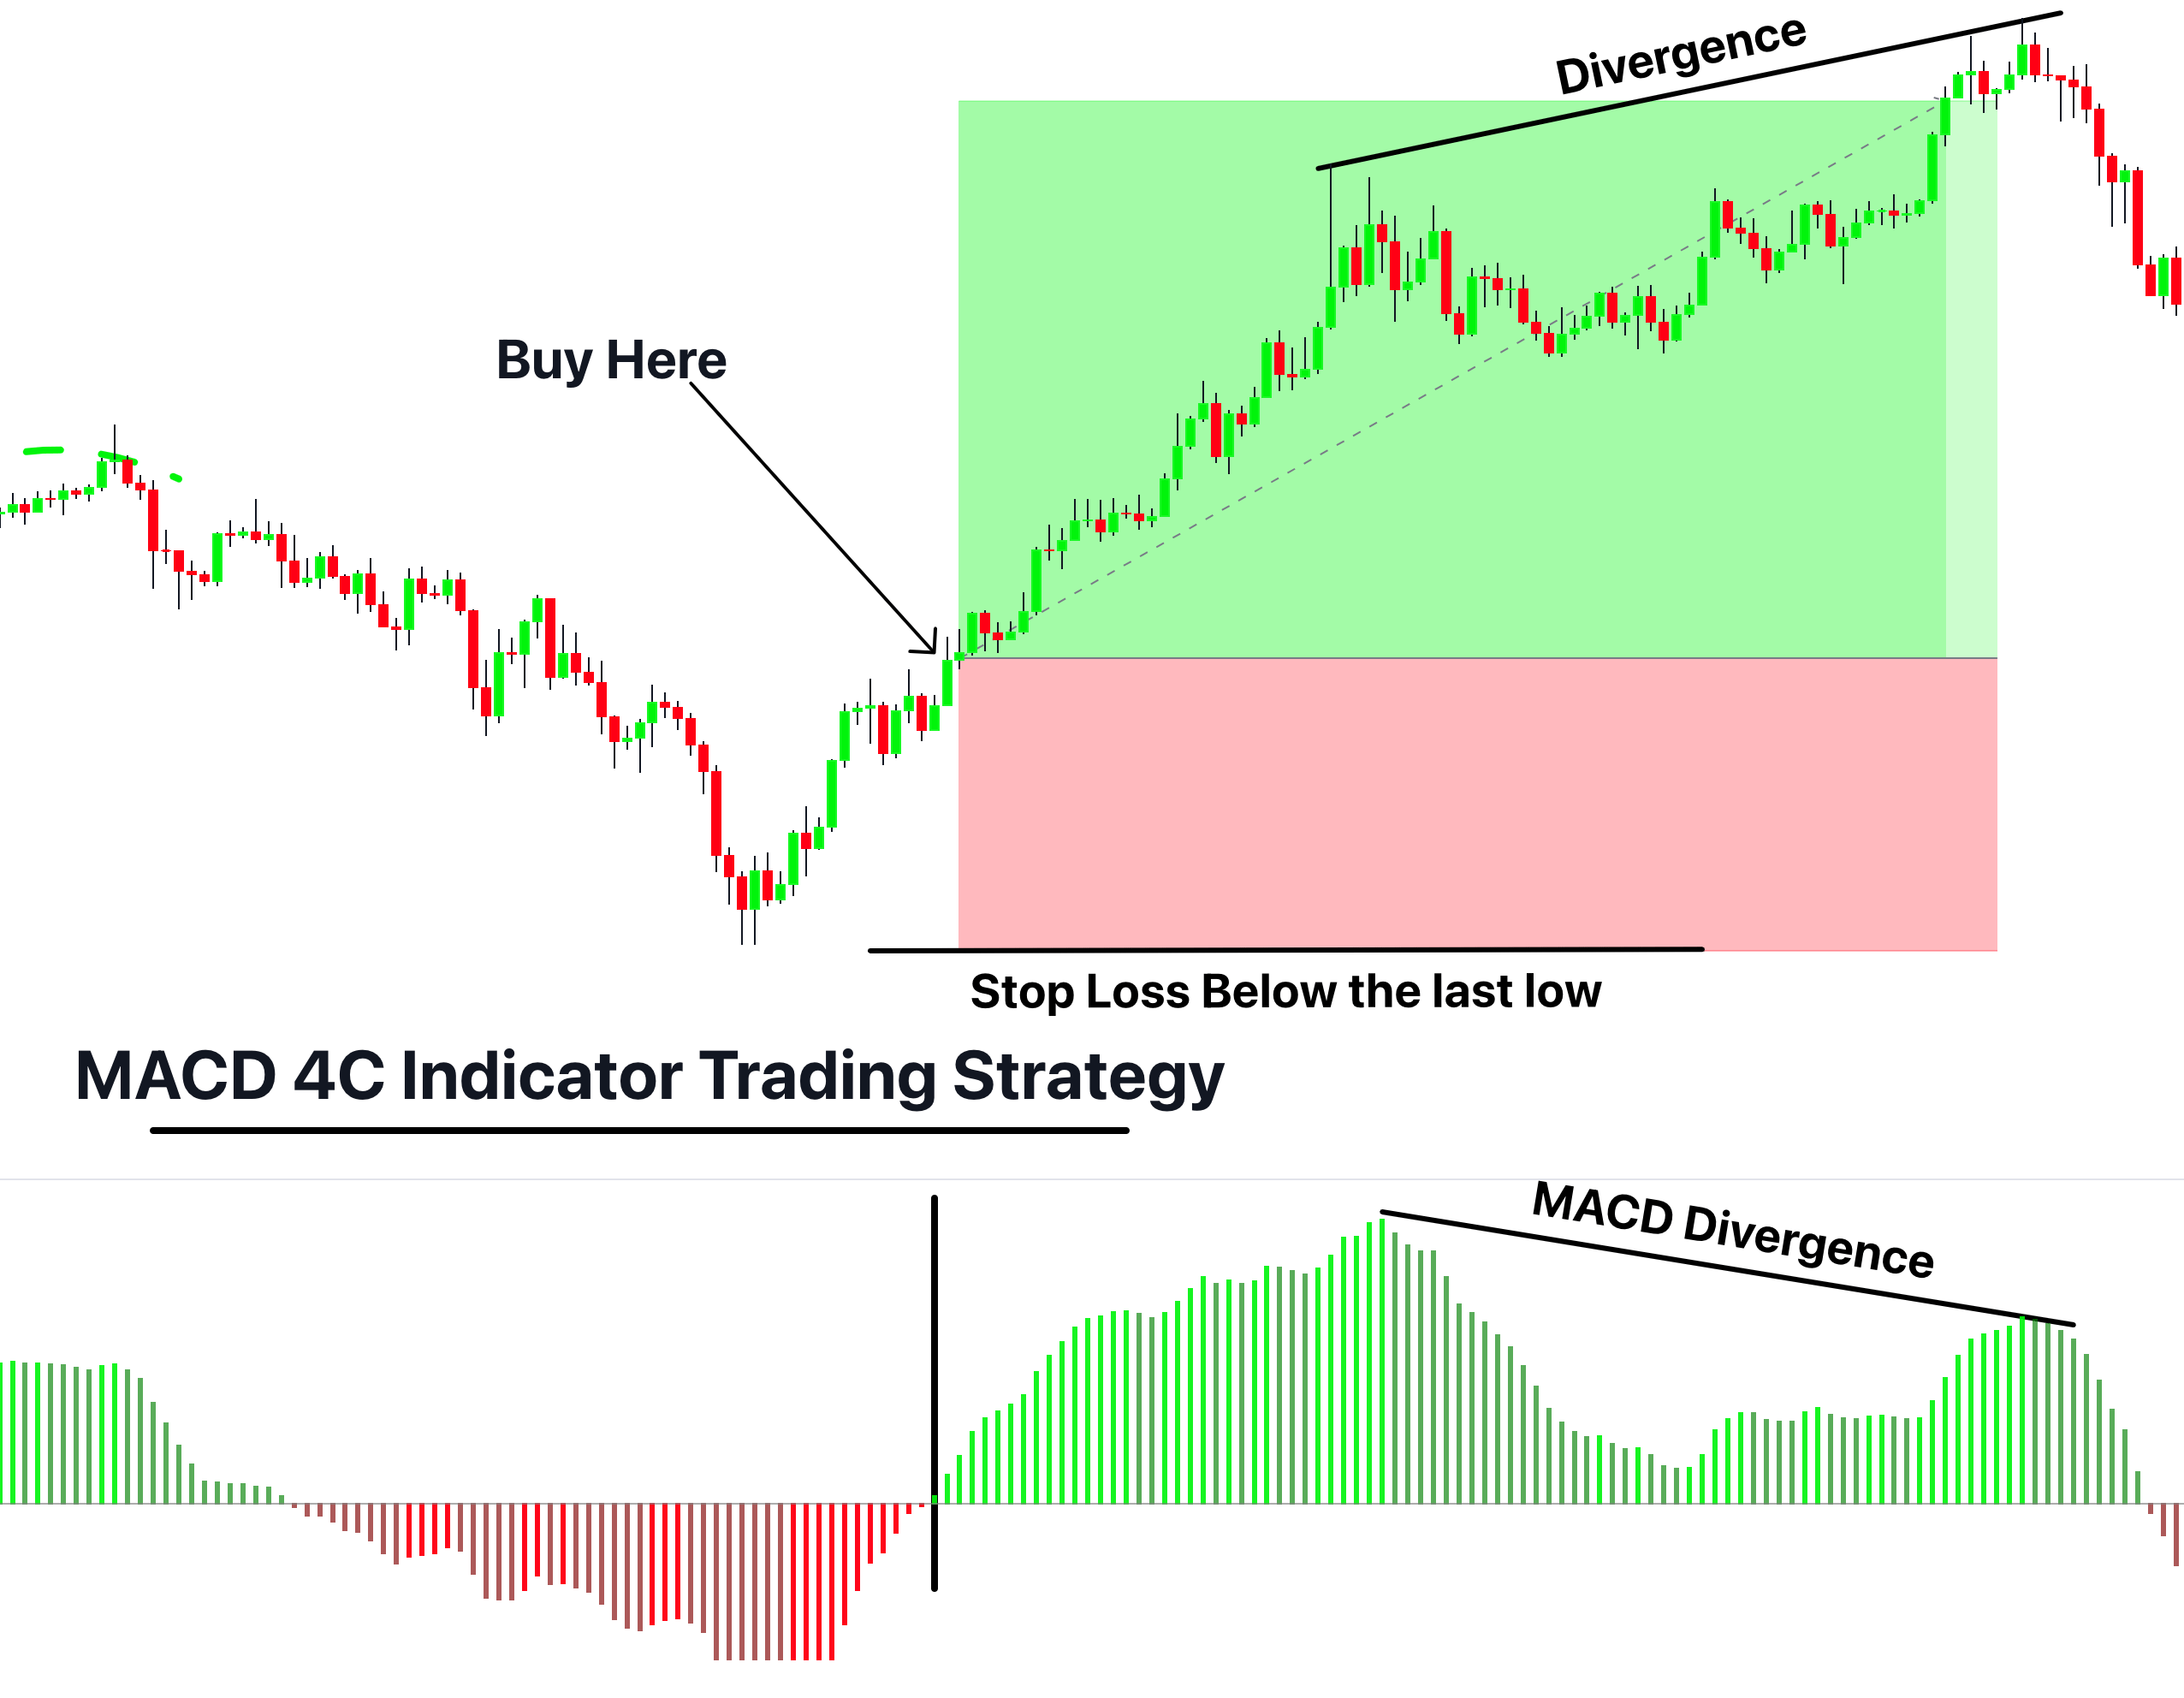
MACD 4C trading strategy
One can formulate his/ her trading strategy by using the MACD 4C indicator. The trading strategy of the MACD 4C indicator is given below.
Entry
Opening of trade is divided into two stages,
- When the bullish trend of the indicator moves above the zero line, the continuation of the trend is visible. You can buy an asset.
- As the bearish trend of the indicator moves below the zero line, the time is suitable for selling your assets.
Stop loss
Place the stop loss below/above the recent swing low or a key level to protect the trade.
Take profit
For closing the trade, we will look for the formation of divergence on the price chart against the trade. For example, if you opened a buy trade then you will close the buy trade when a bearish divergence will form.
This is the most effective way to hold a trade longer and get the maximum profit from the trade using MACD 4c indicator.

Drawbacks of MACD 4C
The drawbacks of this indicator are,
- This indicator might delay the process of signaling, creating a lag by showing the past prices. This lag leads to miss opportunities.
- There are certain limitations to this indicator, as it can create false signals.
- In a volatile and fast-moving market where a solid trend continuation is missing. The MACD 4C can create several false signals.
The bottom line
MACD 4C is definitely an upgrade to the simple MACD indicator. It provides sufficient information about the continuation of a trend of both natures (bullish and bearish). Though MACD 4C is a user-friendly and convenient indicator, I will not recommend using it alone. I suggest you use this indicator with the confluence of other trading tools to boost your trading experience.