
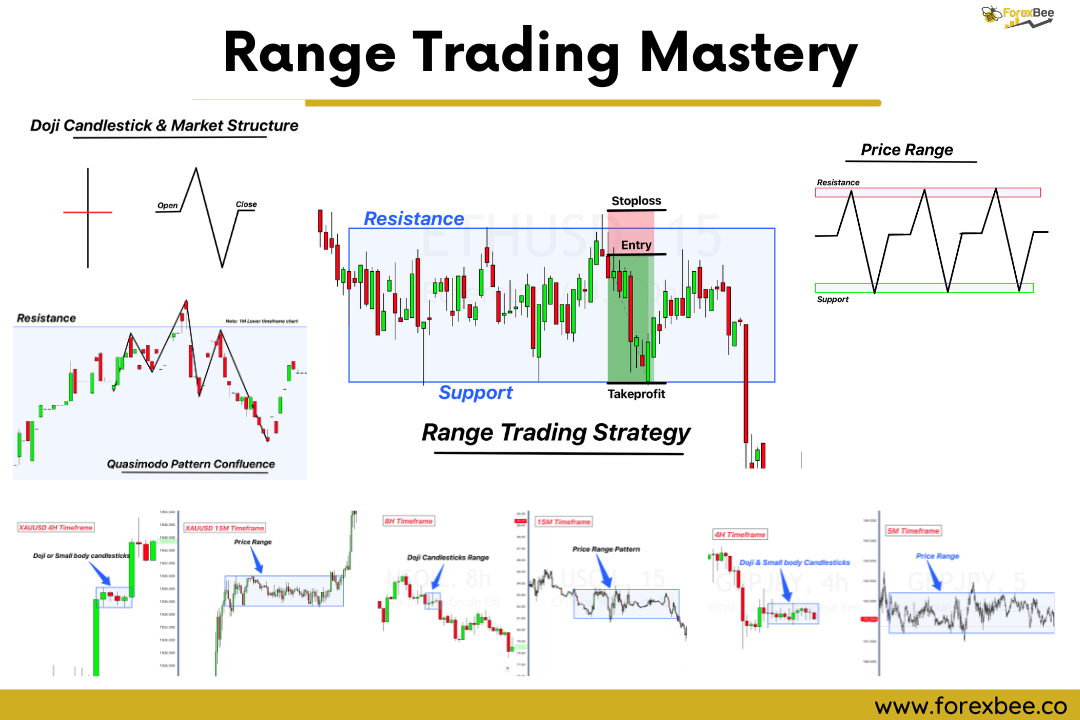
A Doji candlestick, When observed on higher timeframes, it often corresponds to a price range on lower timeframes. Both doji and price range represent trend pause and market indecision.
Essentially, these two patterns reflect the same market dynamics, differentiated only by the timeframe in which they appear. In this article, we will explore the dual roles of the Doji: its function as a candlestick and its implication as an indicative price range.
Based on these observations, we’ll also discuss practical strategies to trade the ranging market and delve into related price action concepts that are crucial for traders.
Structure and Purpose of Doji and High Wick Candlesticks
A Doji candlestick is easily identified by its opening and closing prices being the same. This reflects a balance between buyers and sellers in the market during that period. Often, a Doji will have long wicks, indicating a wide price movement within the candlestick’s timeframe, a clear sign of high volatility.
High wave candlesticks are similar to Doji but with a small body and large wicks. These wicks show price swings during the period, suggesting a high level of market uncertainty.

When multiple Doji or high wave candlesticks appear in succession, it often signals a range formation in a lower timeframe. This grouping means the market is in a pause or consolidation phase, indicating traders are waiting before making a decisive move.
What are Market Boundaries and Price Range in Trading?
Range Trading (or Price Range): Range trading is a trading strategy where a trader aims to capitalize on the predictable price movement between two defined levels: the support and resistance. These levels act as the market’s boundaries.
In range trading, the upper level, known as the resistance, and the lower level, termed the support, serve as the primary boundaries within which price tends to oscillate. The majority of the price action in range trading remains confined between these two critical boundaries.

The fundamental principle in range trading is straightforward: traders look to buy or enter long positions when the price approaches the support level and sell or enter short positions when it nears the resistance. By doing so, traders aim to capture the maximum possible profit from the predictable price swings within the range.
Comparing Doji Candlesticks and Price Range Pattern
At their core, both Doji candlesticks and range trading revolve around the concept of equilibrium in the market forces.
A Doji candlestick has the same opening and closing prices. This indicates a balance between buyers and sellers in that specific timeframe.
Range trading reflects a similar balance but over a longer period. Here, price moves between support and resistance levels, showing the equal influence of buyers and sellers. Price stays within these levels because neither buyers nor sellers take full control.

In essence, while Doji represents this balance in a single candlestick, range trading shows it across a chart pattern. Both patterns are rooted in the same principle: a balanced market.
Activity of Market Makers During Formation of Doji Candle and Price Range Chart Pattern
Both Doji candlesticks and range trading emphasize the market’s state of balance.
A Doji candlestick, with its identical opening and closing prices, pinpoints a momentary equilibrium between buyers and sellers for that specific timeframe. On the other hand, range trading, where prices fluctuate between support and resistance levels, portrays this equilibrium over an extended duration. The guiding principle is a market where neither the buyers nor the sellers have a distinct advantage.
To further elucidate this concept, let’s use a practical example:
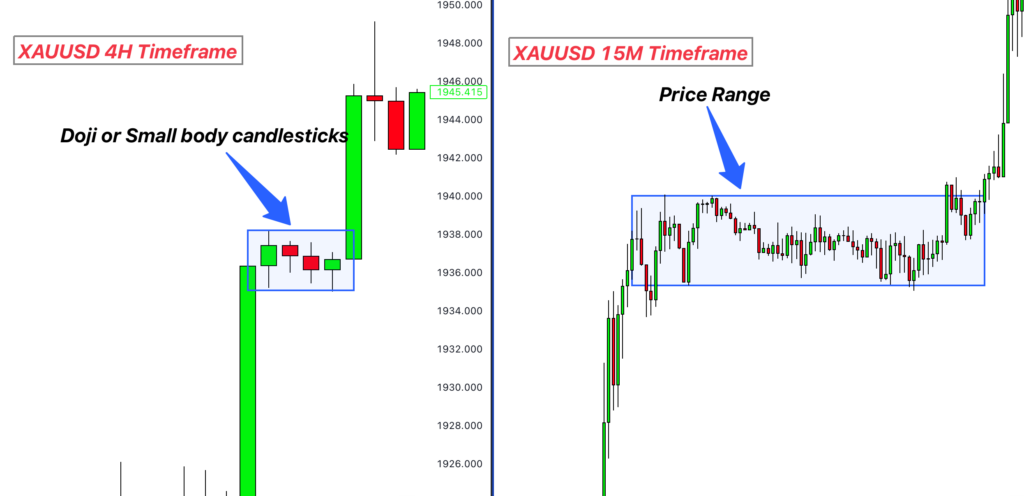
Consider the XAUUSD chart on a daily timeframe. Suppose you observe three consecutive candlesticks, each having a small body and prominent wicks. This pattern indicates a pause or consolidation in the prevailing trend.
Now, when you switch to a lower timeframe (15 minutes) for the same asset (XAUUSD), a clear price range becomes evident, defined by its upper and lower boundaries.
Despite their differing visual representations on charts, the underlying market activities during the formation of a Doji candlestick and a price range pattern remain consistent. The primary distinction is the timeframe in which they’re observed. The intent of this article is to emphasize this unique insight: two patterns, different names, but originating from the same market dynamics.
Visual Insights: Doji and Range Dynamics Examples on Chart
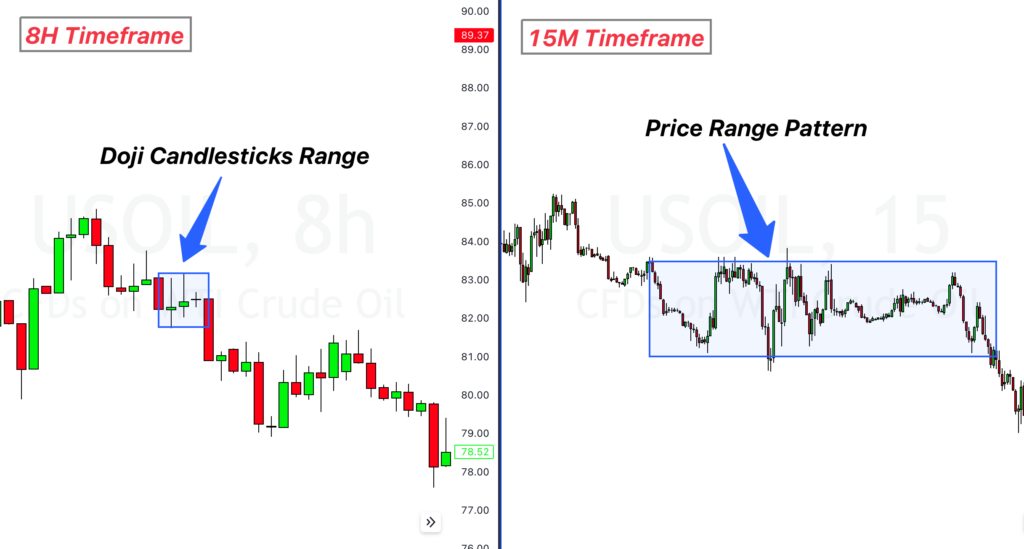
US Oil Example: On the left, the 8-hour US Oil chart presents three Doji and small body candlesticks, indicating market uncertainty. Right next to it, the 15-minute chart transforms this uncertainty into a clear price range. This combined view reinforces how a Doji on one timeframe can manifest as a range pattern on another.
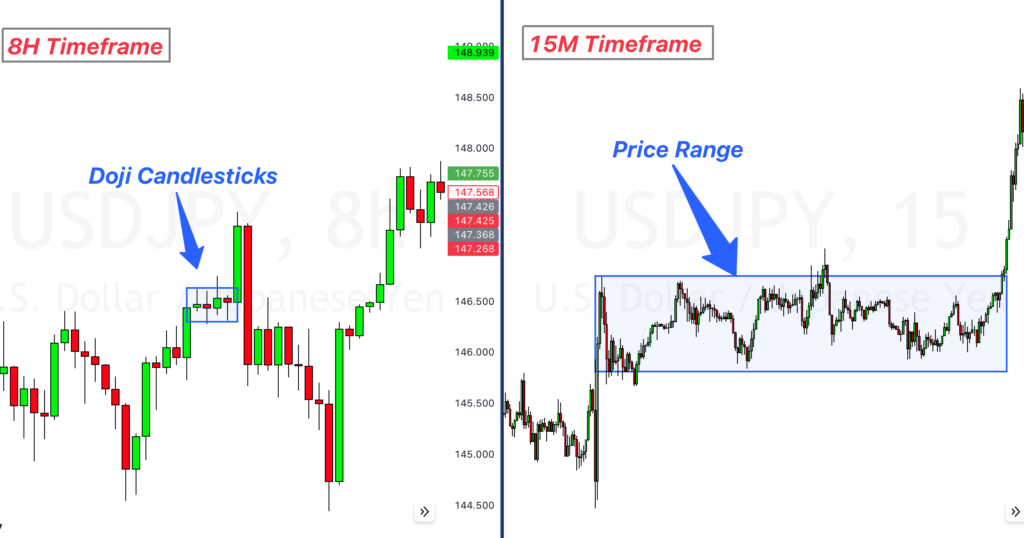
USDJPY Example: On the 8-hour USDJPY chart image below, we see four highlighted Doji and small body candlesticks, showing a pause in the market. Right next to it, the 15-minute chart presents a clear price range. This side-by-side view showcases how Doji patterns on a longer timeframe can point to a range on a shorter one.
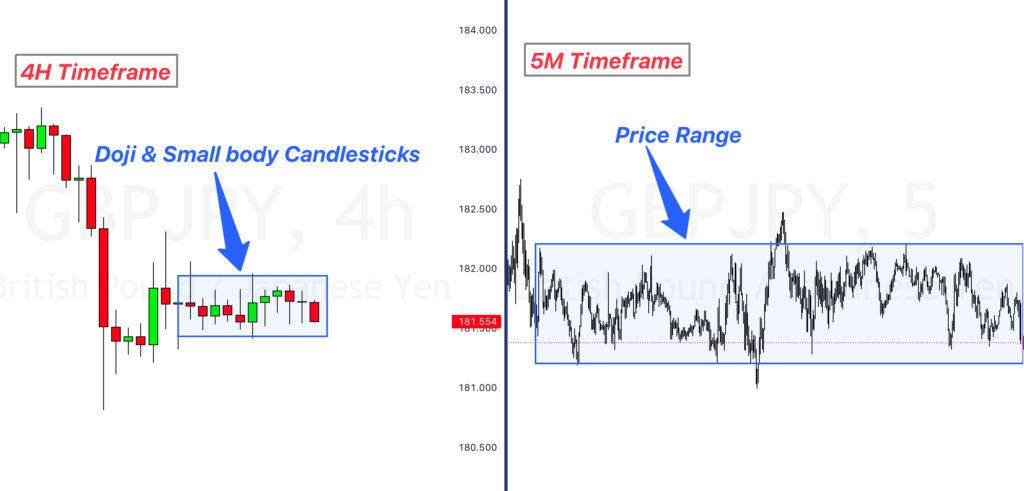
GBPJPY Example: On the 4-hour GBPJPY chart image below, there’s a sequence of 10 highlighted Doji and small body candlesticks, indicating a market standstill. Directly adjacent, the 5-minute chart reveals a significant market range. This visual comparison highlights how multiple Doji patterns on a medium timeframe can signal a broad range on a much shorter one.
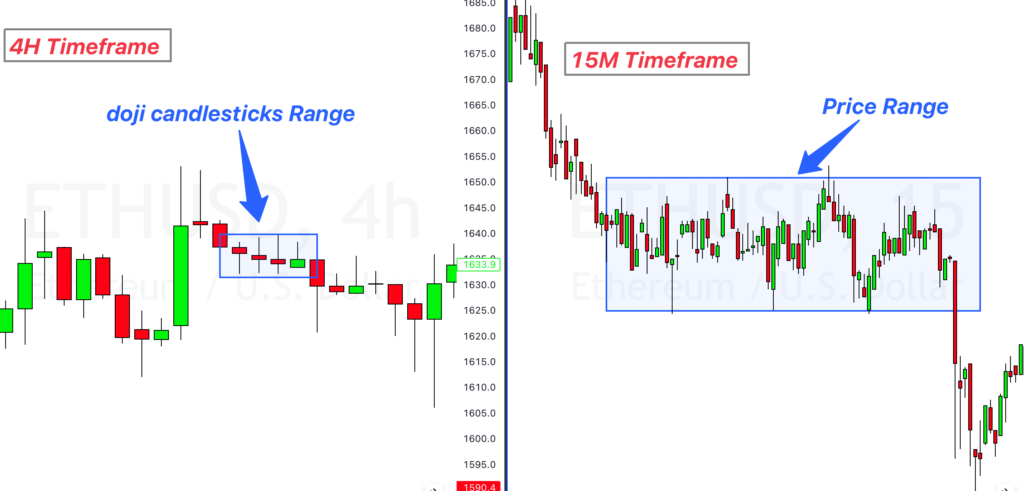
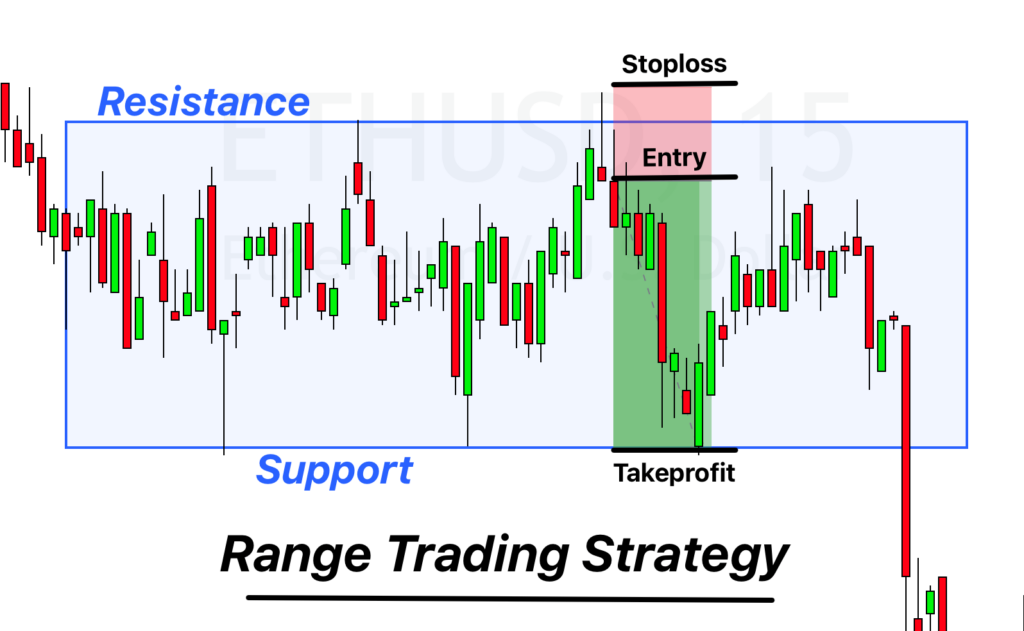
ETHUSD Example: On the 4-hour ETHUSD chart image below, we see four Doji candles. Beside it, on the 15-minute chart, there’s a clear price range. This shows that Doji patterns on a longer chart can hint at a price range on a shorter one.
The Role of Price Range in Trading
Price ranges play a pivotal role in the trading landscape. They offer clear visual cues, marking zones where traders are likely to open or close positions. Specifically, these ranges demarcate areas where buying or selling pressure is predominant.
Trading within a range-bound market can be straightforward. The challenge, however, lies in accurately identifying these price ranges. Many traders stumble here, and inaccuracies in spotting these ranges can lead to losses.
Within a price range:
- Resistance represents an area dominated by sellers. As the price nears this level, an influx of selling activity typically drives the price downwards.
- Support, conversely, is a zone where buyers are prevalent. When the price approaches support, buying activity often intensifies, pushing the price upwards.
In essence, the primary role of price ranges in trading is to provide traders with key areas of interest, allowing them to anticipate potential price movements based on the prevailing buying or selling pressure.
Four Confluences to add with price range trading
Trading in a range is all about buying at the low point (support) and selling at the high point (resistance). But to improve your success rate, it’s a good idea to look for extra signs, or “confluences”, before you trade. Here are a few strategies:
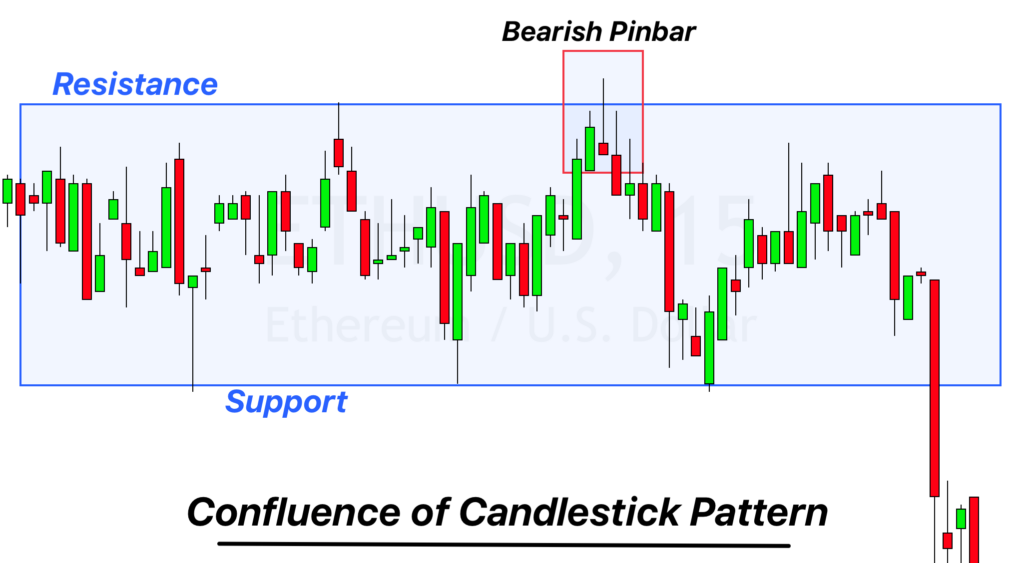
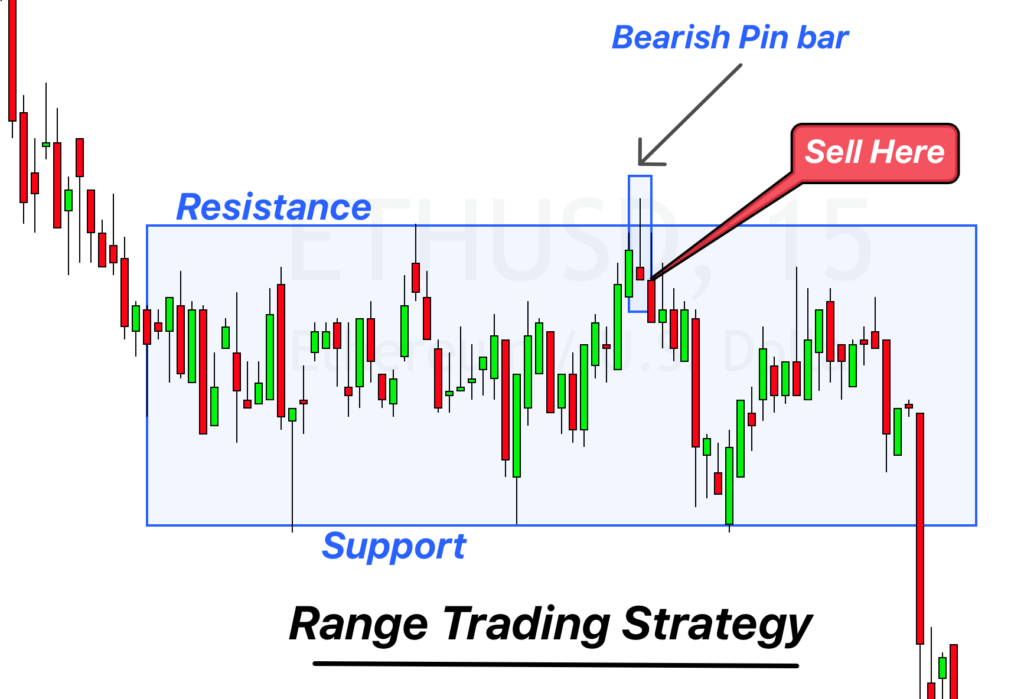
1. Reversal Candlestick Patterns
- At Resistance: If the price is near the top of the range and you see a bearish engulfing candle, it might be a good time to sell.
- At Support: If the price is near the bottom and a bullish engulfing candle forms, consider a buy.
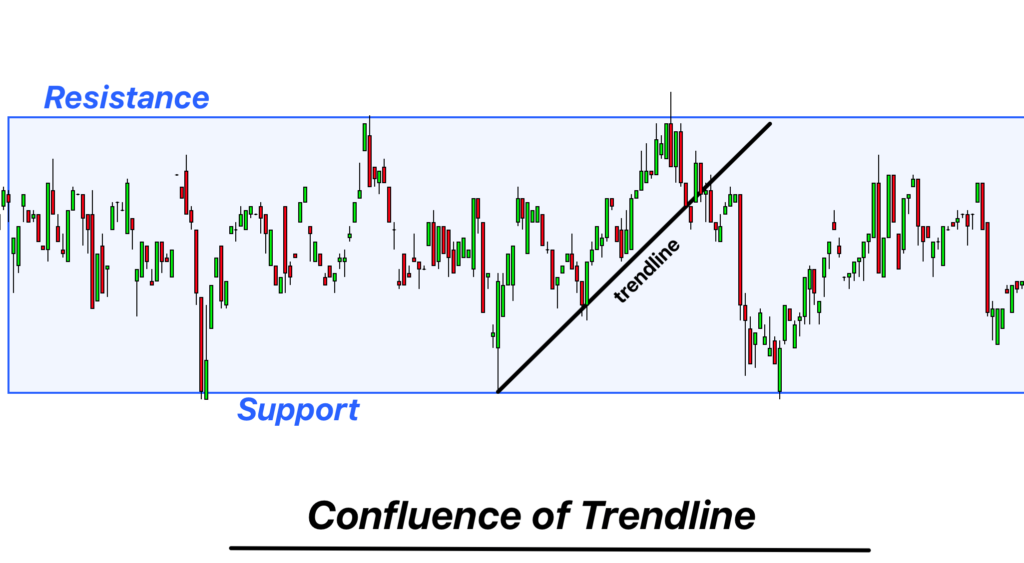
- Sell Setup: Draw a line following the price as it moves up from support to resistance. If the price breaks below this line, think about selling. The starting point of the line could be where you aim to take profit.
- Buy Setup: If the price moves down from resistance to support, draw a line. A break above could be a buy signal.
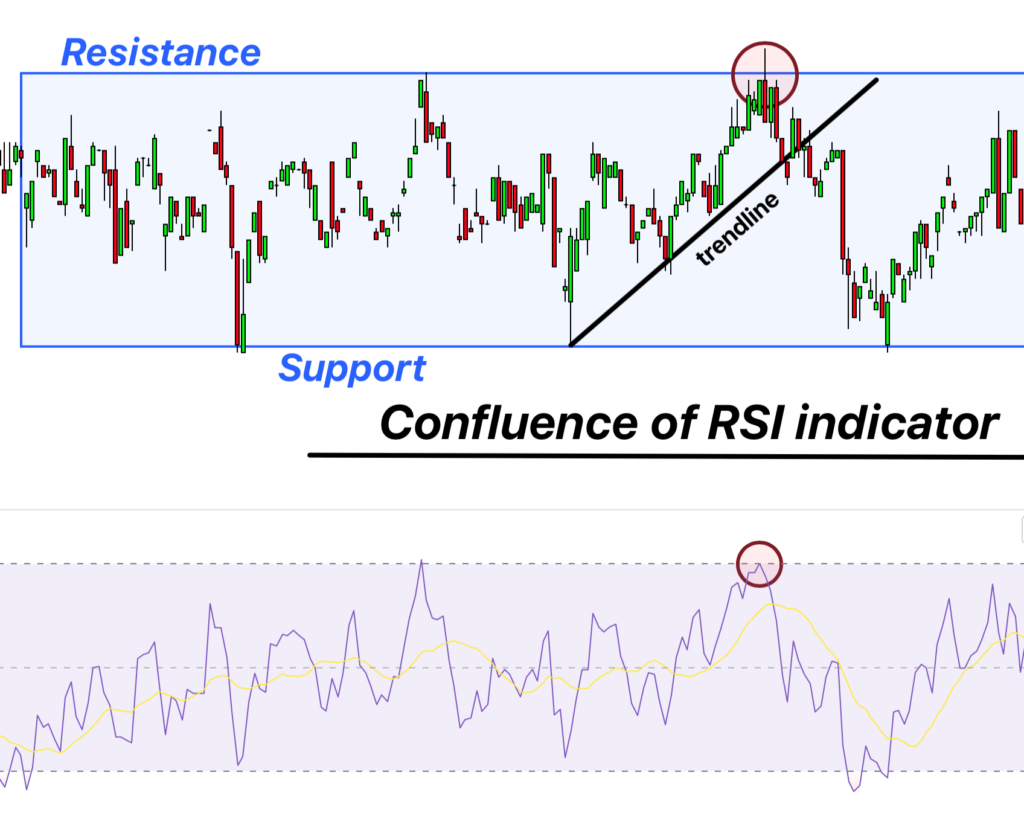
3. RSI Indicator
The Relative Strength Index (RSI) measures the speed and change of price movements and ranges from 0 to 100. It’s especially useful in identifying overbought or oversold conditions in the market.
- Sell Signal: When the price is near resistance and the RSI reads above 70, it indicates that the asset might be overbought. This could strengthen the case for a sell trade.
- Buy Signal: Conversely, if the price is hovering around support and the RSI dips below 30, it suggests that the asset might be oversold, possibly making it a good time to buy.
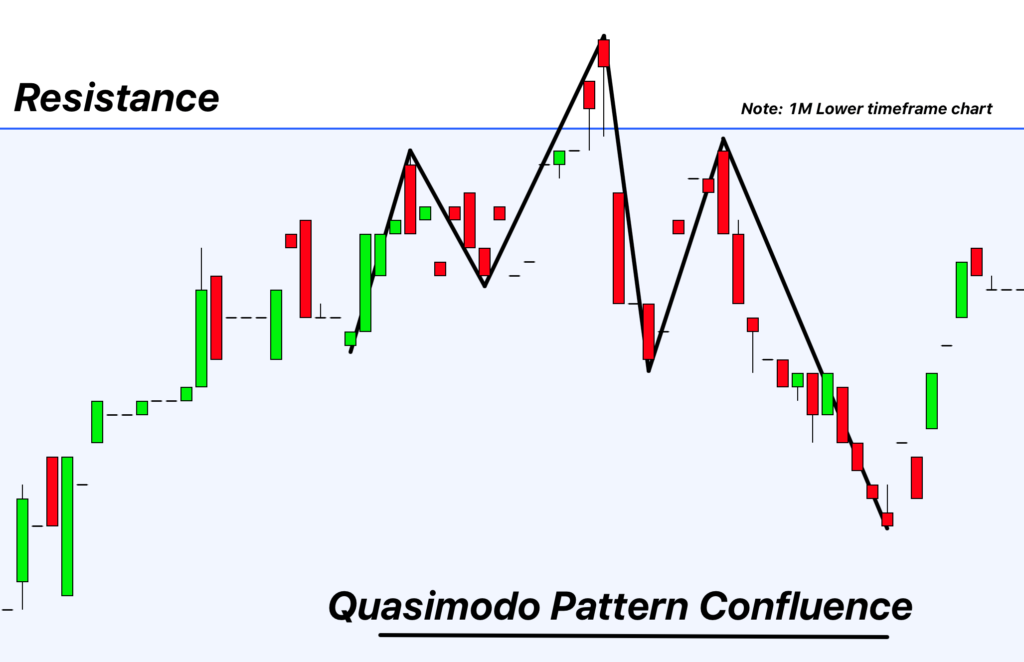
4. Reversal Chart Patterns
These patterns can provide visual confirmation of potential price reversals in the market.
- Sell Setup: The ‘Head and Shoulders’ pattern forms after an uptrend and indicates potential downward momentum. If this pattern appears at resistance in a range, it strengthens the argument for a sell. It consists of three peaks: the left shoulder, the head (highest peak), and the right shoulder.
- Buy Setup: The ‘Inverse Head and Shoulders’ is the opposite and forms after a downtrend, indicating potential upward momentum. If spotted at support in a range, it suggests the possibility of a buy. Like its counterpart, it has three troughs: the left shoulder, the head (deepest trough), and the right shoulder.
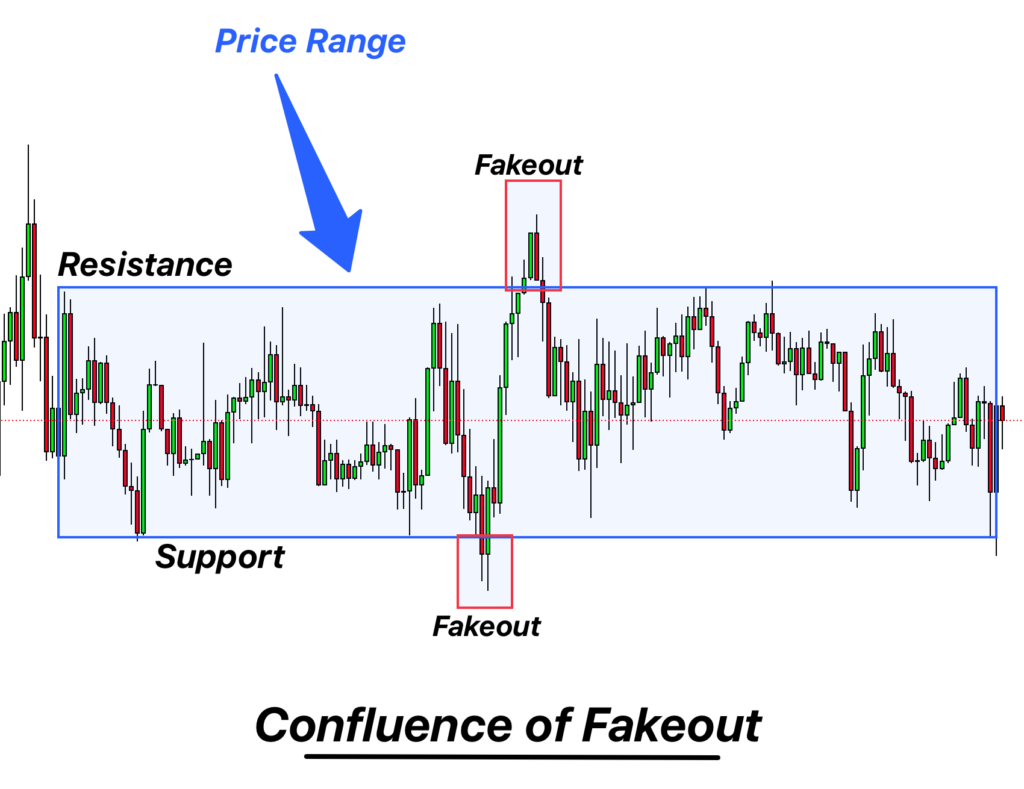
5. Fakeouts
Fakeouts are like market tricks. It’s when the price seems to move out of our marked zones but quickly comes back.
- Buying with a Fakeout: Let’s say the price drops below our marked support but then comes right back up and stays in the range. This means the drop was just a trick, and there’s a good chance the price will move up towards the resistance.
- Selling with a Fakeout: If the price goes above our resistance but falls back inside the range, it was a trick move upwards. The price might be heading down towards the support. Watch out for these tricks – they can give good hints about the next big move!
Pairing these patterns or RSI readings with other confirmations in a range can increase your confidence in making a trade decision.
How to trade the Price range?
You must follow the few given steps to trade the price range for better results.
- Spot the Sign: Begin by identifying Doji or high wave candlesticks on a higher timeframe. These candlesticks indicate market indecision and can be precursors to a range formation.
- Mark the Boundaries: Once you’ve spotted these candlesticks, mark the upper and lower boundaries they create. This gives you the initial structure of your potential range.
- Dive Deeper with Lower Timeframes: Switch to a lower timeframe. Adjust the boundaries you marked based on the closing and opening prices of swing highs and swing lows. This fine-tunes your range, ensuring it’s in line with more immediate price action.
- Position and Wait: Stay patient and monitor the price as it moves within the range. Wait for it to approach either the resistance (upper boundary) or support (lower boundary) zones.
- Seek Confirmation: Before entering a trade, look for confirmations. This can be in the form of:
- Reversal candlestick patterns suggesting a move away from the boundary.
- Chart patterns that align with a potential reversal.
- Indicator readings, like an overbought RSI at resistance or an oversold RSI at support.
- Setting Your Take Profit: One of the benefits of range trading is the clarity it offers in terms of exit points. If you enter a buy trade at support, your take profit would be at the resistance level. Conversely, if you enter a sell trade at resistance, your take profit would be at the support level.
Wrapping Up
Range trading, when approached with precision and patience, offers traders a structured way to navigate the market’s quieter periods. By understanding the nuances of Doji and high wave candlesticks and their implications on lower timeframes, you’re tapping into the market’s rhythm. The key lies in spotting these setups, confirming with additional tools, and executing trades with discipline.
Remember, in the vast ocean of trading, sometimes the calmest waters can yield the richest treasures. Stay observant, stay informed, and may your trades be ever in your favor.