
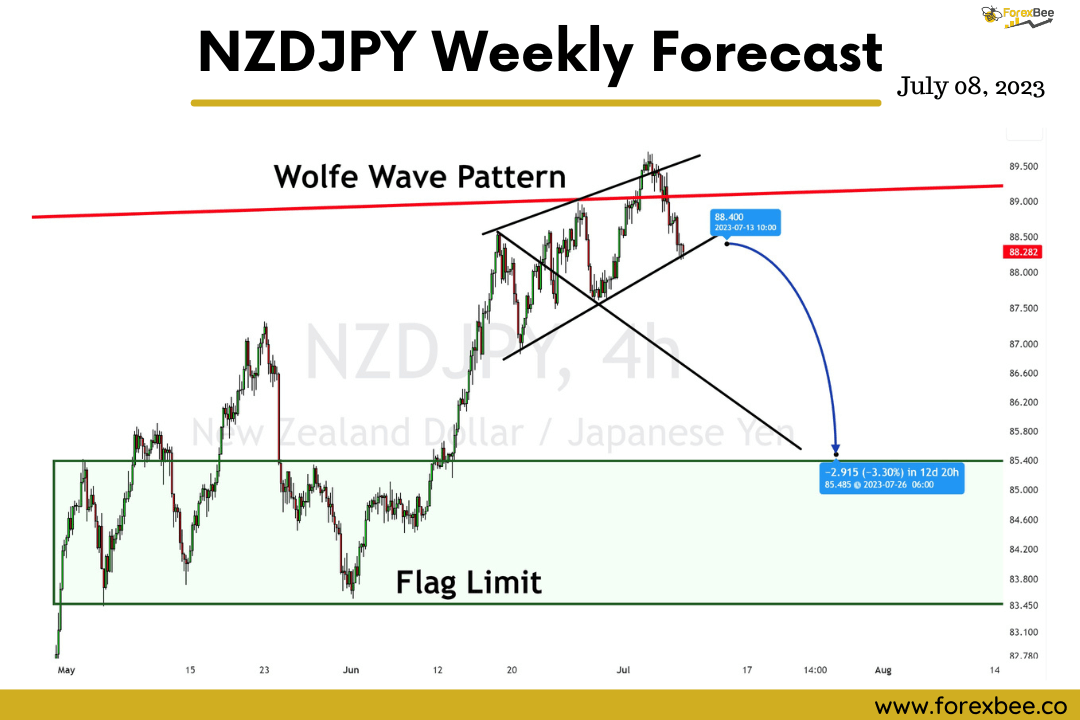
In this NZDJPY analysis, I have applied the price action patterns to forecast the NZDJPY currency pair. According to the analysis on the 4-hour timeframe, the price will go down to the flag limit zone.
In this price action analysis, I have used the following terms:
- Resistance Trend line
- Evening star candlestick pattern
- Wolfe wave
- Flag limit
Resistance line and Evening star pattern on Higher timeframe
Here I have chosen the daily timeframe as a higher timeframe. On the daily timeframe, NZDJPY is at the resistance line, forming a bearish evening star candlestick pattern. These two price action parameters show a bearish indication. Bears will take over the bulls, and price will decrease. This was a simple analysis on a higher timeframe to check the future price direction.
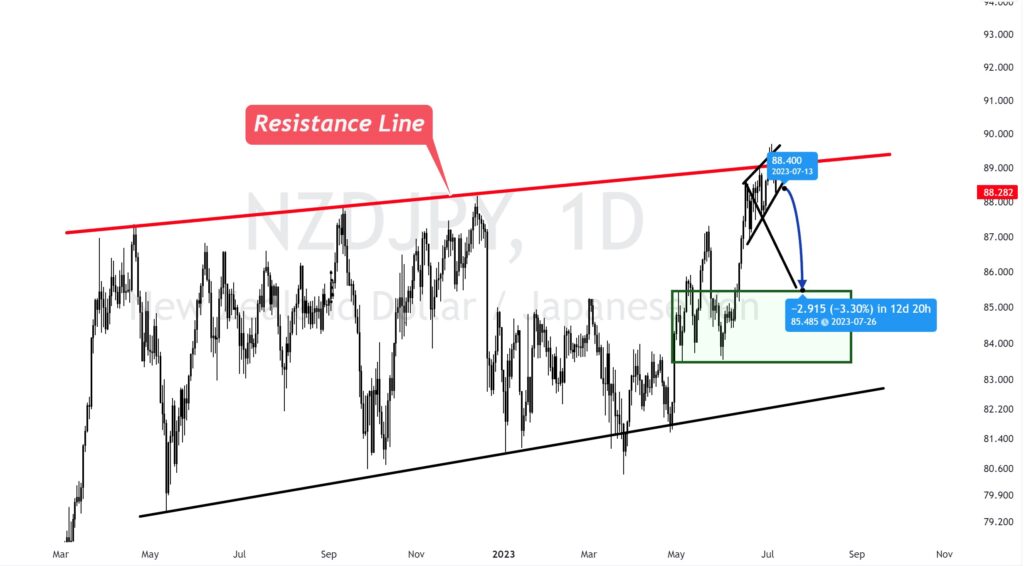
Now we’ll switch to a lower timeframe to confirm the validity of this bearish signal.
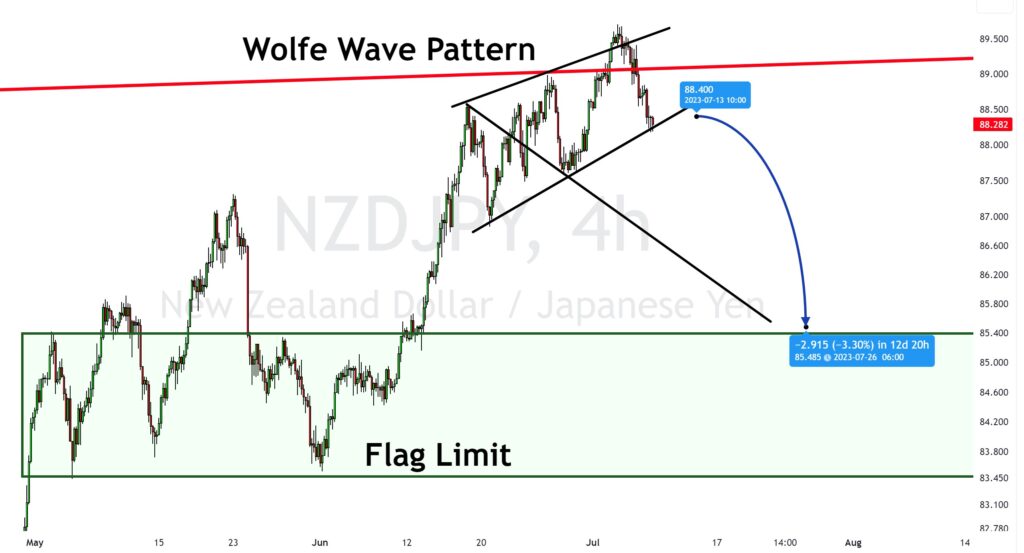
Wolfe Wave Pattern on the lower timeframe.
After switching to the 4H timeframe, a bearish wolfe wave pattern forms on the chart. It has not broken the trendline yet, but the break of the trendline in the bearish direction will be an excellent signal to open a sell trade.
After finding the entry point on a lower timeframe, I looked for a target level.
The target level is as important as an entry because a trader must know where the price is moving or which strong levels on the chart can bring trend reversal.
That’s why I have drawn a flag limit level that’s powerful. It will act as a support level when the price reaches this level. I chose the high flag limit zone as a take-profit level.
Conclusion
In this forecast, I did the higher timeframe analysis and then aligned the direction of price action parameters to predict the future direction of NZDJPY in a 4-hour timeframe.
Great analysis – thanks for sharing.
Its off to a great start!!