
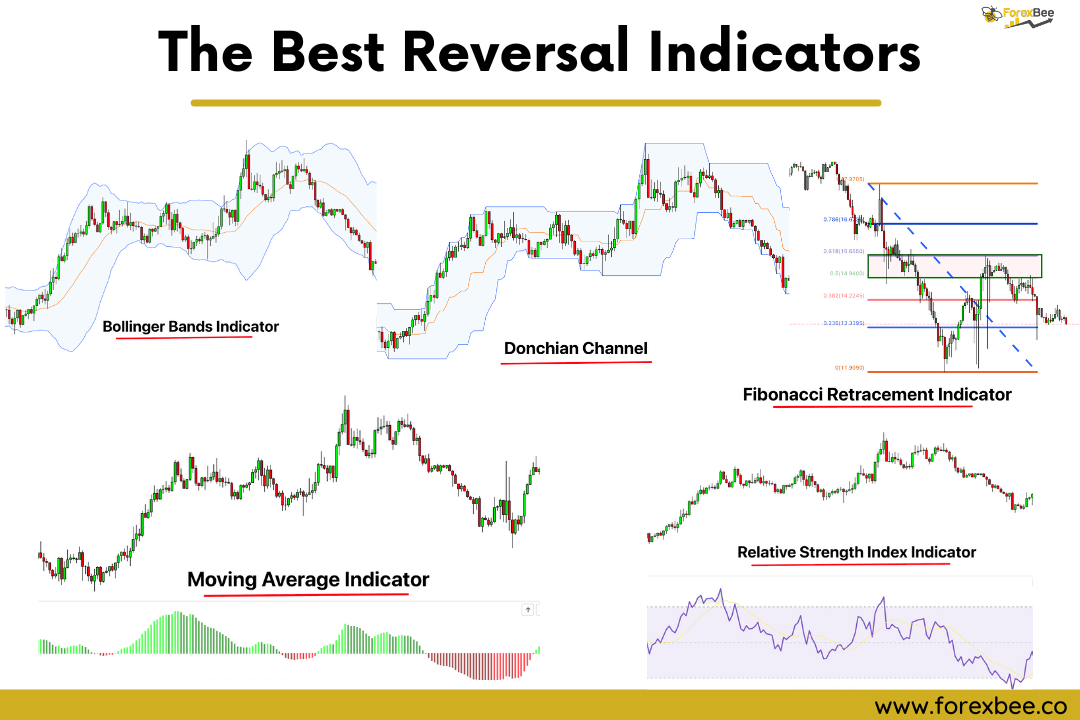
Introduction
Reversal indicators are defined as charts, signals, lines, or digits that help a trader in the identification of the reversal in a trend. Computational tools or mathematical formulas often create these indicators.
Reversal indicators play an important role in studying a trading market. Modern technical traders use these indicators as tools for the technical analysis of a trading chart.
What is a reversal in trading?
If we have a look at a trading chart, it is often represented in the form of candlesticks or lines. The price moment of an asset defines the trend of the market. If an asset is gaining value, the chart shows an uptrend. On the other hand, in the case of the devaluation of an asset, a chart shows a downtrend.
The value of the assets is a volatile phenomenon as the prices never stay at a constant level for a long time. As the prices take a boom or dip, they show a reversal. So, the reversal in a trading market is of two types.
- Bullish/uptrend
- Bearish/downtrend
What are reversal indicators?
Reversal indicators are the indicators that help a trader to identify or predict the future market trend. Suppose the price of an asset is exhibiting a bullish sentiment. It is considered as the buying time. If the indicator predicts the reversal, it means soon the trend may face a bearish reversal. Such signals are helpful in trading to make buying and selling decisions.
A technical trader uses several types of tools to predict the future trend of the market. Major tools are,
- Candlestick patterns
- Chart patterns
- Trading indicators
My main focus in this blog is to explain the best reversal trading indicators.
List of the best reversal indicators
The world of indicators is becoming saturated day by day. It is difficult to choose one indicator alone and rely on it for your financial career. The combination or confluence of the different indicators with other reversal strategies often results in a better success ratio. Some of the best reversal indicators are given below. Properly using these indicators with smart trading can significantly improve your trading experience.
1. Fibonacci retracement levels
Fibonacci retracement levels are very effective reversal indicators. The most commonly used percentage ratios in these levels are,
- 23.6%
- 38.2%
- 50%
- 61.8%
- 78.6%
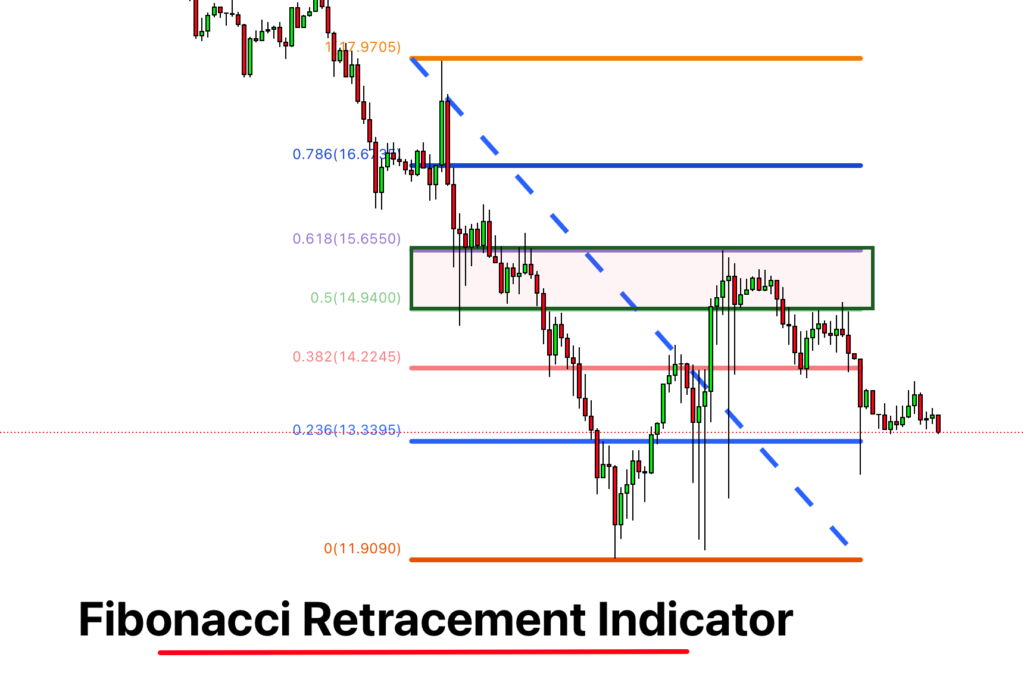
These levels are lines that are in a horizontal position. These lines, with regard to the percentage levels mentioned above, indicate the occurrence of a support and resistance zone. The percentage shows the fluctuation or retraction of the price from the prior move.
Pros
- These levels can be formed between price spots, i.e., high/low.
- Fibonacci retracement levels are easy to understand.
- They are effective in drawing a support and resistance zone.
- They indicate a reversal.
- They are based on nature.
Cons
- They can create false signals to some extent.
- Price sometimes doesn’t fall on the support/resistance levels.
- Some other tools are signals are required to use with confluence to Fibonacci levels.
- Many levels in this system confuse a trader, and he struggles to find the most suited levels.
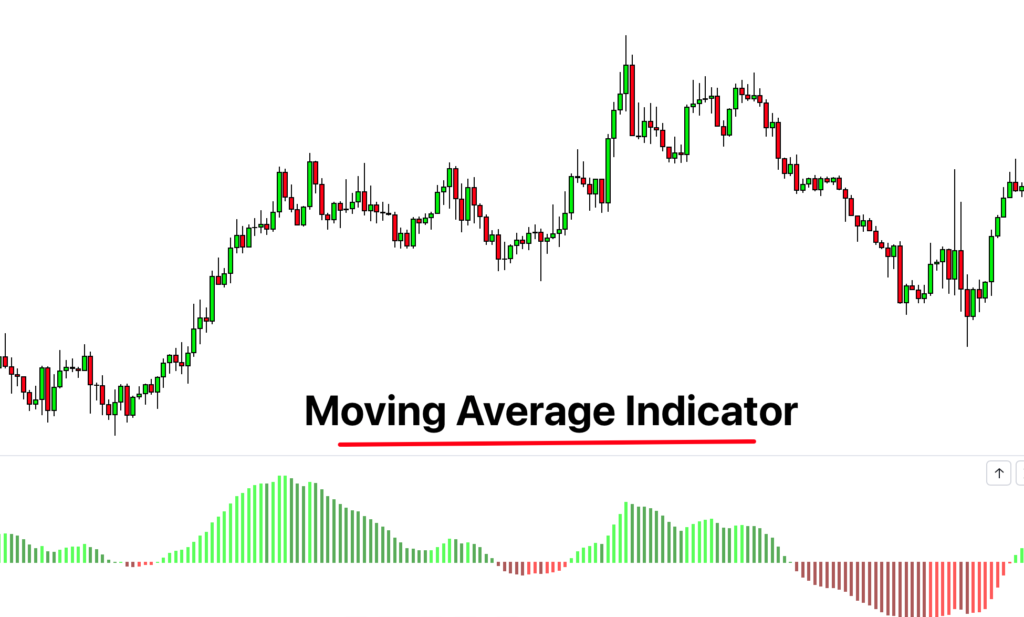
2. Moving averages
Moving averages are a significant indicator that technical traders use to identify a reversal. These indicators consist of lines, which represent a trend. If a line moves at a higher level, it indicates a bullish trend; on the other hand, the lower line indicates a bearish trend.
The movement of these lines represents the trend reversal in the future. A bearish trend encourages the sell, and a bullish trend promotes buying.
There are many types of moving averages indicators, like,
- MACD
- MACD 4C
- ADX
- TEMA
Pros
- Moving averages indicators are easy to understand.
- They provide necessary information about a trend reversal.
- These indicators generate technical signals.
- Even beginners can use these indicators effectively.
Cons
- They often lag.
- Lagging can lead a trader to miss opportunities.
- Often create false signals.
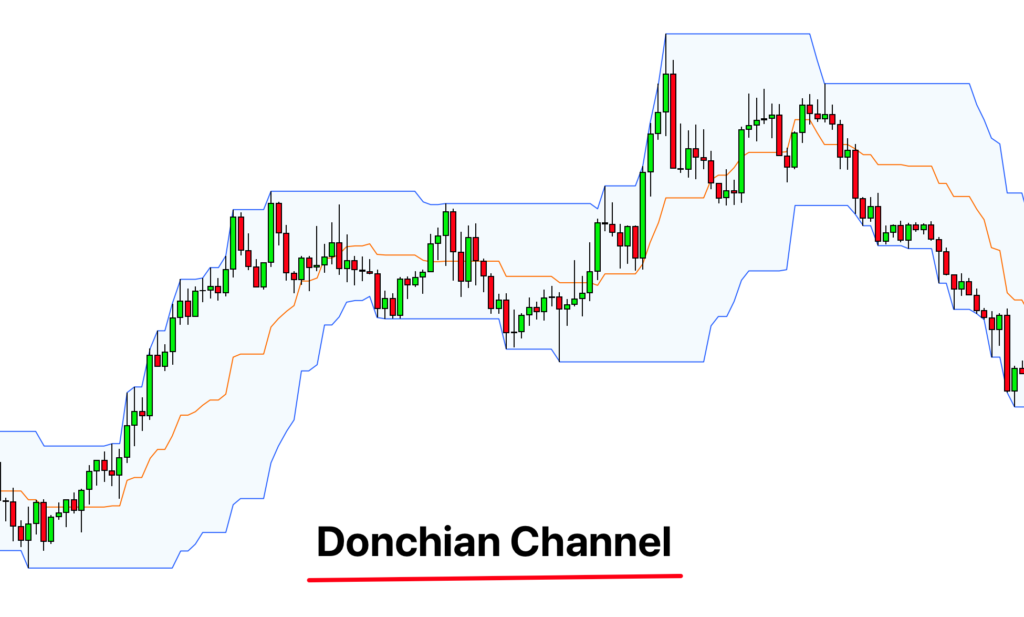
3. Donchian Channel
A Donchian channel is a type of lines that represents the moving averages. It consists of three lines,
- Higher band
- Middle band
- Lower band
A higher band represents a bullish trend, and the lower band refers to a bearish trend. The middle band calculates the averages between the highest highs and the lowest low periods.
A trader can get significant information about a trend reversal as the upper and lower bands provide effective information about the price peaks.
Pros
- These are easy to use and very user-friendly.
- A user can observe a market in a significant time period of his choice.
- They are strong reversal indicators.
- They provide information about market breakouts.
Cons
- Donchian channels sometimes don’t represent the current market price.
- A trade may miss some opportunities.
- These channels can generate false signals.
- They require a confluence with other indicators or trading tools
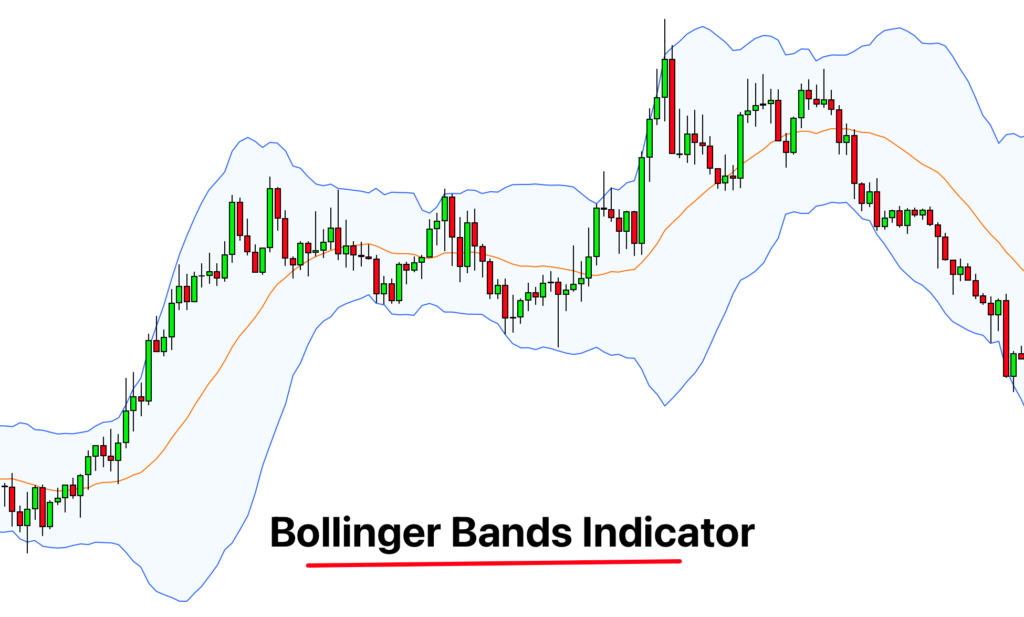
4. Bollinger bands
Bollinger bands are a very effective tool for indicating the reversal in a volatile market. They consist of three bands.
- Upper band
- Middle band
- Lower band
The upper band suggests a bullish trend. On the other hand, a lower band represents the bearish market. The movement of these bands indicates a reversal in the market.
Pros
- A trader finds these bands very convenient to use.
- The beauty of Bollinger Bands is it works in a volatile market.
- They help to form a trading strategy regarding the reversals in the market.
Cons
- Price actions that occur outside the Bollinger bands can confuse a trader.
- Sometimes they can generate false signals.
- It is not wiser to use Bollinger bands alone as they require a confluence with other indicators or tools.
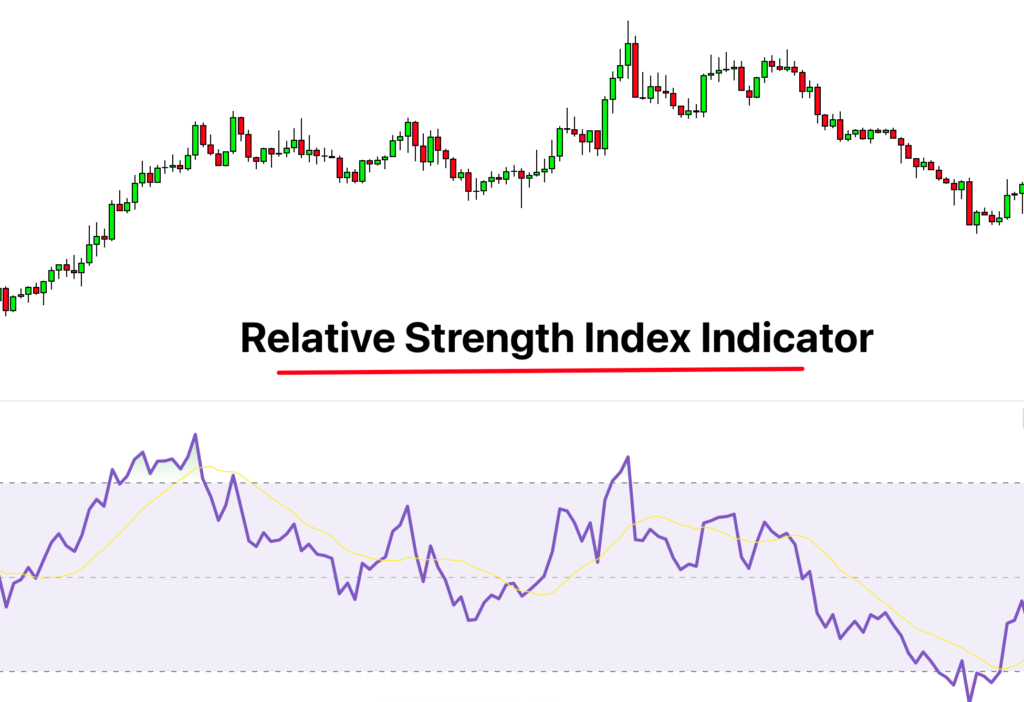
5. Relative strength index (RSI)
The relative strength index is a type of oscillator. It is a well-reputed reversal indicator. RSI uses number values ranging from 0-100. A trader can identify the reversal in the trend by these numbers.
If the number value is below 30, it is a bearish trend. As this number reaches 40/50, it means a trend is changing, which represents the reversal. The value above 70 is a peak bullish trend and a strong buying signal.
Pros
- It is a very easy-to-use indicator. All you have to do is read the number values like a high school kid.
- RSI is a strong reversal indicator.
- It indicates the price behavior in a market.
- It provides information about the valuation of an asset.
Cons
- It can create false reversal signals.
- In the case of a trading range, RSI is not an effective indicator.
- In shorter trends, a trader can’t rely on this indicator.
Advantages of using reversal indicators
Modern technical traders promote the use of reversal indicators. There are the following advantages of using the reversal indicators.
- They provide information about future market trends.
- These indicators facilitate a trader in his crucial decisions.
- Reversal indicators provide significant information to traders about the opening and closing of the trade.
- They help in controlling the emotional state of the traders and promote wiser decisions.
- The confluence of these indicators enhances the success ratio.
Conclusion
Reversal indicators are very important technical trading tools. They aid traders in multiple ways regarding current and future decisions. The use of the reversal indicators can impact the profits/losses to improve the trading experience of a trader.
The confluence of reversal indicators with other technical tools can enhance the success ratio.