
Definition
Double doji is a candlestick pattern in which two doji candlesticks form consecutively. It shows the ranging market structure and indicates a pause in price trend.
There are four types of doji candlesticks, and each pattern has a different meaning. It also depends mainly on the location of pattern formation on the chart.
In this article, you will learn about the types of doji and double doji candlesticks. In the end, I will explain a simple and effective dual doji trading strategy.
How to identify a double doji candlestick pattern?
Types of doji candlesticks:
- Doji
- Dragonfly doji
- Gravestone doji
- Long-legged doji
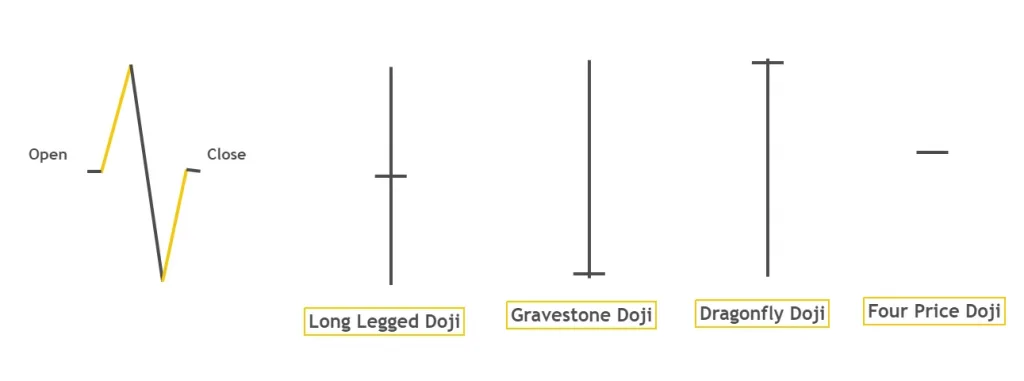
Each doji candlestick shows a different perspective of institutional traders. Like Dragonfly and gravestone doji shows the trend reversal in the market. Whereas Doji cand long-legged doji indicates a pause in the trend and ranging market structure.
Due doji candlesticks pattern is a very powerful price pattern.
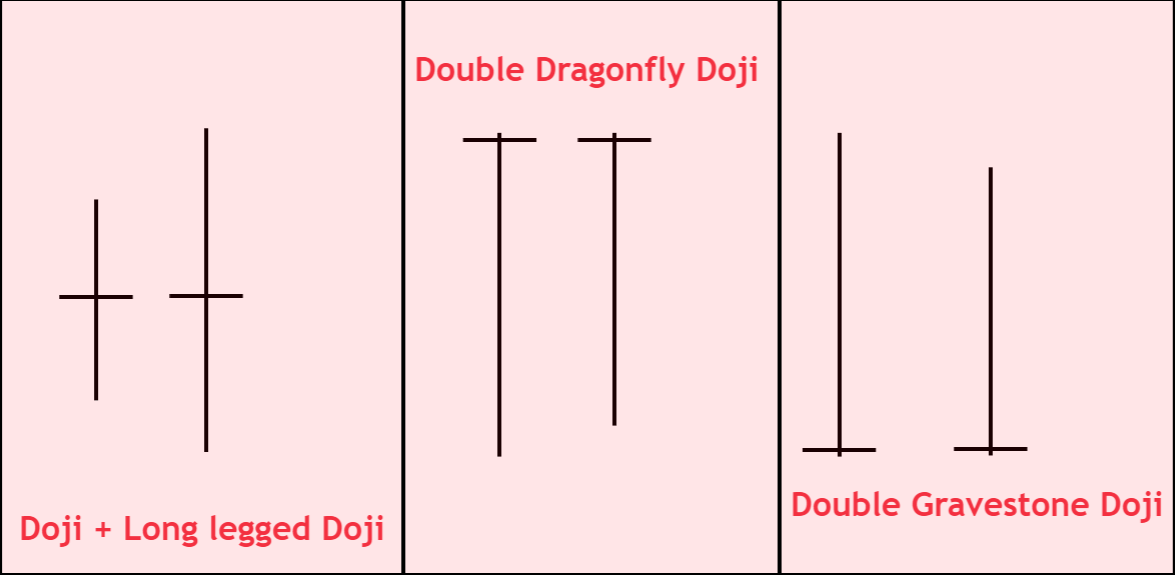
Double doji patterns
A double doji pattern can form in three pairs. Each pair is a combination of two doji candlesticks.
- Doji and long-legged doji pair
- Two dragonfly doji candlesticks pair
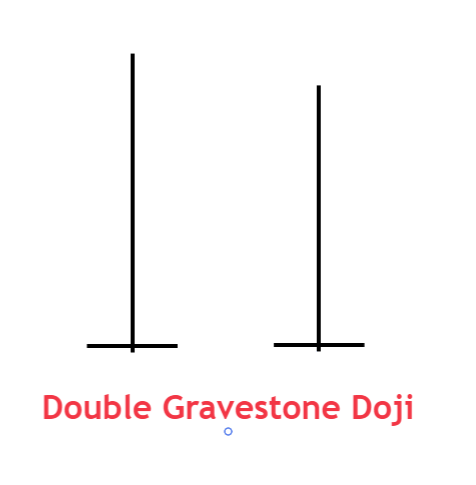
- Two Gravestone doji candlesticks pair
More combinations can also form, but I will explain only powerful double doji patterns.
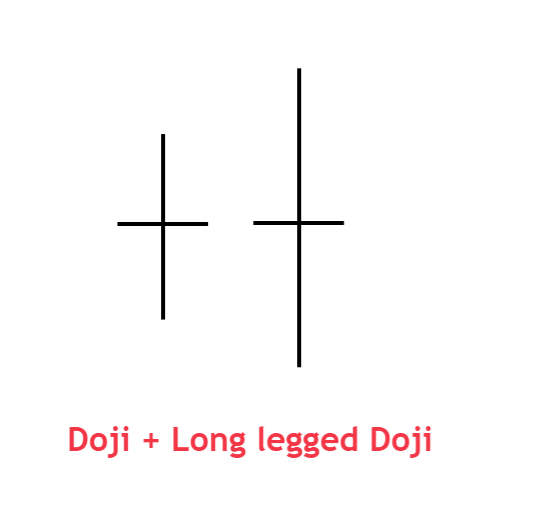
Doji and long-legged doji
When these two candlesticks form consecutively, then it shows sideways price movement. It also represents the broadening pattern formation which shows that market is deciding its direction. From this point, the price will determine its trend direction either to choose the bullish direction or bearish direction.

Find High Probability Trades with this ADVANCED Candlestick Patterns Course
The Ultimate Candlestick Patterns Course That Will Help You To Trade Better
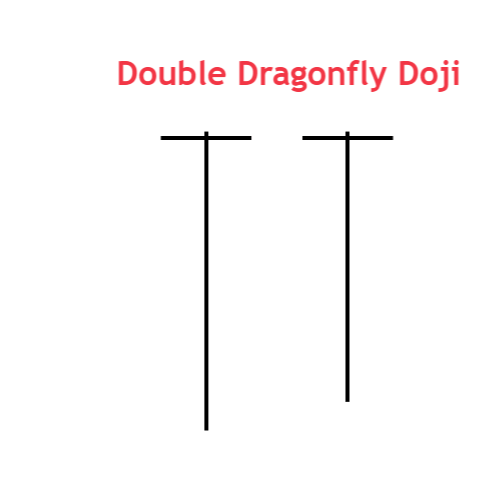
Two dragonfly doji candlesticks
A dragonfly doji candlestick is used to show bullish trend reversal. The long shadow below the candlestick body shows the rejection from a key level. Rejection from key level shows that buyers are willing to buy from that level, and they are now stronger than sellers. That’s why they are pushing the market up in the form of a long shadow below the candlestick’s body.
When the rejection occurs two times, the probability of trend reversal increases. That’s why the formation of two dragonfly doji candlesticks increases the probability of bullish trend reversal compared to a single dragonfly doji.
Two gravestone doji candlesticks
A single gravestone doji shows the bearish trend reversal. The long shadow above the candlestick indicates price rejection from the key level.
In the same way, when two price rejection forms consecutively in the form of dragonfly doji, the probability of bearish trend reversal increases.
It would be best to learn to trade a single gravestone doji candlestick before using the double gravestone doji.
What does the double doji pattern tell traders?
A single candlestick is not enough to explain the complete market structure on a single chart. For example, the doji candle shows a trend pause, but how long a trend pause will remain? A single doji cannot answer this question.
When two doji candlesticks form, it increases the probability of winning in an analysis. For example, a gravestone doji or dragonfly doji indicates a trend reversal. But when two identical types of candlestick form consecutively, then the probability of the result will increase.
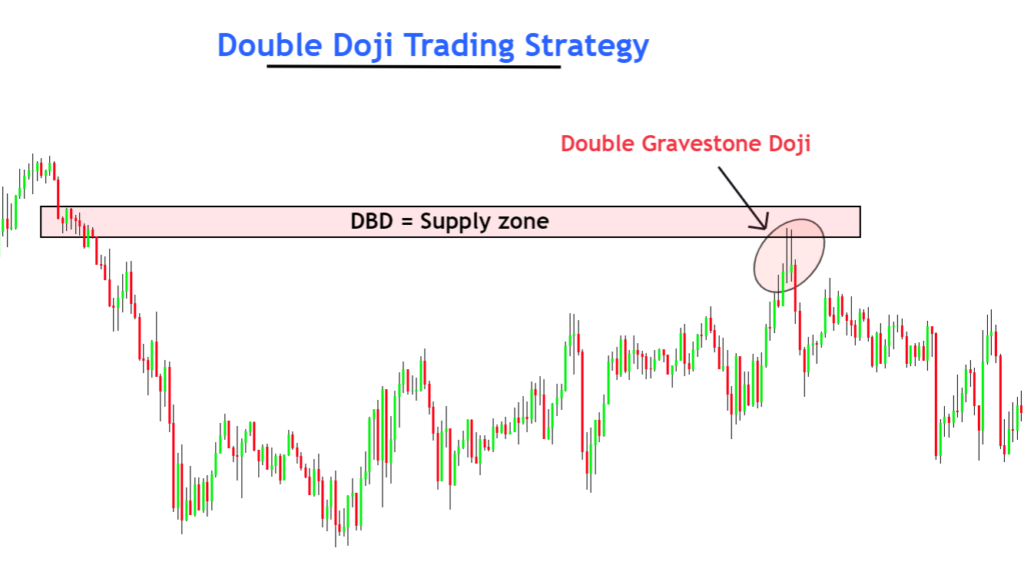
How to trade double doji candlestick patterns?
This trading strategy is the combination of support resistance levels or supply-demand zones and a double doji candlestick pattern.
Place a buy order
When double dragonfly doji pattern forms at the demand zone or support level, place a buy order. It would be best to set stop loss a few pips below the zone or level.
Open a sell order
When a double gravestone doji pattern forms at the resistance or supply zone, place a sell order. Stoploss will be placed a few pips above the zone
Tip: we cannot predict the take-profit levels using the candlestick patterns. That’s why it is advised to target previous price swing levels or use the Fibonacci tool to get target levels.
The Bottom line
The candlestick patterns are just the price action that shows the repetitive market behavior. We should understand the structure of those patterns to trade effectively.
Superb. Just enough knowledge to digest and understand.