
Definition
Bullish mat hold is a trend continuation candlestick pattern consisting of five candles and a gap. It shows that the previous trend will continue.
It is like the rising three methods candlestick pattern, but there is a gap in both candlestick patterns. Bullish mat hold pattern primarily forms in stocks and indices. It is an infrequent pattern that is why it is not used in forex day trading or swing trading.
How to identify the bullish mat hold?
The rules to find mat hold pattern on the price chart are similar to the rising three methods pattern expert a gap of gap up in the pattern.
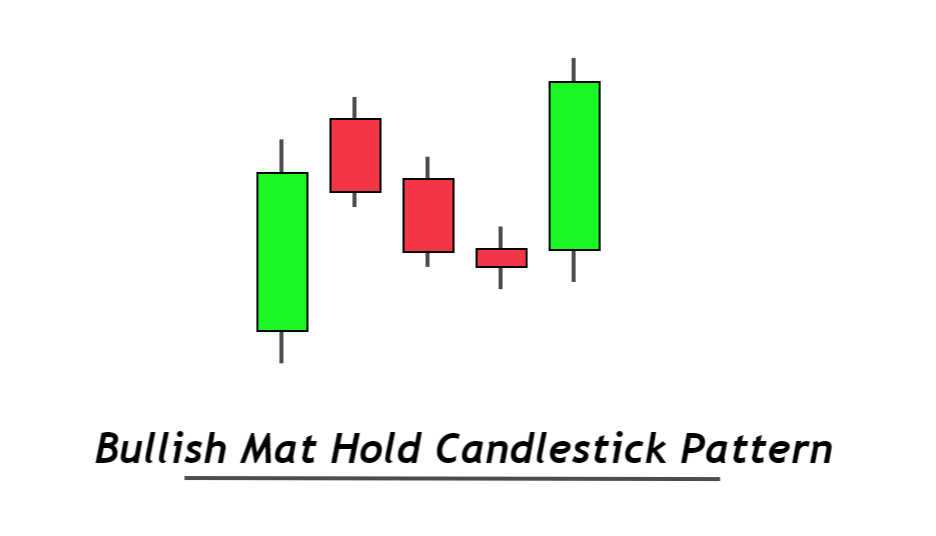
Here’s the four-point guide to mat hold pattern
- The first candlestick will be a bullish candle with a high body to wick ratio.
- The second candlestick will open with a gap up, closing below the opening price. Its size will be smaller as compared to the first candlestick.
- The third and fourth candlesticks will also be bearish, and the size of these candles will resemble the second candlestick.
- The fifth candlestick will be a big bullish candlestick, and it will close above all previous candlesticks in this pattern.
Pro tip: second, third, and fourth candlesticks should always close above the opening price of the first bullish candlestick. Otherwise, it will not be a bullish mat hold pattern.
Bullish mat hold: Information Table
| Features | Explanation |
|---|---|
| Number of Candlesticks | 5 |
| Prediction | Bullish trend continuation |
| Prior Trend | Bullish trend |
| Relevant Pattern | Rising three methods |
Understanding the Bullish Mat Hold pattern
This candlestick pattern is similar to the rally base rally supply and demand concept.
Let’s read the price to understand the price action.
I will divide this candlestick pattern into three phases for easy understanding.
Phase 1
The first bullish candlestick represents a bullish impulsive wave of buyers. It shows that buyers are in control, and the price is increasing with time. This is phase 1 of the market.
Phase 2
The next three candlesticks represent a retracement wave. Obviously, after an impulsive wave, a retracement wave will form. The three small bearish candlesticks show the retracement phase
Phase 3
In phase 3, a bullish candlestick will form, breaking all the previous highs making a new higher high.
In terms of supply and demand, all three phases show the formation of a demand zone. It means buyers are coming into the market, and the demand for the currency asset is increasing. That’s why the bullish trend will continue.

Find High Probability Trades with this ADVANCED Candlestick Patterns Course
The Ultimate Candlestick Patterns Course That Will Help You To Trade Better
Difference between rising three methods and bullish mat hold pattern
The significant difference is that in the bullish mat hold pattern, the second candlestick will open with a gap after the first bullish candlestick. In contrast, the second candlestick will open at the previous candle’s closing price in the rising three methods. It will not open with a gap up.
Due to the limitation of the gap, the mat hold pattern is rare in forex charts.
The Bottom Line
Use the daily timeframe to find out the mat hold candlestick pattern on the chart in stocks. On smaller timeframes, the accuracy of the pattern will decrease.
You can also use other technical analysis tools with this pattern to increase the winning ratio in trading.